-
-
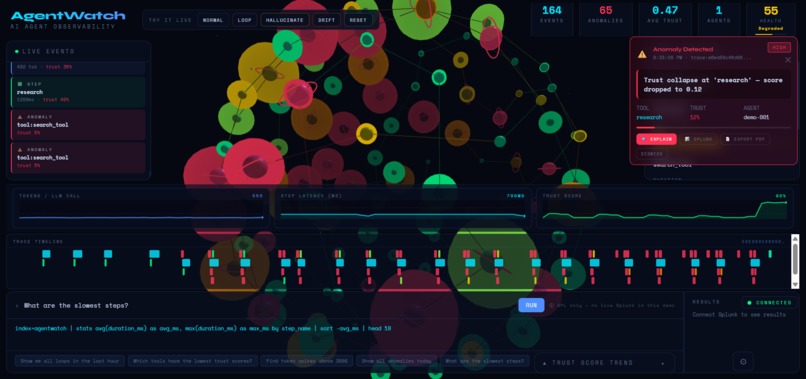
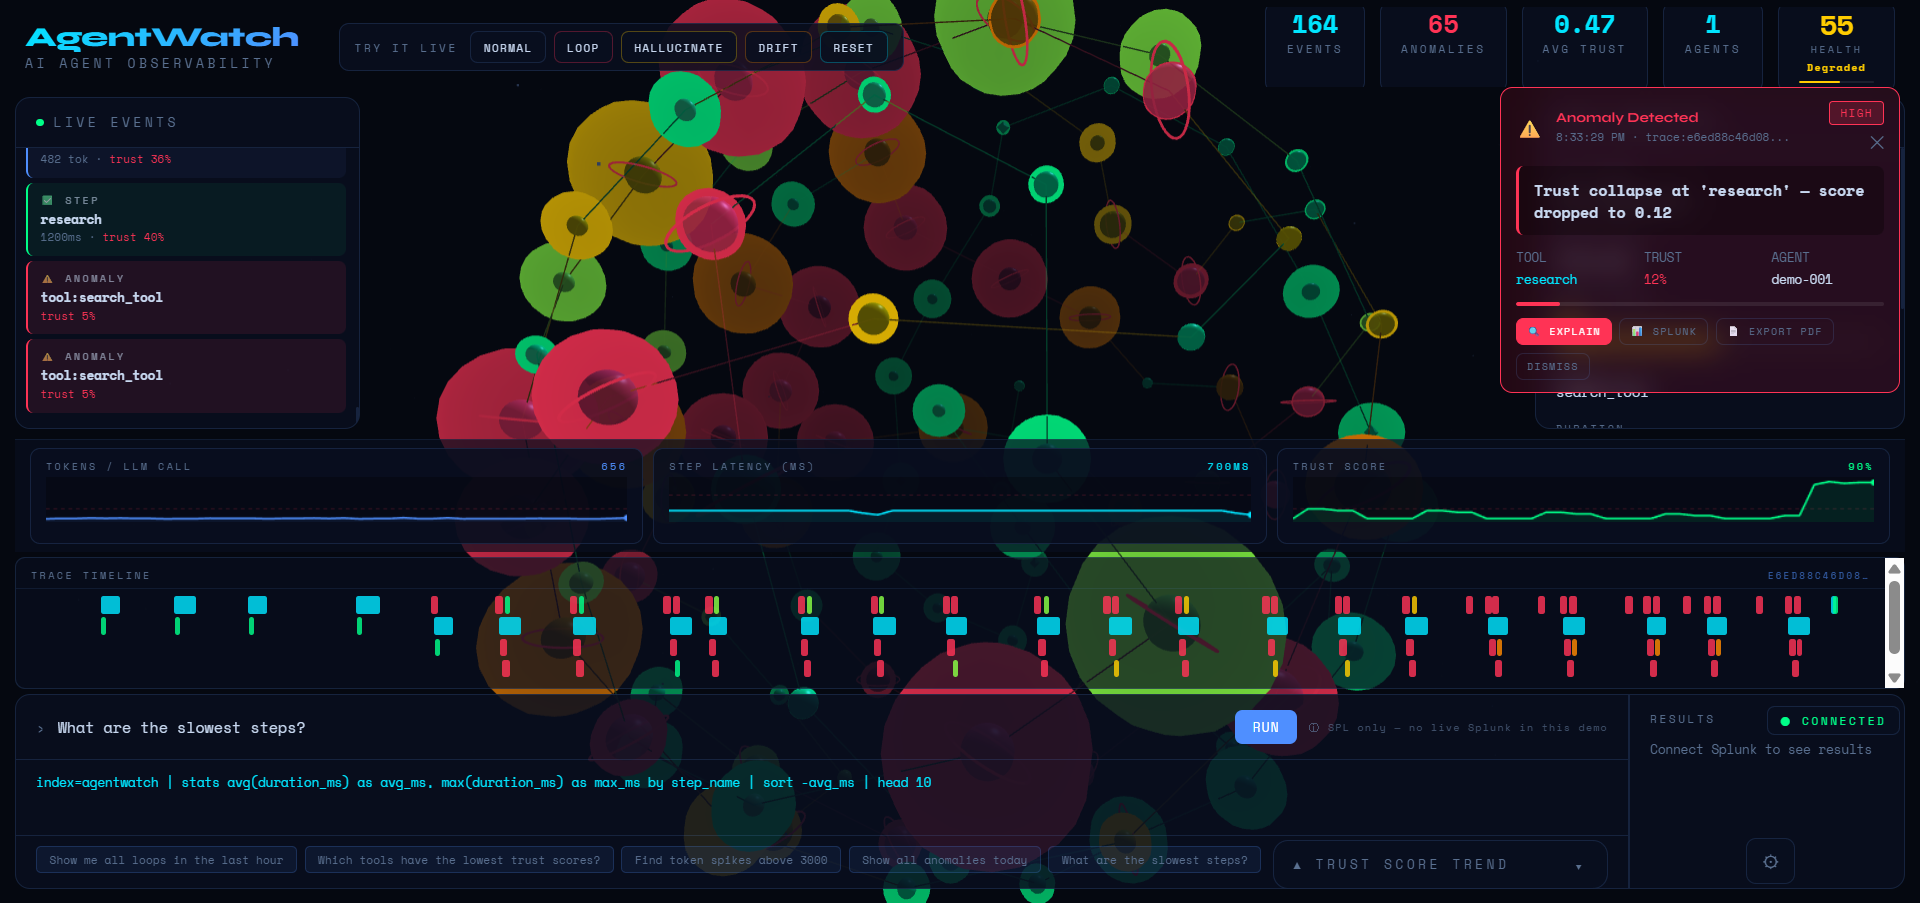
Live Three.js brain graph — trust collapse anomaly detected at 'research' (12%), with Explain/Splunk/PDF actions and live SPL assistant
-
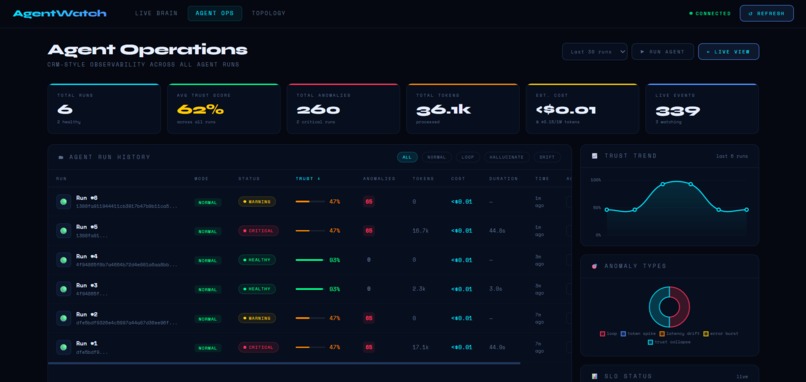
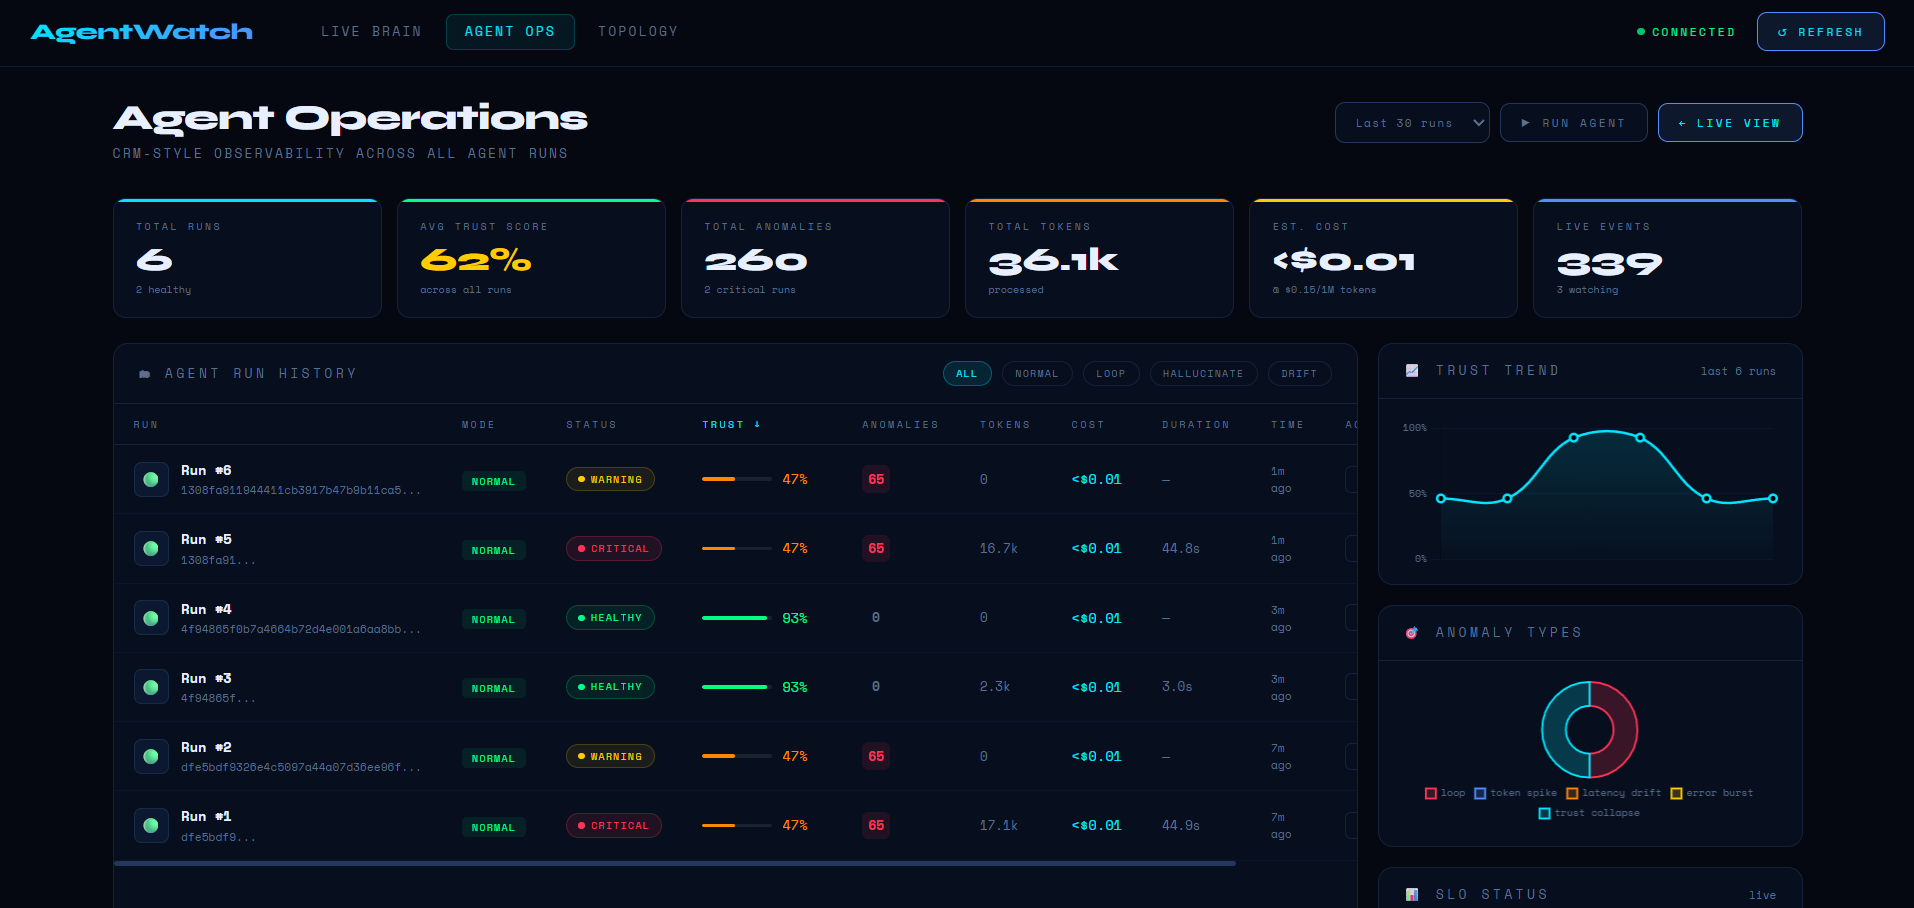
Agent Operations CRM dashboard — 6 runs, 62% avg trust, 260 anomalies, trust trend chart, and anomaly type breakdown by category
-
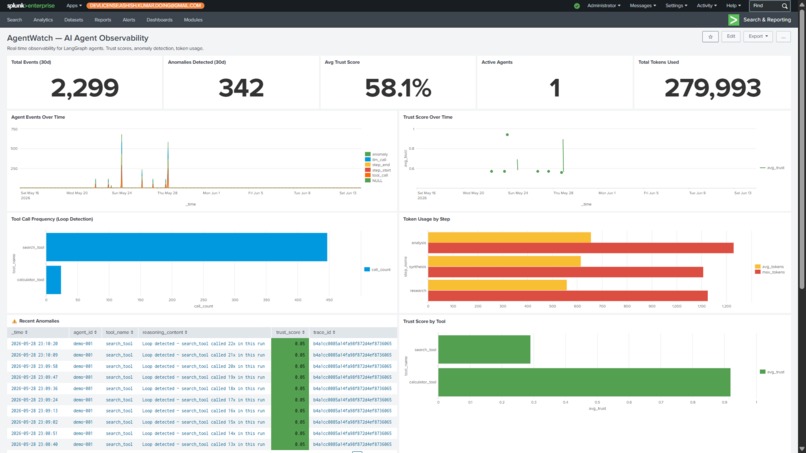
Native Splunk dashboard with real indexed data: 2,299 events, 342 anomalies, 58.1% avg trust, loop detection and trust-by-tool panels
-
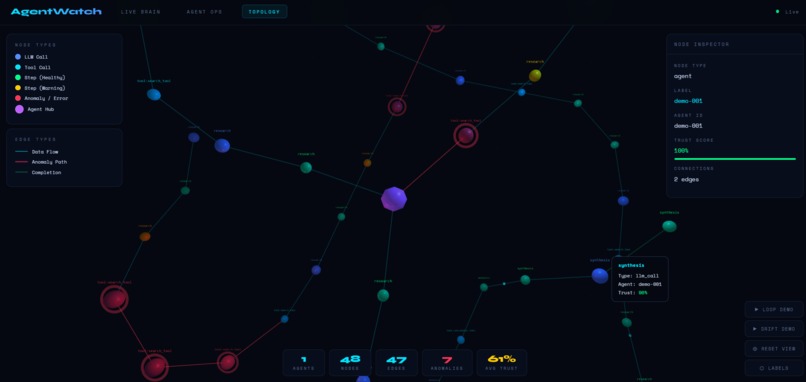
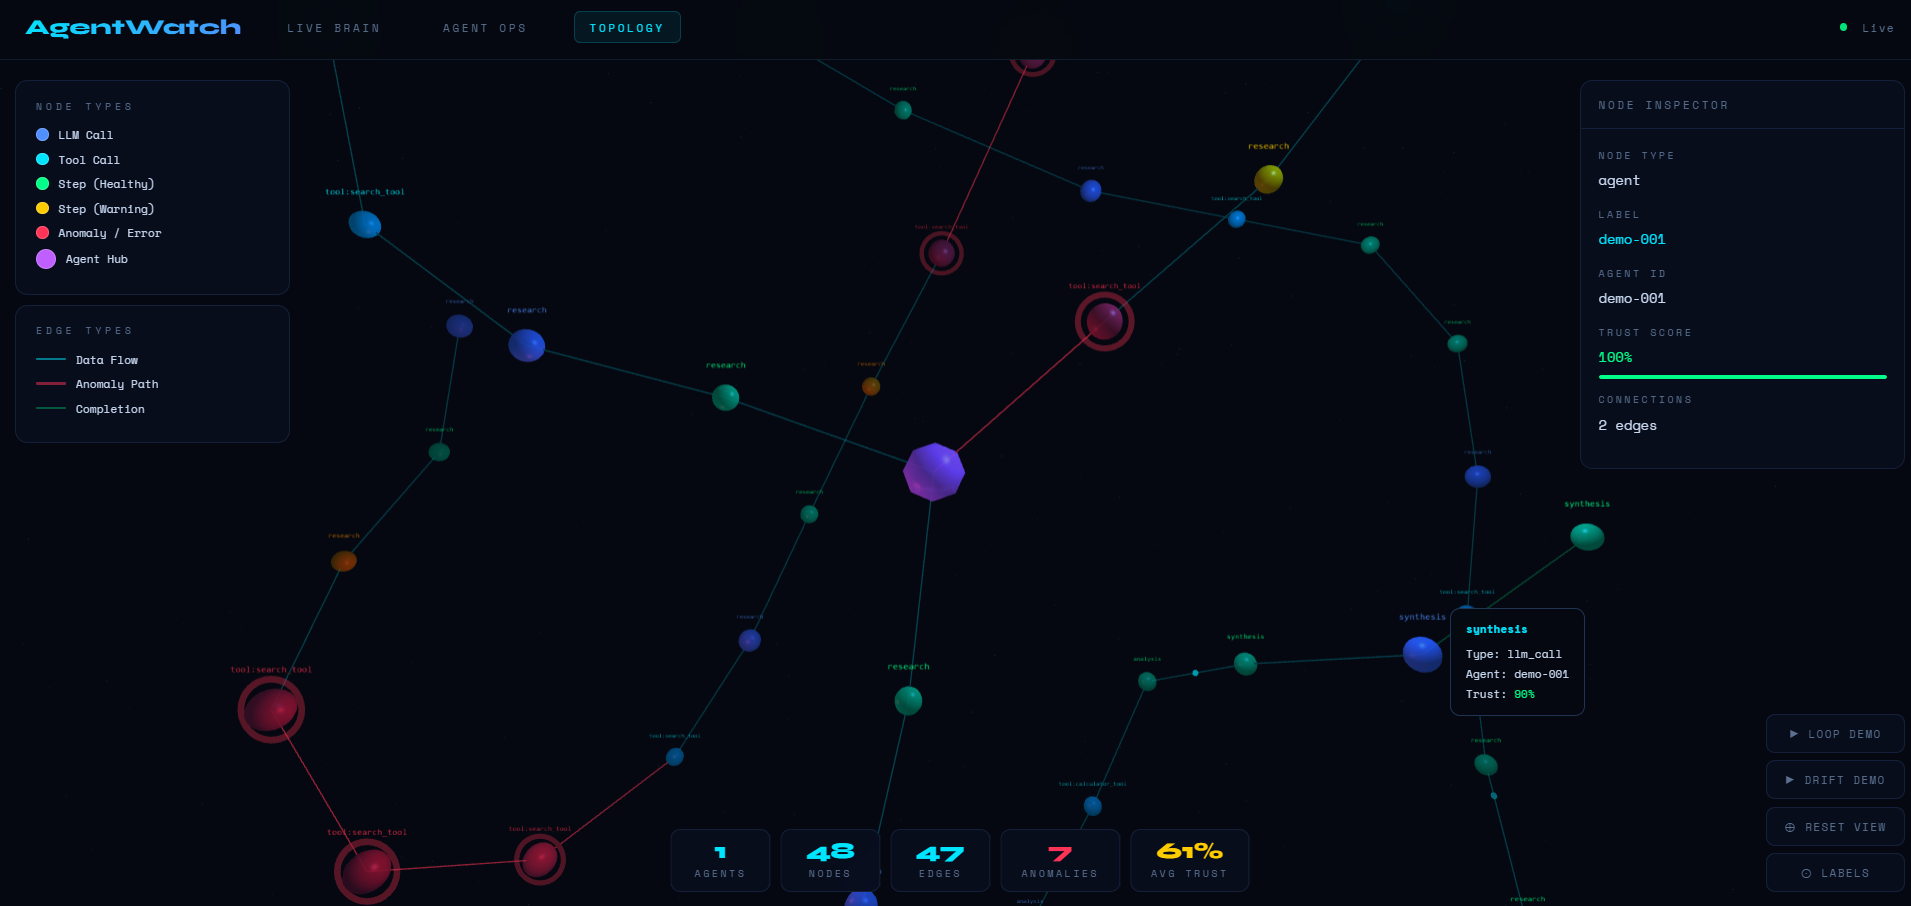
Multi-agent topology map — 48 nodes, 47 edges, agent hub with anomaly paths in red, node inspector showing trust score

Inspiration
AI agents are entering production faster than teams can instrument them. 34% of production AI agents fail silently due to missing observability tooling — when a LangGraph agent calls the same tool 23 times in 4 seconds, or token counts spike to 8,000+, most teams find out hours later from user complaints or runaway API bills. Mean time to detect a failure without proper tooling is 4.2 hours, and loop failures alone cost enterprises $2,400/hour.
Teams already running Splunk have no native option for this — existing tools like LangSmith and Arize are SaaS-only, forcing a separate monitoring stack on top of infrastructure they already pay for. We wanted to fix that: build agent observability directly on Splunk's existing AI capabilities.
What it does
AgentWatch wraps any LangGraph, CrewAI, OpenAI Agents SDK, or AutoGen agent with OpenTelemetry, streams its behavior into Splunk in real time, and runs a two-stage anomaly detection pipeline.
- Stage 1: an in-process AnomalyDetector pre-filters events before they reach Splunk, catching loops, token spikes, latency drift, error bursts, and trust collapse with live-configurable thresholds
- Stage 2: SPL queries feed tool-call time-series into Splunk AI Toolkit's anomalydetection command for statistical confirmation (99.25% confidence on our test data)
From there:
- "Explain This" gives a Foundation-Sec-1.1-8B root cause explanation, a recommended fix, and a ready-to-run SPL query
- "Run Autopsy" produces a post-run performance grade (A–F) with cost estimate and fix recommendations
- "Export PDF" generates a full incident report with reasoning and SPL queries
- A live Three.js "brain" graph visualizes agent reasoning as a force-directed network, with anomaly nodes glowing red in real time
- An Agent Operations CRM dashboard (/ops) tracks run history, trust trends, SLO status, and per-run cost
- A multi-agent topology map (/topology) visualizes how multiple agents and steps connect
- Splunk AI Assistant lets you type "show me all loops in the last hour" and get live SPL results
- Slack alerts fire automatically on CRITICAL anomalies
How we built it
The core is a FastAPI backend with WebSocket streaming, instrumented via OpenTelemetry. We built agentwatch_sdk.py and agentwatch_hooks.py to give zero-config instrumentation across five different agent frameworks — a single @watch decorator or watch_graph() call for LangGraph, and dedicated hook classes for CrewAI, OpenAI Agents SDK, and AutoGen.
Events flow through the in-process AnomalyDetector before being sent to Splunk via HEC, indexed under agentwatch:otel. From there, Splunk MCP Server makes all telemetry searchable via SPL directly from our UI, Splunk AI Toolkit runs statistical anomaly detection on tool-call time-series, Foundation-Sec-1.1-8B powers the Explain/Autopsy/PDF features, and Splunk AI Assistant handles natural language to SPL translation.
The frontend has three pages — a live Three.js force-directed "brain" graph, a Chart.js-powered Agent Operations CRM dashboard, and a second Three.js topology map for multi-agent systems — all updating live over WebSocket. We also built a complete Splunk Cloud app package (splunk_app/agentwatch/) with index, HEC input, field extractions, and 7 pre-built saved searches, ready for Splunkbase.
We backed everything with 81 tests across two files, covering all five anomaly detection types and all 15 API endpoints, including live-propagation tests that prove changing a threshold via the UI immediately changes detector behavior — not just stored config.
Challenges we ran into
Getting two independent anomaly detection layers — our in-process pre-filter and Splunk AI Toolkit's statistical model — to agree on what counts as an anomaly without duplicating alerts took careful threshold tuning. Making the system framework-agnostic was also tricky: LangGraph, CrewAI, OpenAI Agents SDK, and AutoGen all expose very different hook/callback patterns, so we had to design a common event schema that all four could map onto cleanly. Building three real-time Three.js/Chart.js visualizations that stay in sync over a single WebSocket connection, without the brain graph and topology map fighting over the same event stream, required a dedicated 500-event ring buffer and careful state management.
Accomplishments that we're proud of
- A genuinely zero-config SDK — one decorator or one function call instruments an entire agent graph
- 2,299 events indexed, 342 anomalies detected, and 99.25% confidence anomaly detection from Splunk AI Toolkit on real telemetry, not mocked data
- All four targeted Splunk AI capabilities (MCP Server, AI Toolkit, Foundation-Sec, AI Assistant) working together in one coherent pipeline
- 81 passing tests, including live-propagation tests for the config system
- Three distinct, fully working visualization pages (Live Brain, Agent Ops CRM, Topology Map) all driven by the same real-time data
- A complete, Splunkbase-ready native app package
What we learned
We learned how much value sits in a "pre-filter before you ship telemetry" layer — catching obvious failures in-process means Splunk's AI Toolkit can focus on subtler statistical patterns instead of basic threshold breaches. We also learned that the biggest barrier to agent observability isn't collecting data, it's making that data legible — plain-English explanations from Foundation-Sec turned raw anomaly events into something a non-SPL-fluent developer could actually act on.
What's next for AgentWatch
- Publish the Splunk Cloud app to Splunkbase
- Add support for additional agent frameworks (Semantic Kernel, LlamaIndex agents)
- Expand the Agent Autopsy grading model with more failure categories and historical trend comparisons
- Build a hosted, multi-tenant version of the dashboard so teams can onboard without running their own Splunk instance
- Add automated remediation suggestions that can open PRs or config changes directly from a detected anomaly

Log in or sign up for Devpost to join the conversation.