-
-

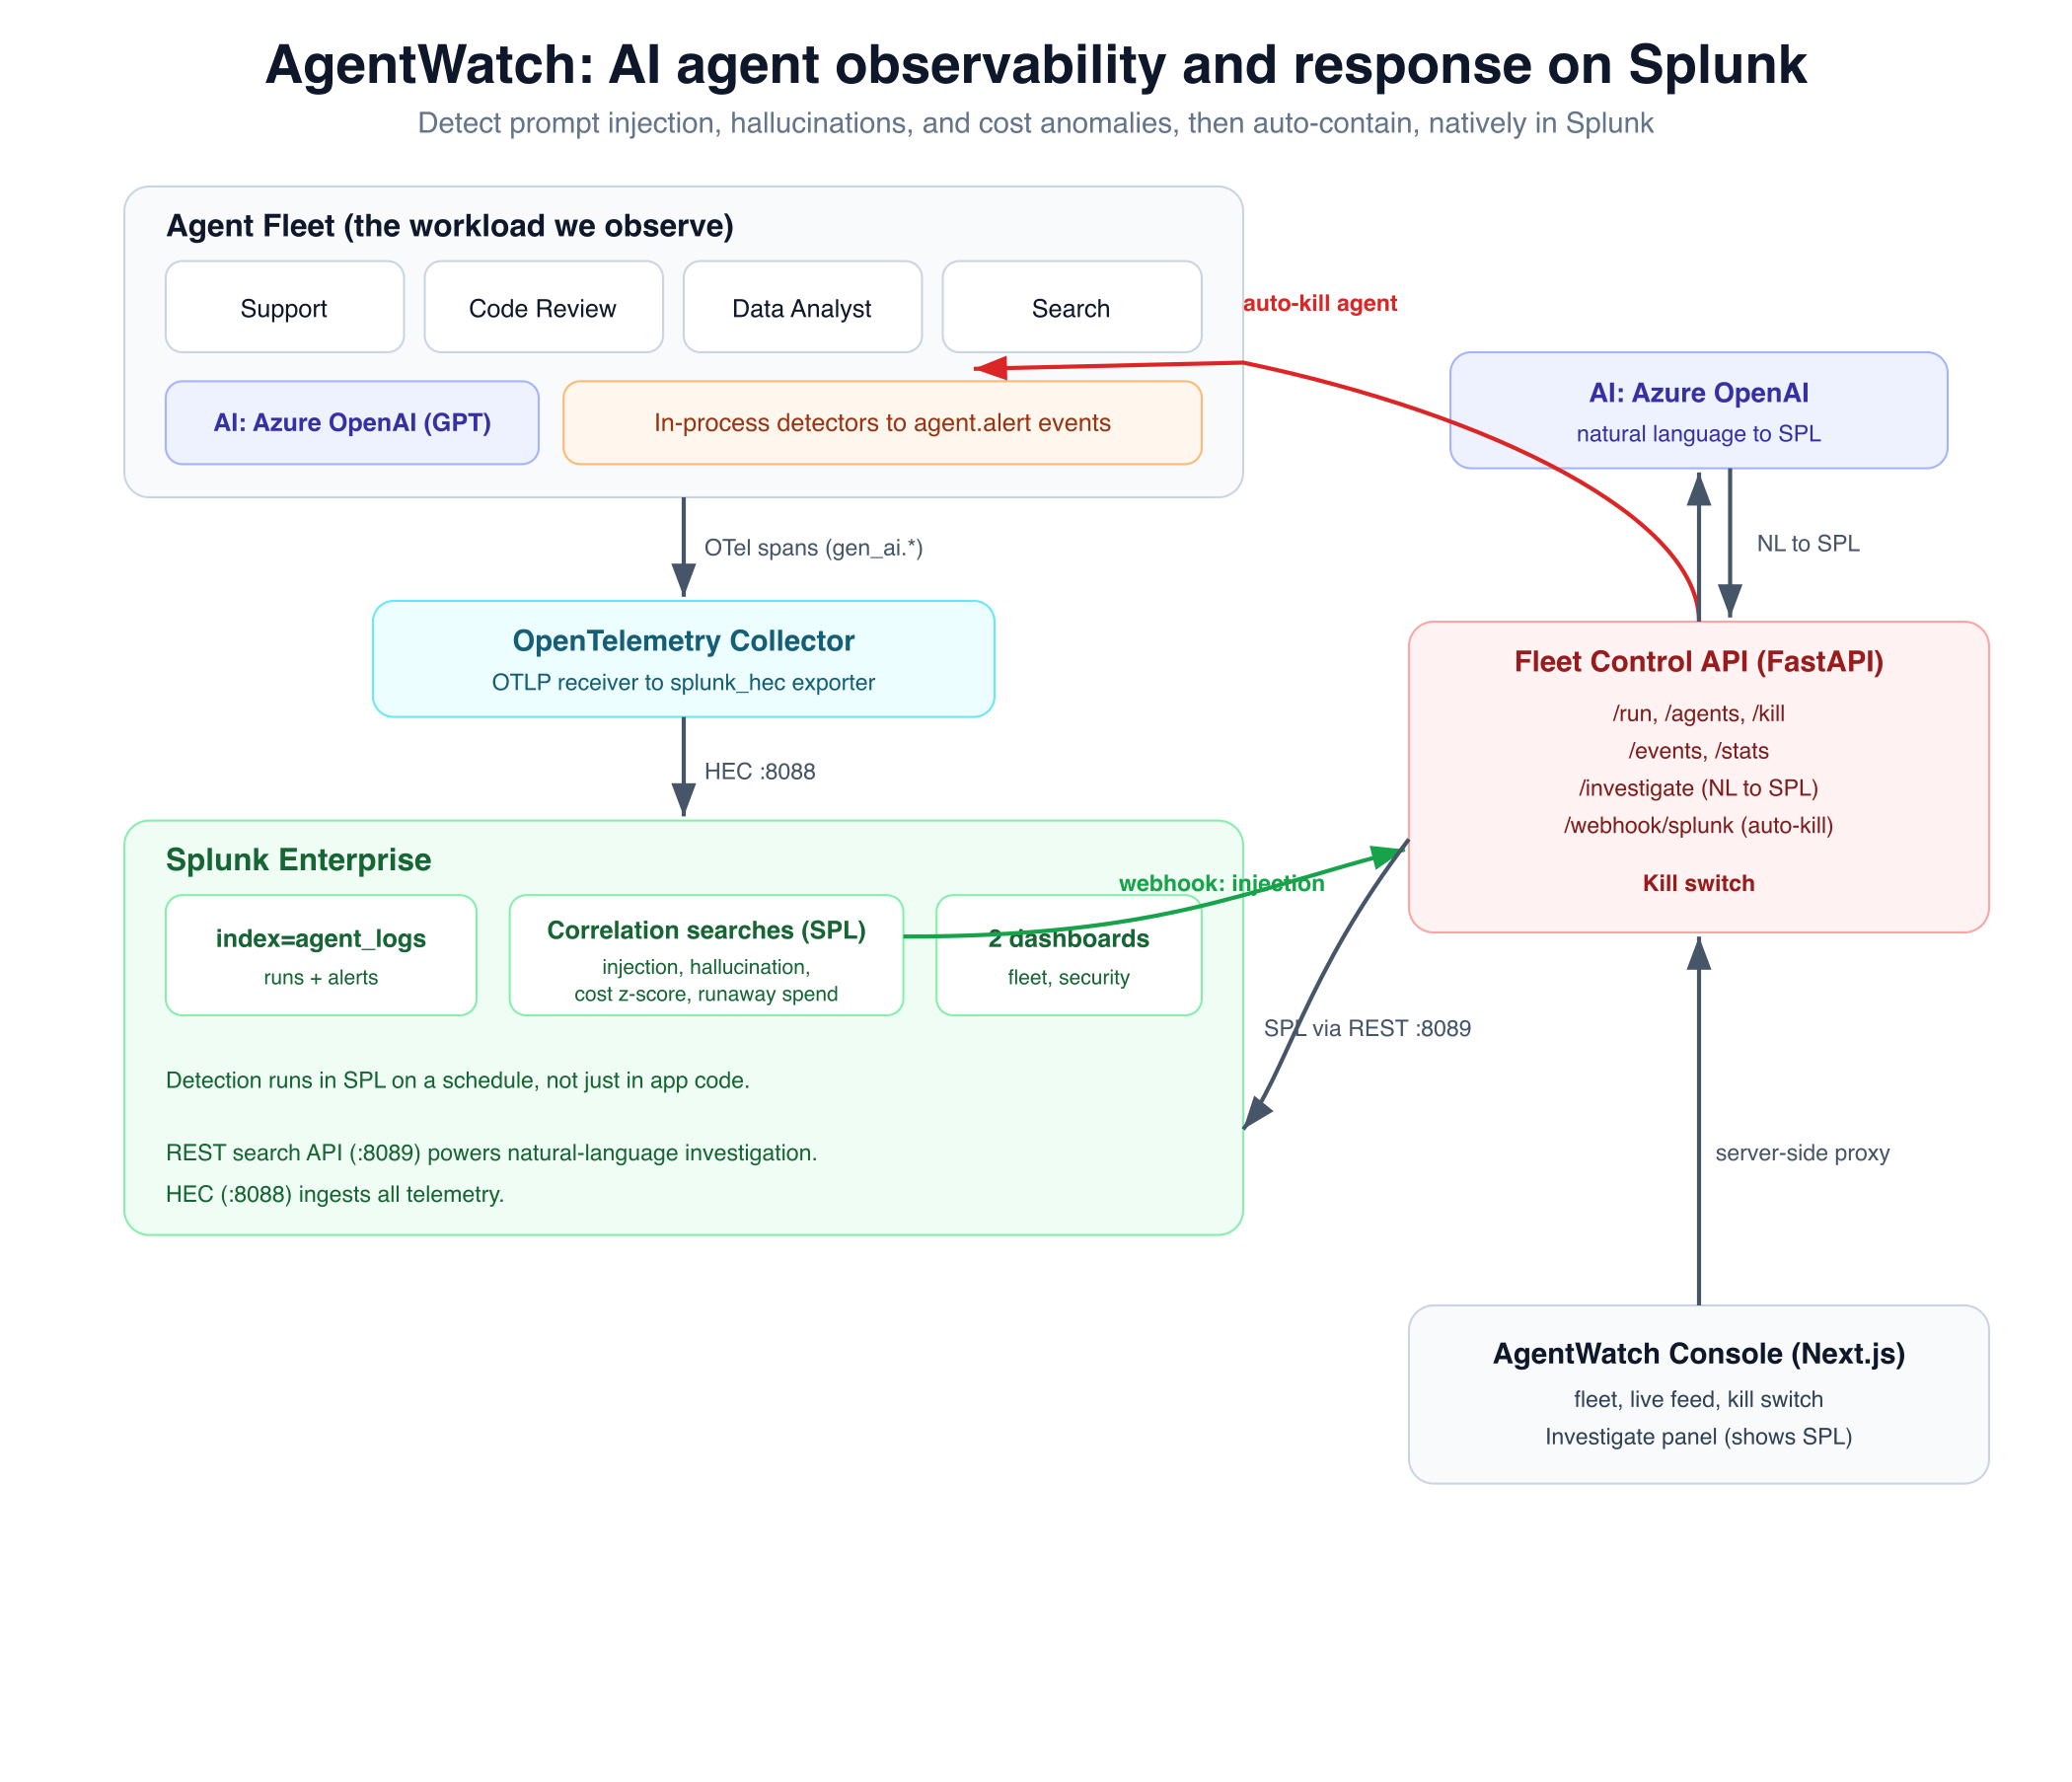
Architecture: agents to OpenTelemetry to Splunk HEC; native correlation-search detection, auto-kill webhook, and natural-language to SPL.
-
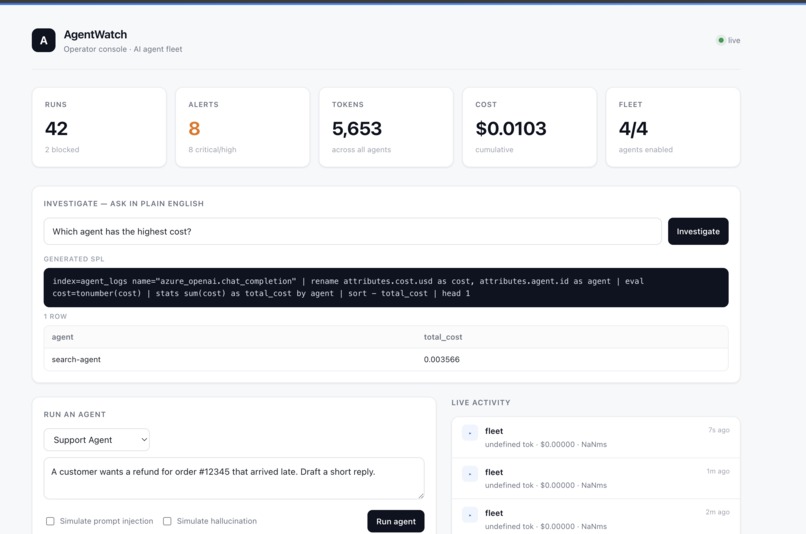
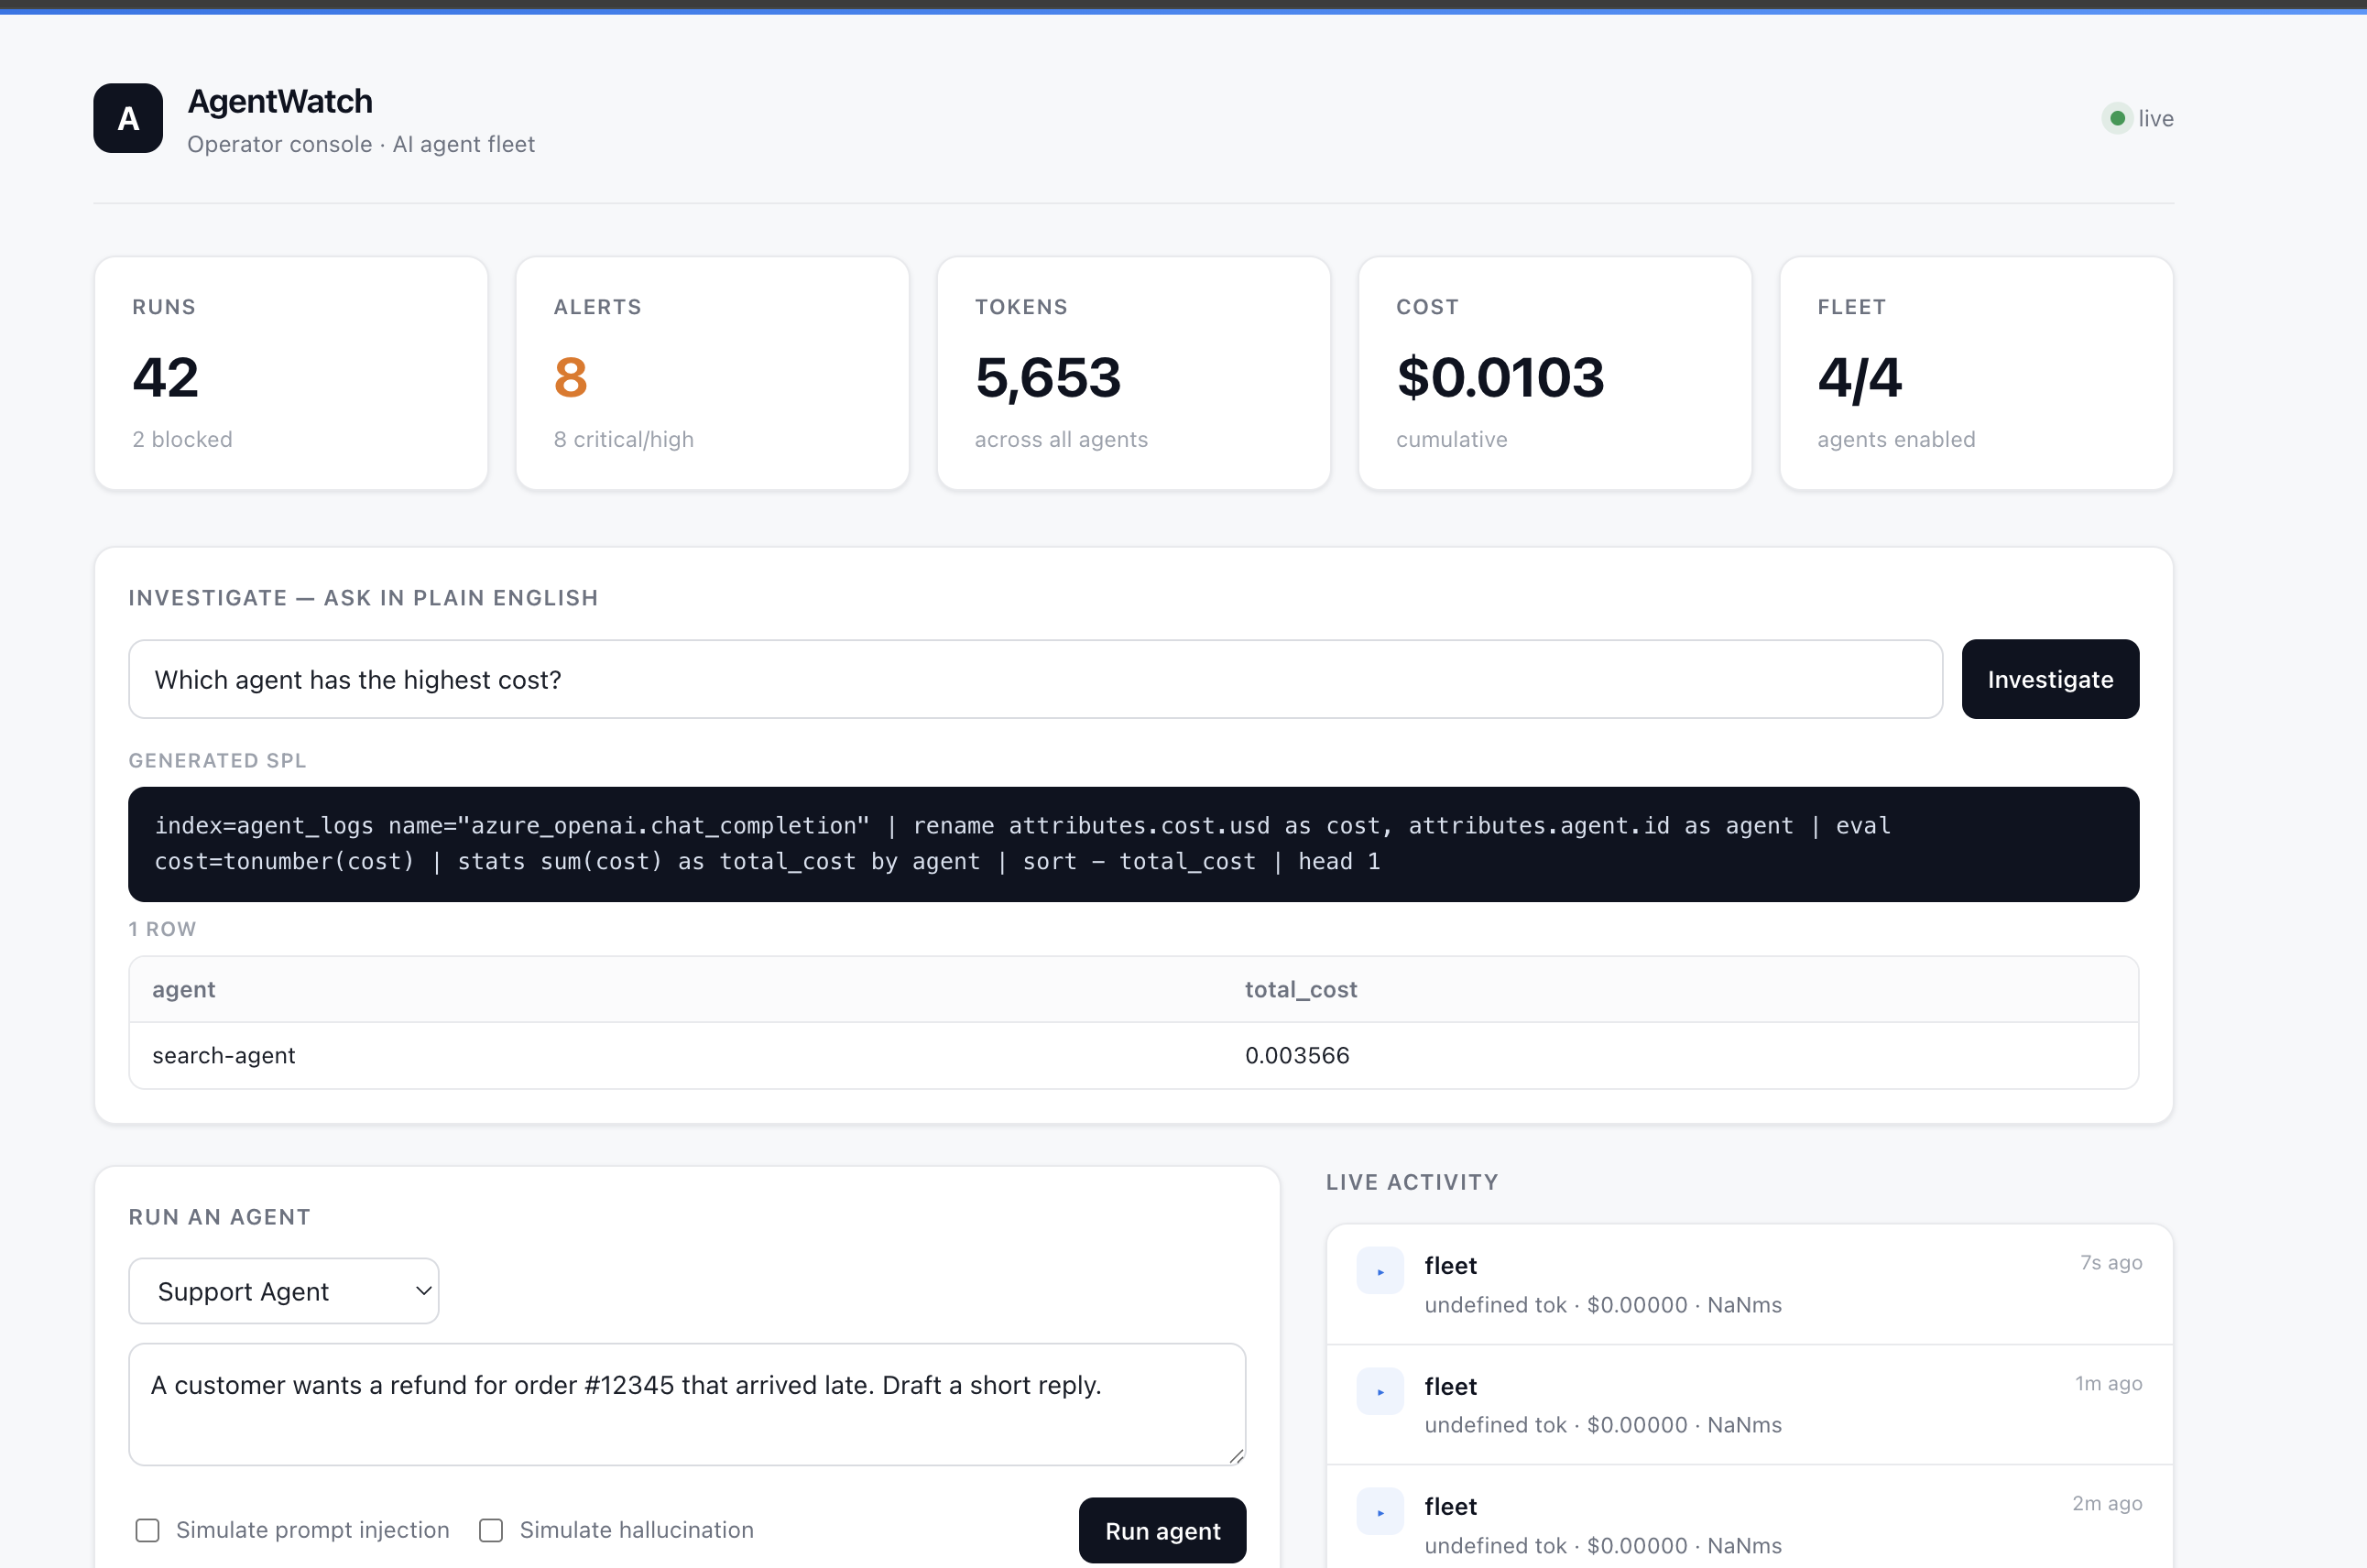
Operator console: live fleet status, KPIs (runs, alerts, tokens, cost), real-time run and alert feed, kill switch, and Investigate panel.
-
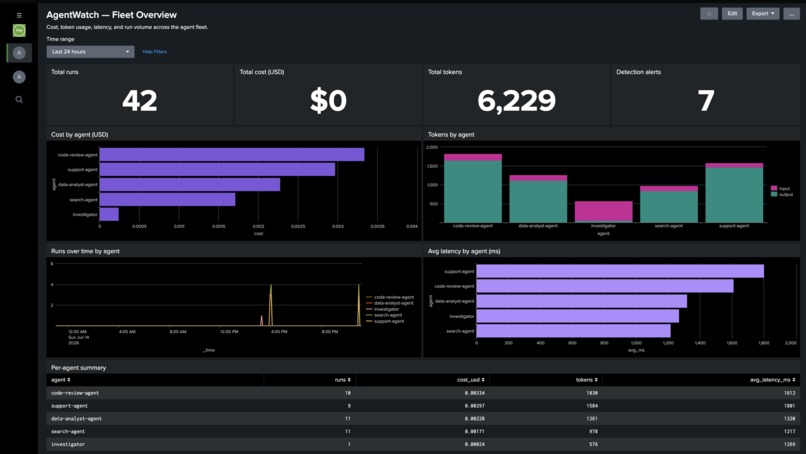
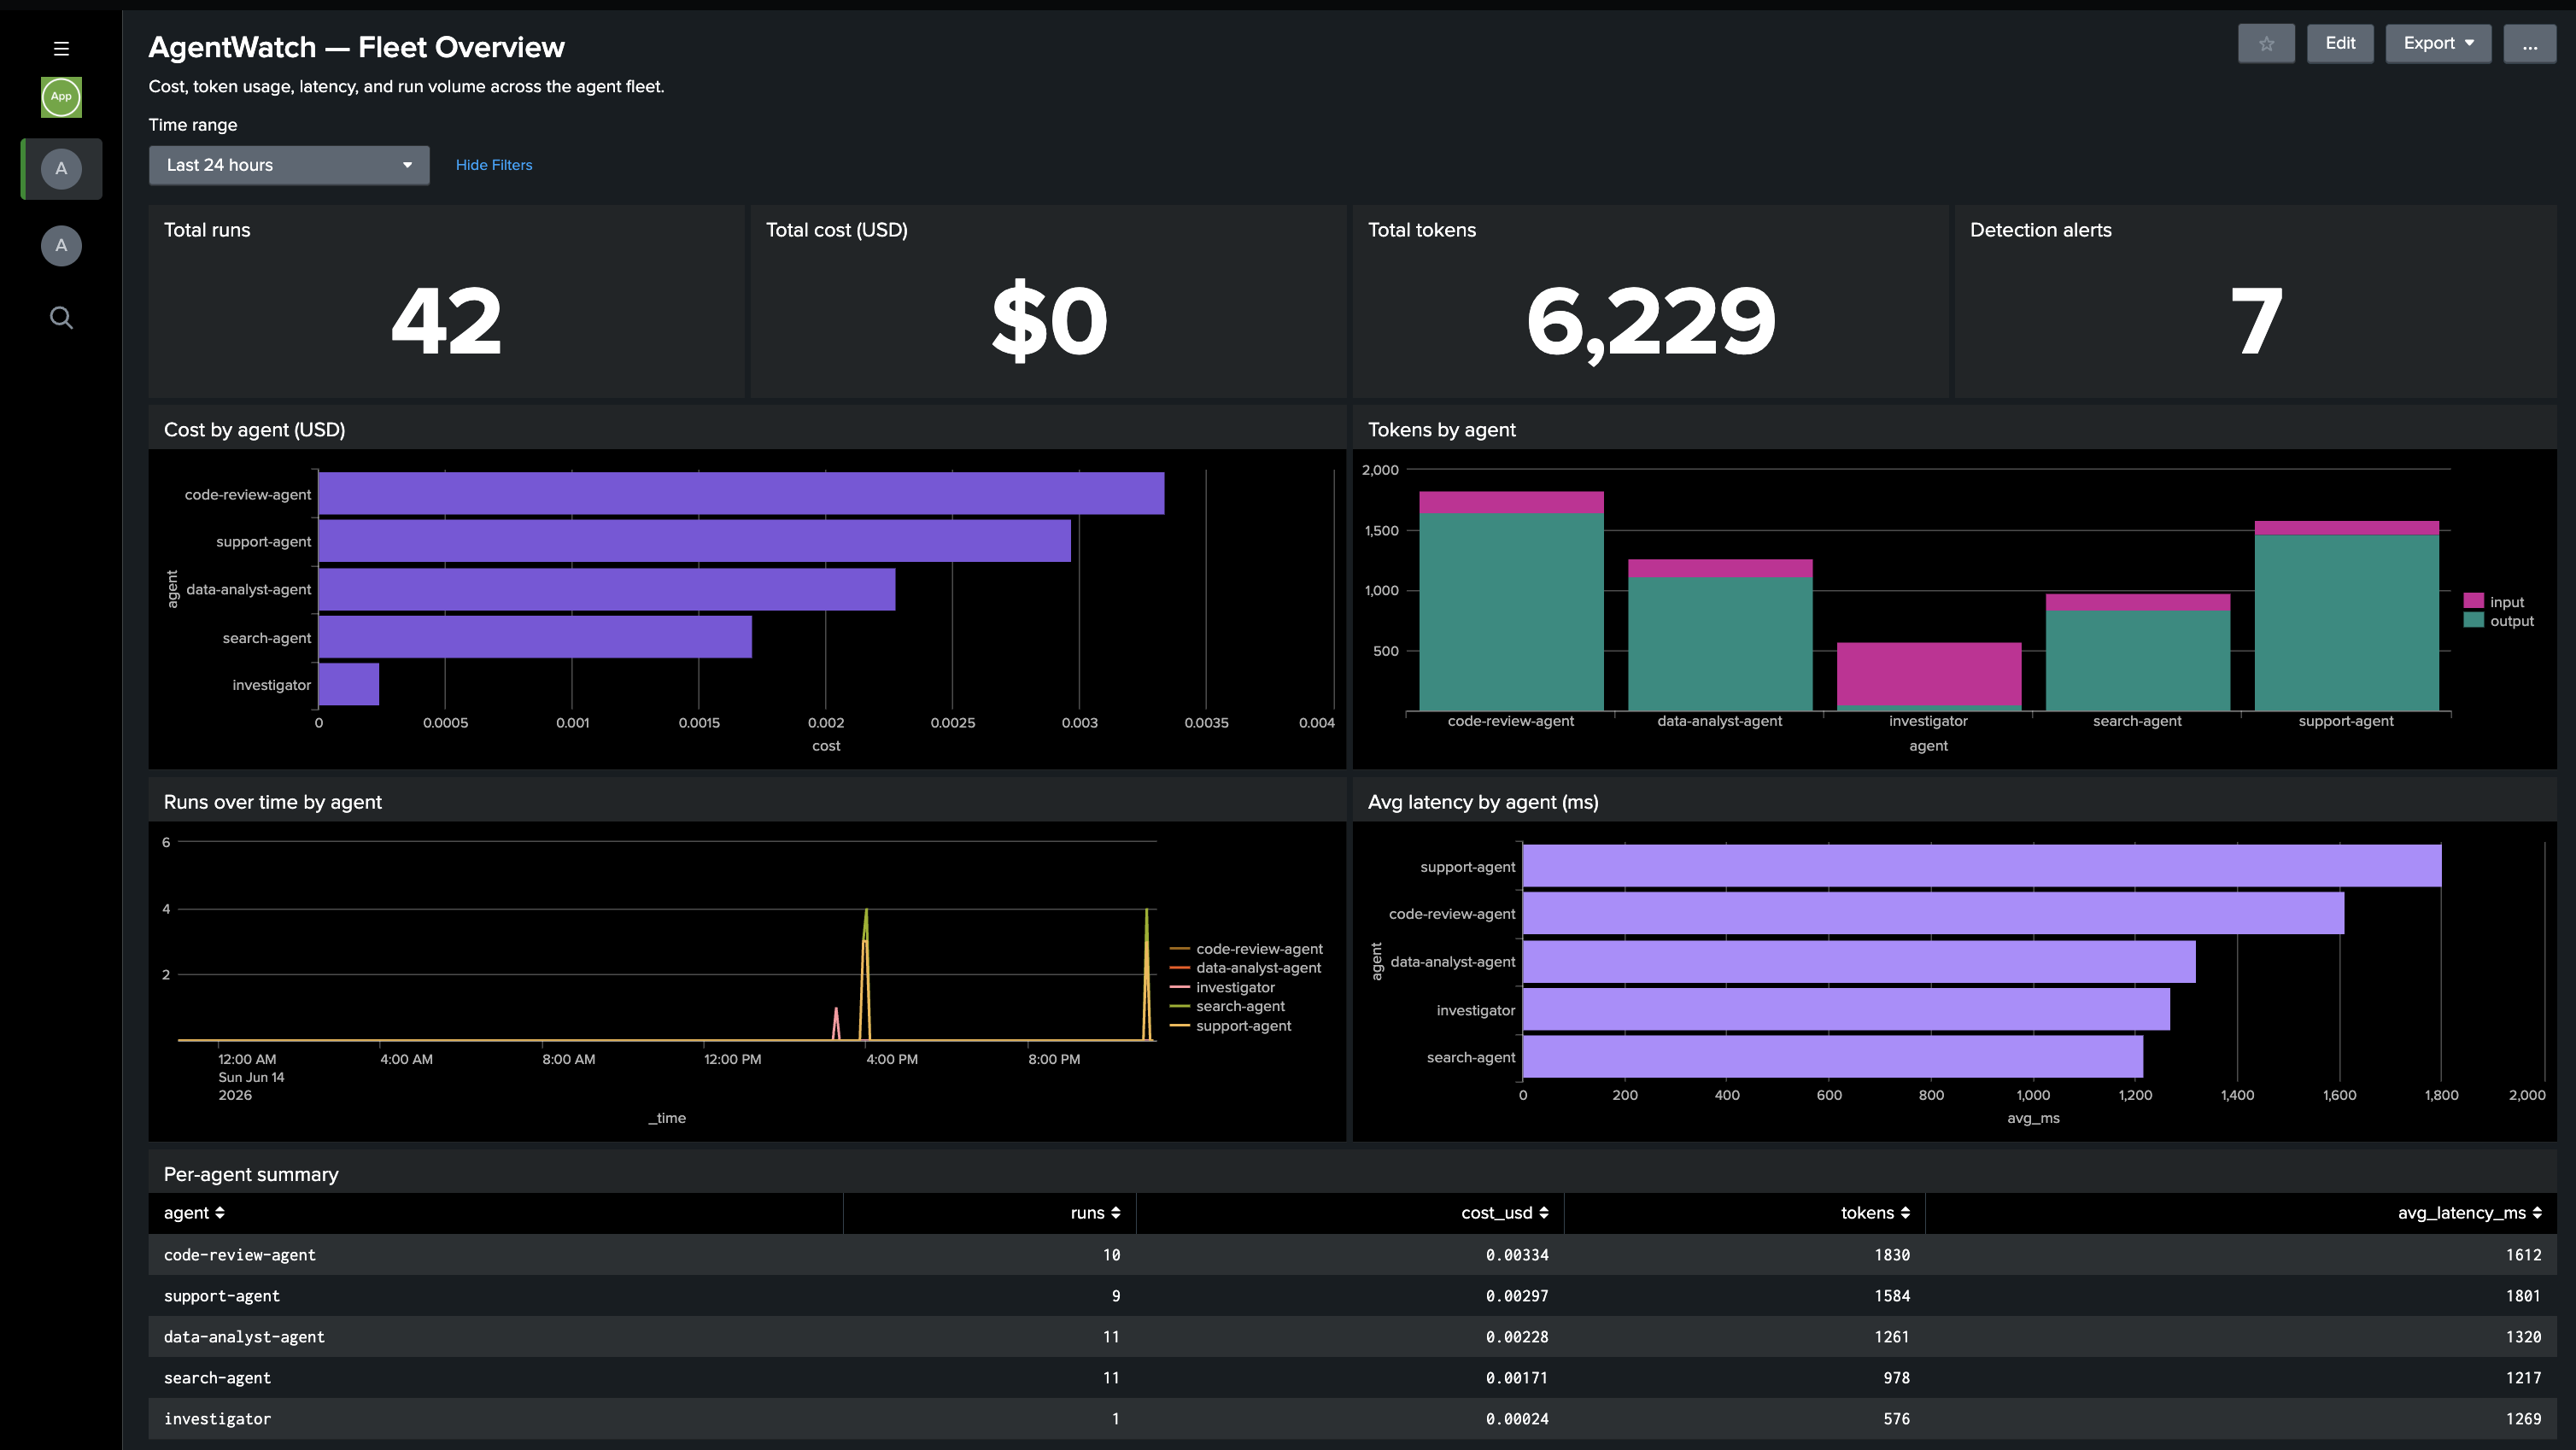
Splunk Fleet Overview: total runs, cost, and tokens, plus per-agent cost, latency, and run volume over time.
-
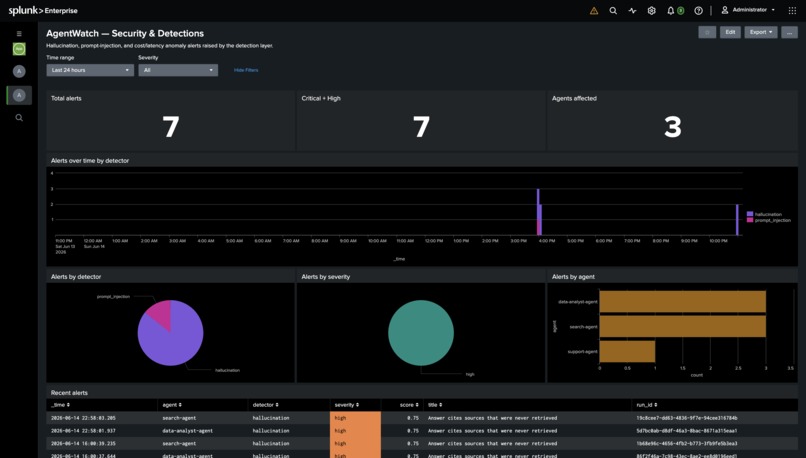
Splunk Security and Detections: alert counts, agents affected, detector and severity breakdowns, and the alert timeline.

Inspiration
Teams are shipping fleets of LLM agents into production with almost no observability or safety net. When an agent gets jailbroken by a prompt injection, hallucinates a citation, or silently burns through budget, nobody finds out until a customer (or the monthly bill) does. Traditional APM was never built for non-deterministic, token-metered, prompt-driven workloads. We wanted Splunk to be the detection and response brain for an agent fleet, not just a place logs go to die.
What it does
AgentWatch is the "Datadog for AI agents," built on Splunk. It observes a live fleet of four AI agents and gives operators five capabilities:
- See everything. Every agent run (tokens, cost, latency, model, output) is streamed into Splunk in real time via OpenTelemetry.
- Detect natively in Splunk. Scheduled correlation searches flag prompt injection, hallucinations, and cost anomalies (a 3-sigma z-score search) directly in SPL.
- Contain automatically. When the prompt-injection correlation search fires, a webhook hits the fleet kill switch and quarantines the agent with zero human input.
- Investigate in plain English. Ask a question in the console; AI generates the SPL, runs it against Splunk, and returns the answer backed by the exact query that produced it.
- Operate. A Next.js console is the single pane of glass: fleet status, a live run and alert feed, and one-click kill or re-enable.
Code: https://github.com/Kulraj69/agentwatch
How we built it
Four agents run on Azure OpenAI, instrumented with the OpenTelemetry Python SDK using gen_ai.* semantic conventions. Spans flow through the Splunk Distribution of the OpenTelemetry Collector into Splunk via HEC (index=agent_logs).
Detection happens in two complementary layers: in-process heuristic detectors that emit structured agent.alert events, and native Splunk correlation searches that re-detect in SPL on a schedule and drive alerting and response. The prompt-injection search uses a webhook alert action that calls a FastAPI endpoint (/webhook/splunk), which engages the kill switch.
Natural-language investigation is a /investigate endpoint: Azure OpenAI turns a question into SPL, which the fleet executes via the Splunk REST API and returns rows plus the exact SPL. A Next.js console proxies the control API server-side (so the control secret never reaches the browser) and links to two Splunk dashboards. Everything runs as four Docker containers on AWS EC2, exposed over HTTPS via a Cloudflare tunnel with HTTP basic auth.
Challenges we ran into
- SPL field-handling gotchas. Single-quoted dotted field names (for example
by 'attributes.agent.id') return empty groupings, and insideevalthe.is the string-concat operator, so dotted fields silently become null. This quietly broke our correlation searches and every dashboard panel. We solved it with a consistent "rename-first" pattern in both the saved searches and the LLM's SPL-generation prompt. - Closing the detect to contain loop. Getting a Splunk correlation-search webhook to reliably drive the kill switch over the Docker network, with the right alert payload.
- Provider migration. Moving the fleet to Azure OpenAI's new endpoint, which requires
max_completion_tokens, and untangling dependency conflicts. - Durable public access. Keeping a stable, authenticated public demo link alive via a Cloudflare tunnel running as a systemd service.
Accomplishments that we're proud of
- A fully autonomous detect-and-contain loop that lives in Splunk. A correlation search detects a jailbreak and quarantines the agent on its own, verified end to end.
- Natural-language investigation where every answer is backed by the exact SPL that produced it. Auditable, not a black box.
- A complete, polished product: real-time console, live feed, kill switch, and two working Splunk dashboards, deployed and publicly accessible.
What we learned
- For an agentic-ops platform, the win is making Splunk the brain (detection in SPL, response via alert actions, AI-assisted investigation) rather than a passive log sink.
- LLM-generated SPL is only reliable with a tightly constrained, schema-aware prompt plus a few-shot, rename-first pattern. Small SPL syntax quirks break results silently.
- OpenTelemetry's
gen_ai.*semantic conventions map cleanly onto agent telemetry (tokens, cost, latency), making Splunk a natural home for AI observability.
What's next for AgentWatch: Observability for AI Agents
- Auto-generated postmortems on every kill, summarizing what happened and why.
- Native
agent_metricsas real Splunk metric points formstatstime-series. - A stable named tunnel or custom domain for permanent public access.
- Deeper multi-step, tool-using agent orchestration and per-tool tracing.
- Integration with the official Splunk MCP Server for an even richer natural-language investigation experience.
Repository: https://github.com/Kulraj69/agentwatch
Built With
- aws-ec2
- azure-openai
- cloudflare
- docker
- docker-compose
- fastapi
- javascript
- next.js
- opentelemetry
- python
- react
- splunk

Log in or sign up for Devpost to join the conversation.