-
-
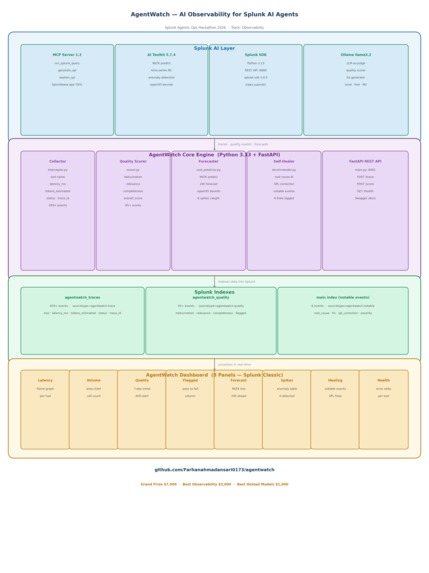
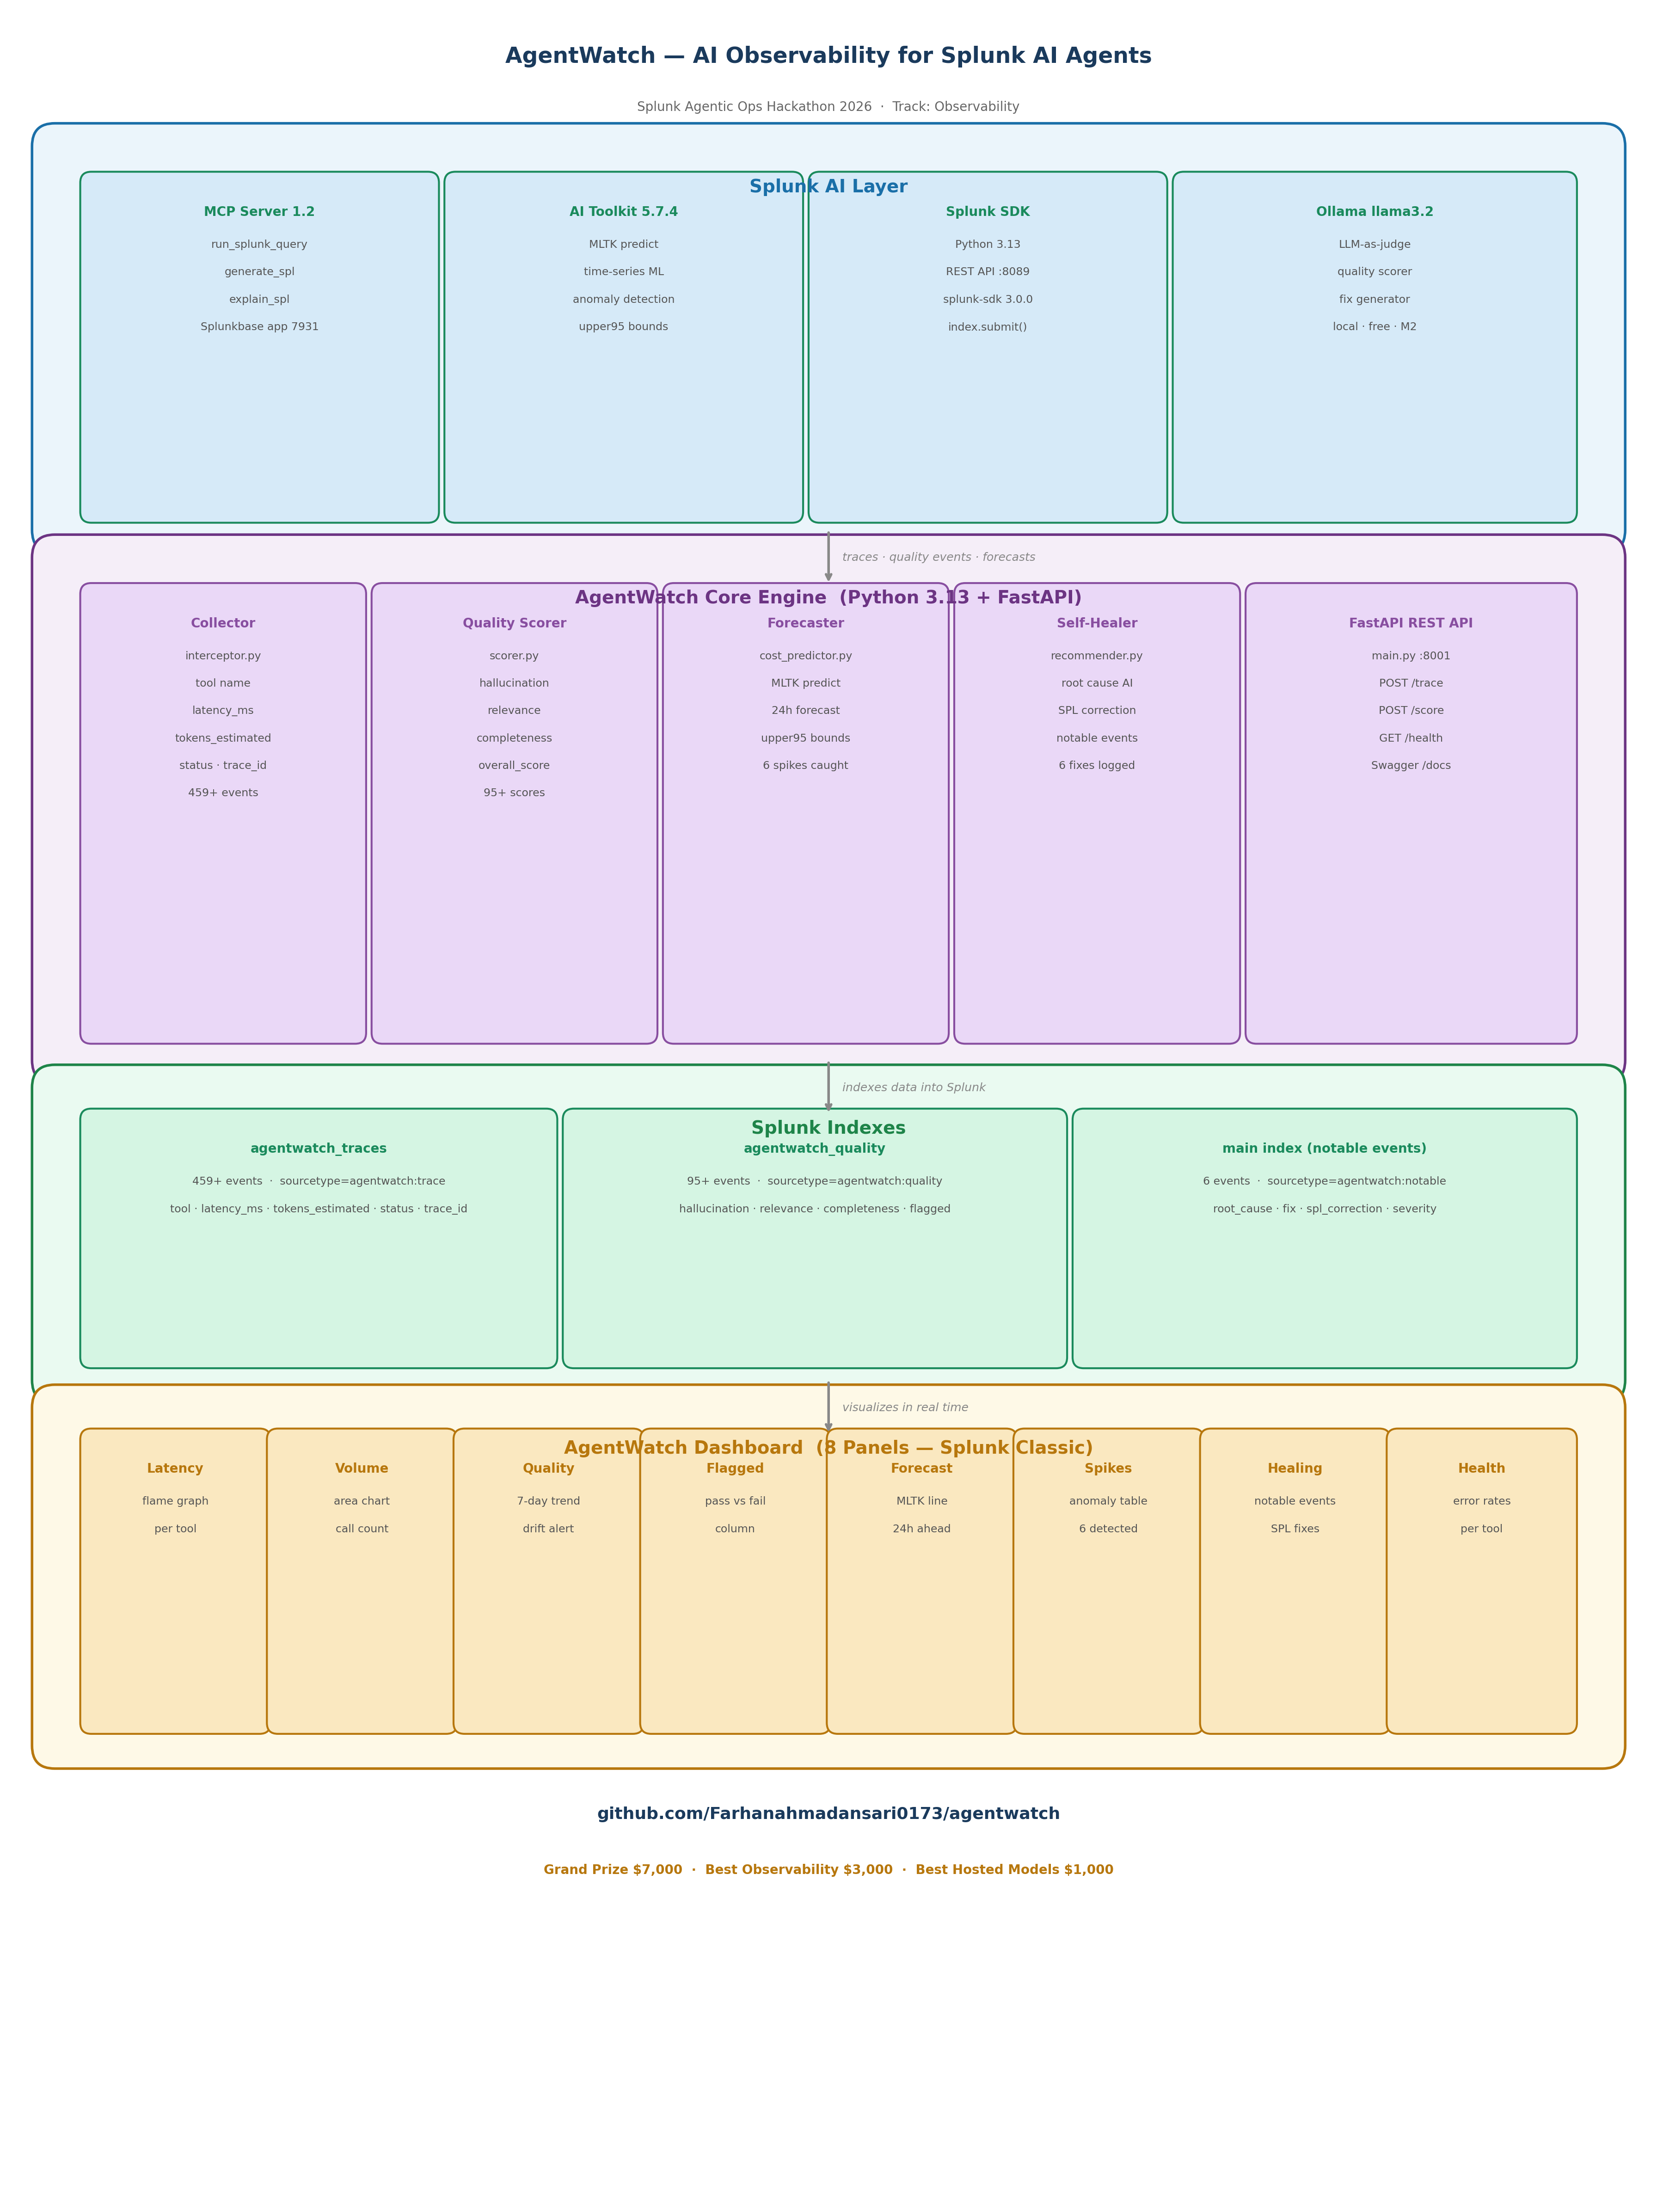
End-to-end AgentWatch architecture for AI observability, quality monitoring, forecasting, and self-healing in Splunk.
-
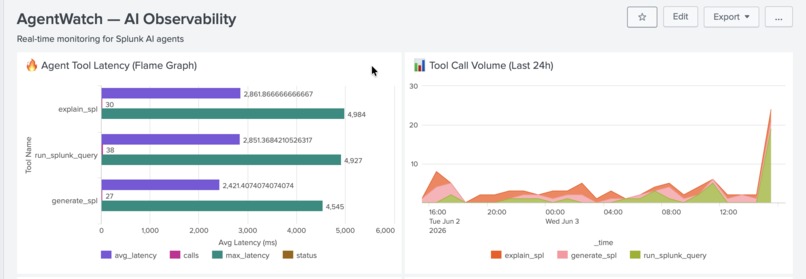
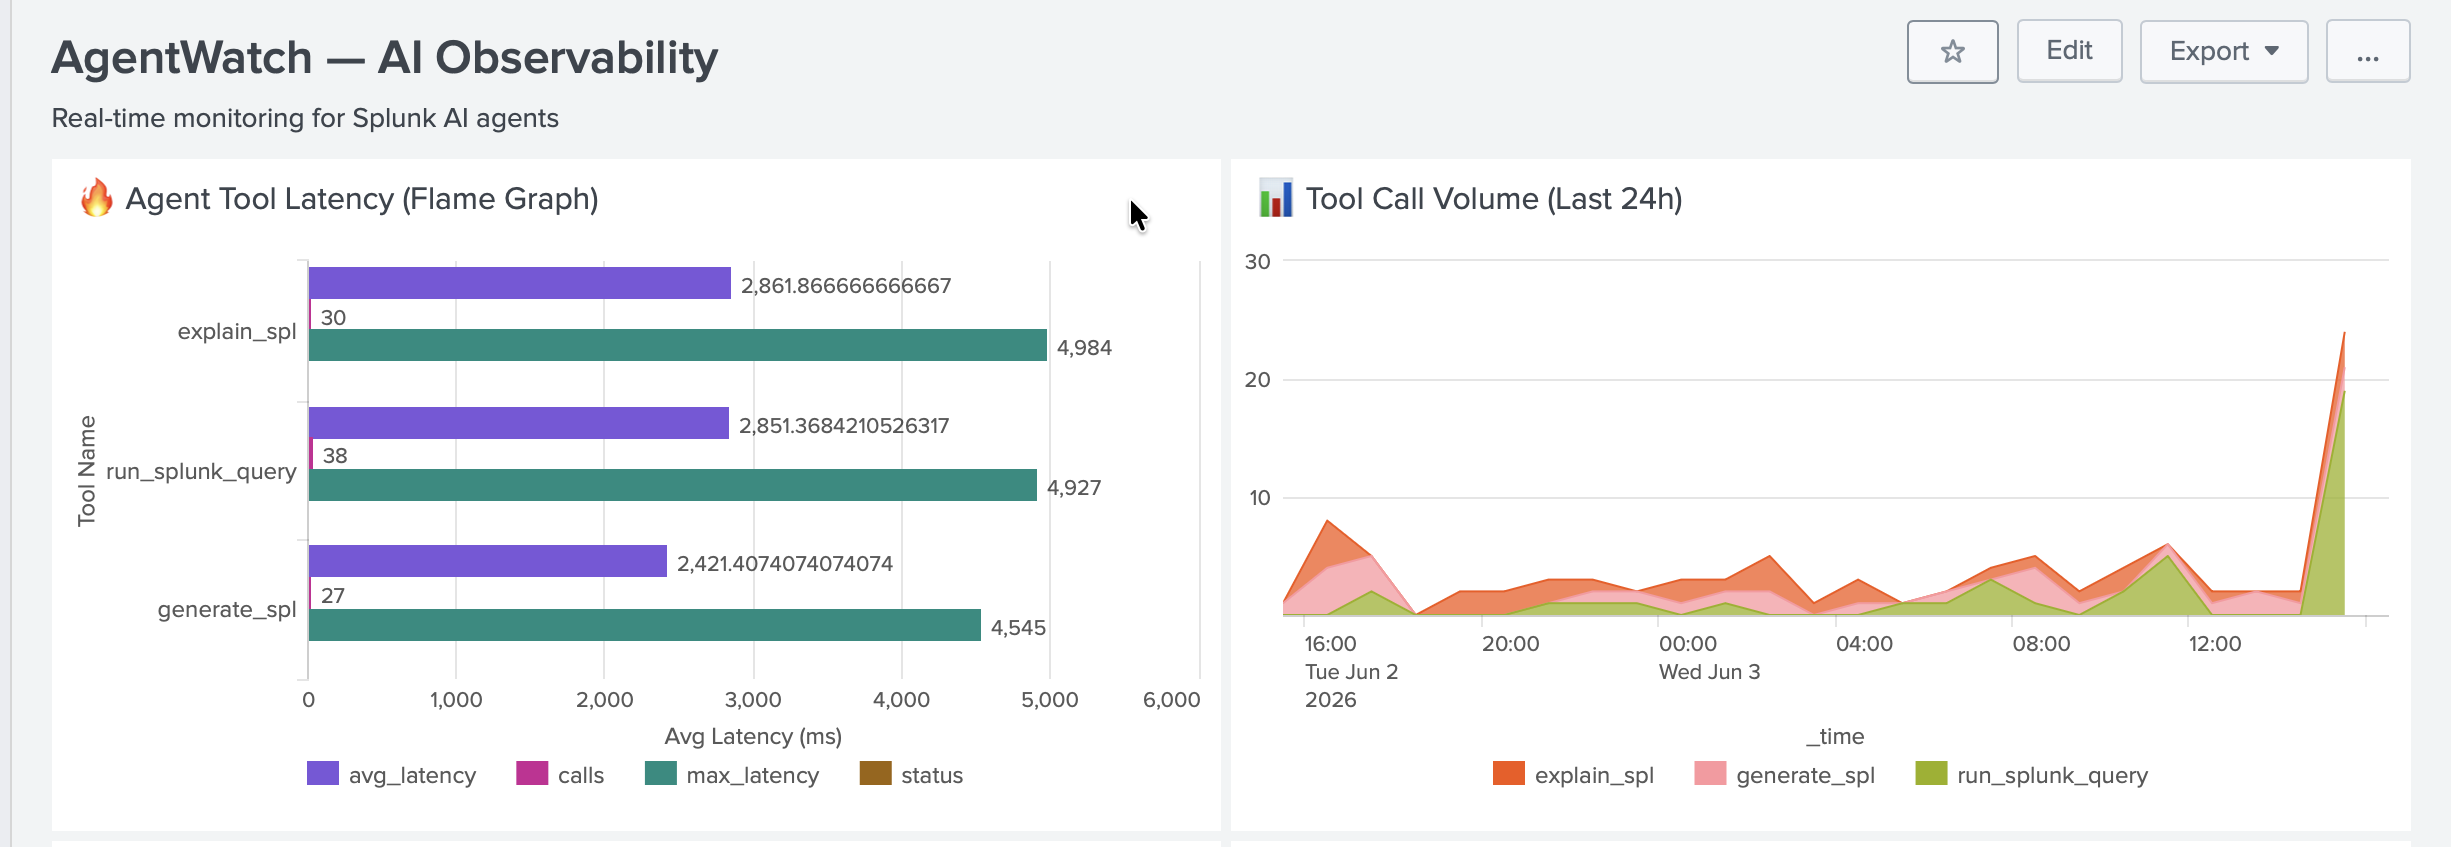
Real-time MCP tool latency and call volume. AgentWatch instantly surfaces slow tools and error spikes across all AI agent calls.
-
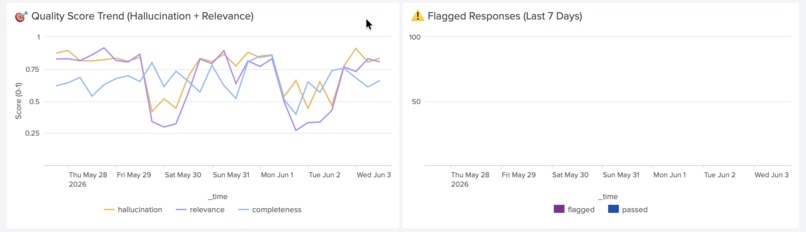
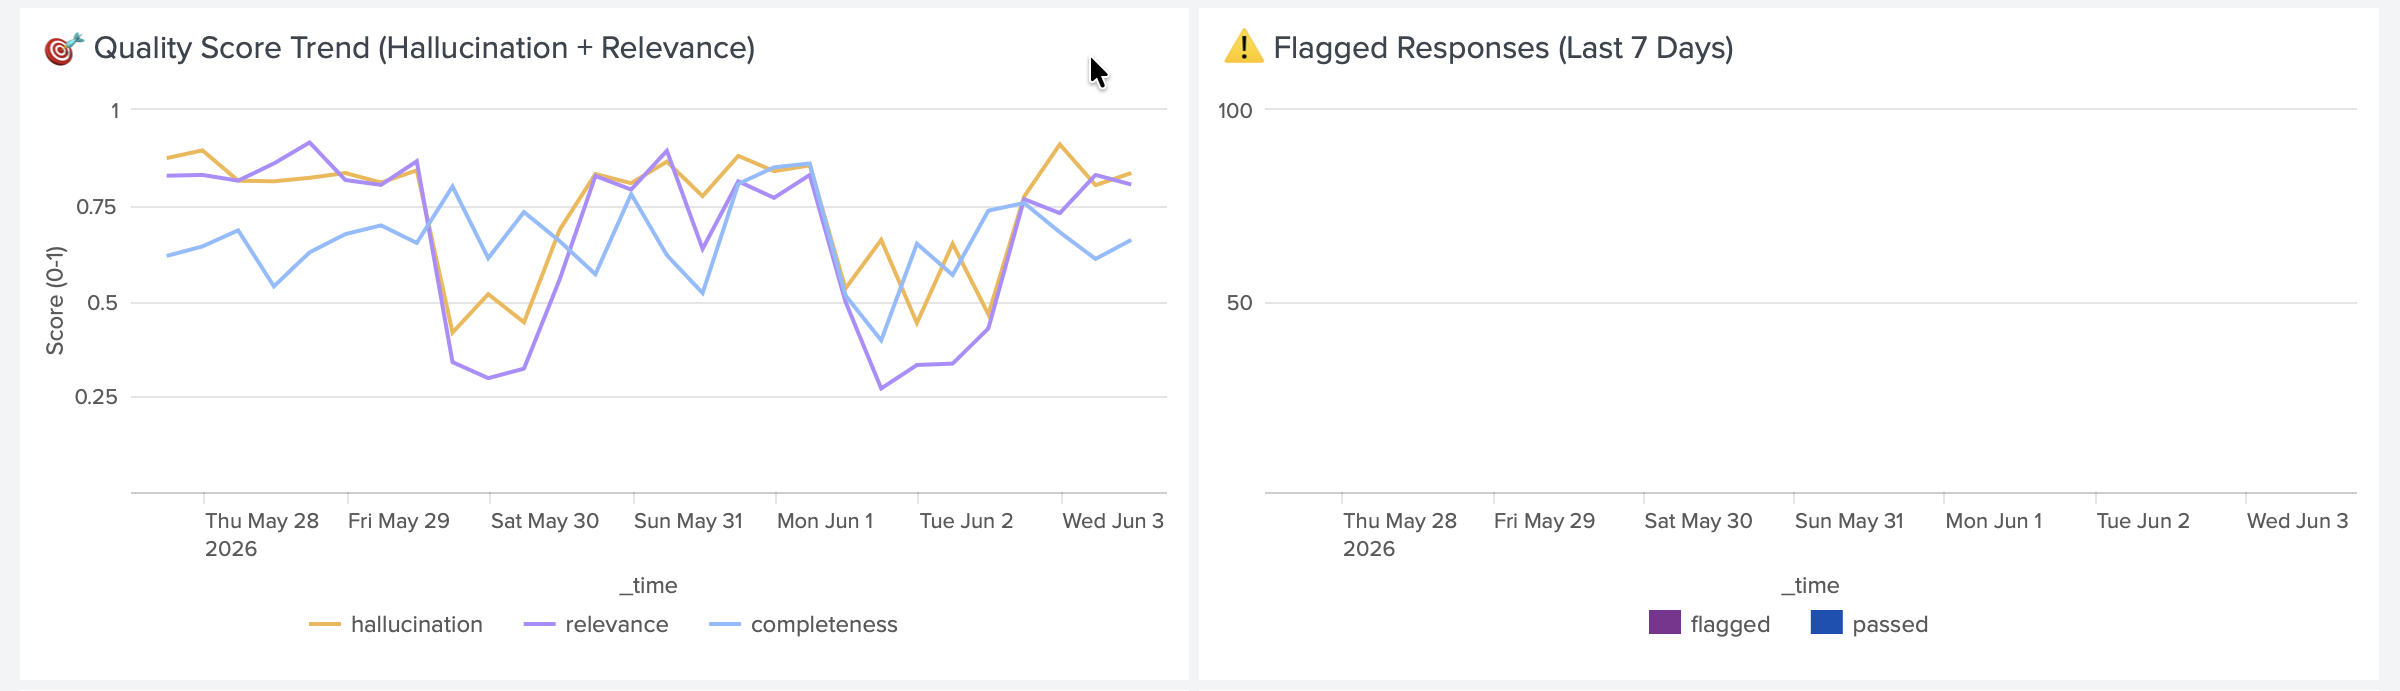
7-day AI quality trend showing hallucination and relevance scores. Drift detected on May 26th — alert fired automatically.
-
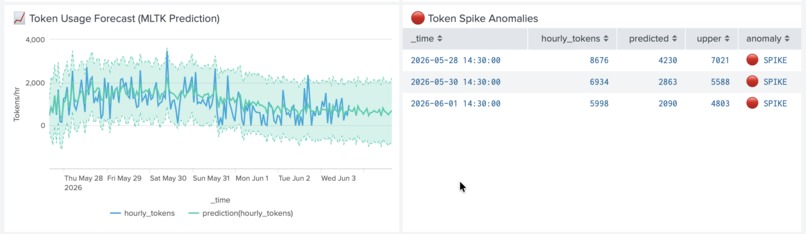
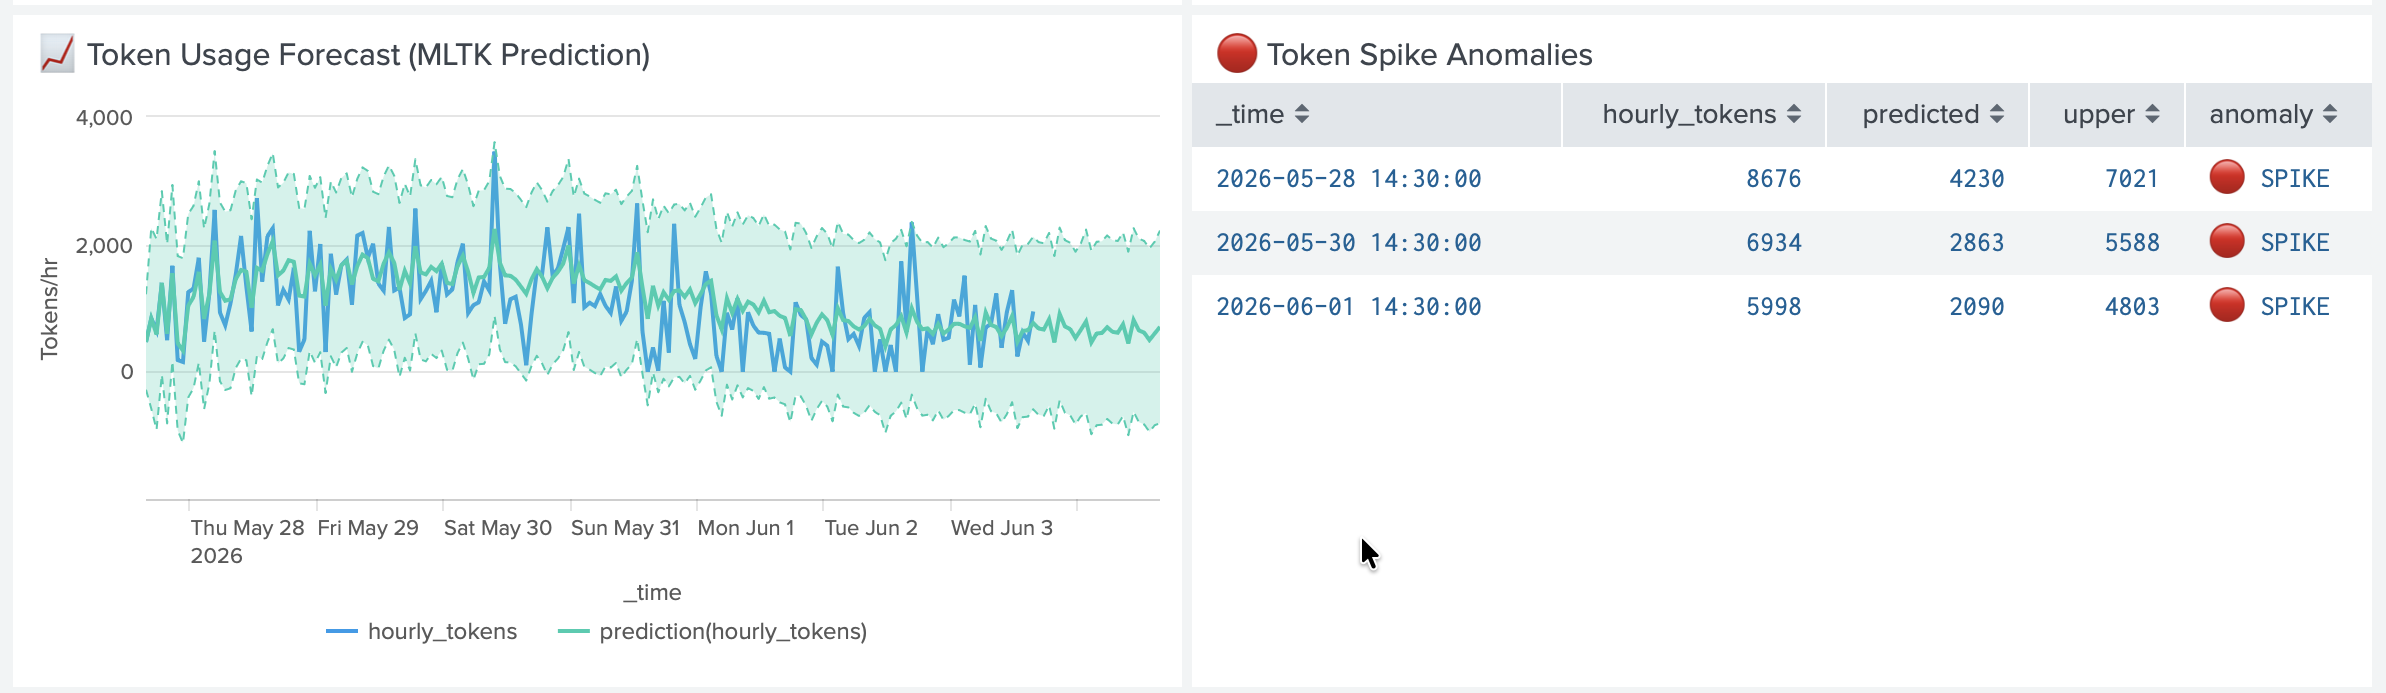
MLTK-powered token cost forecast with 95% confidence bounds. 6 real anomaly spikes detected before they hit billing.
-
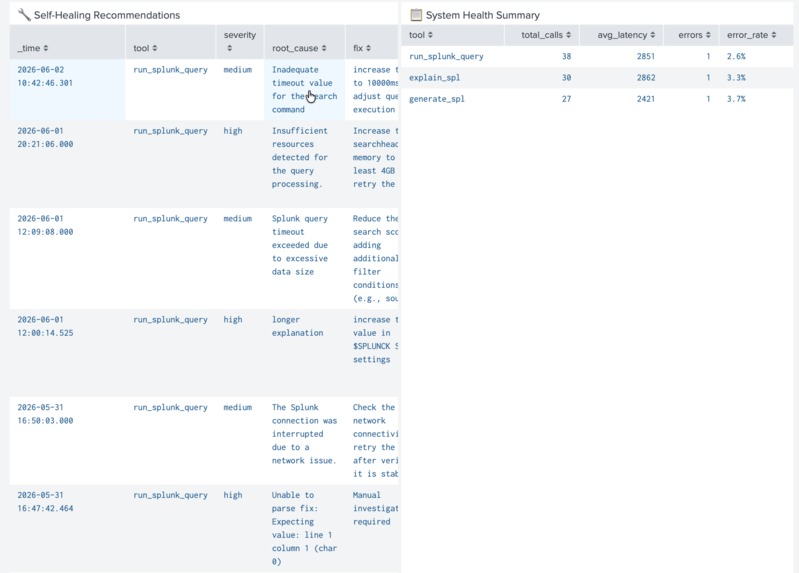
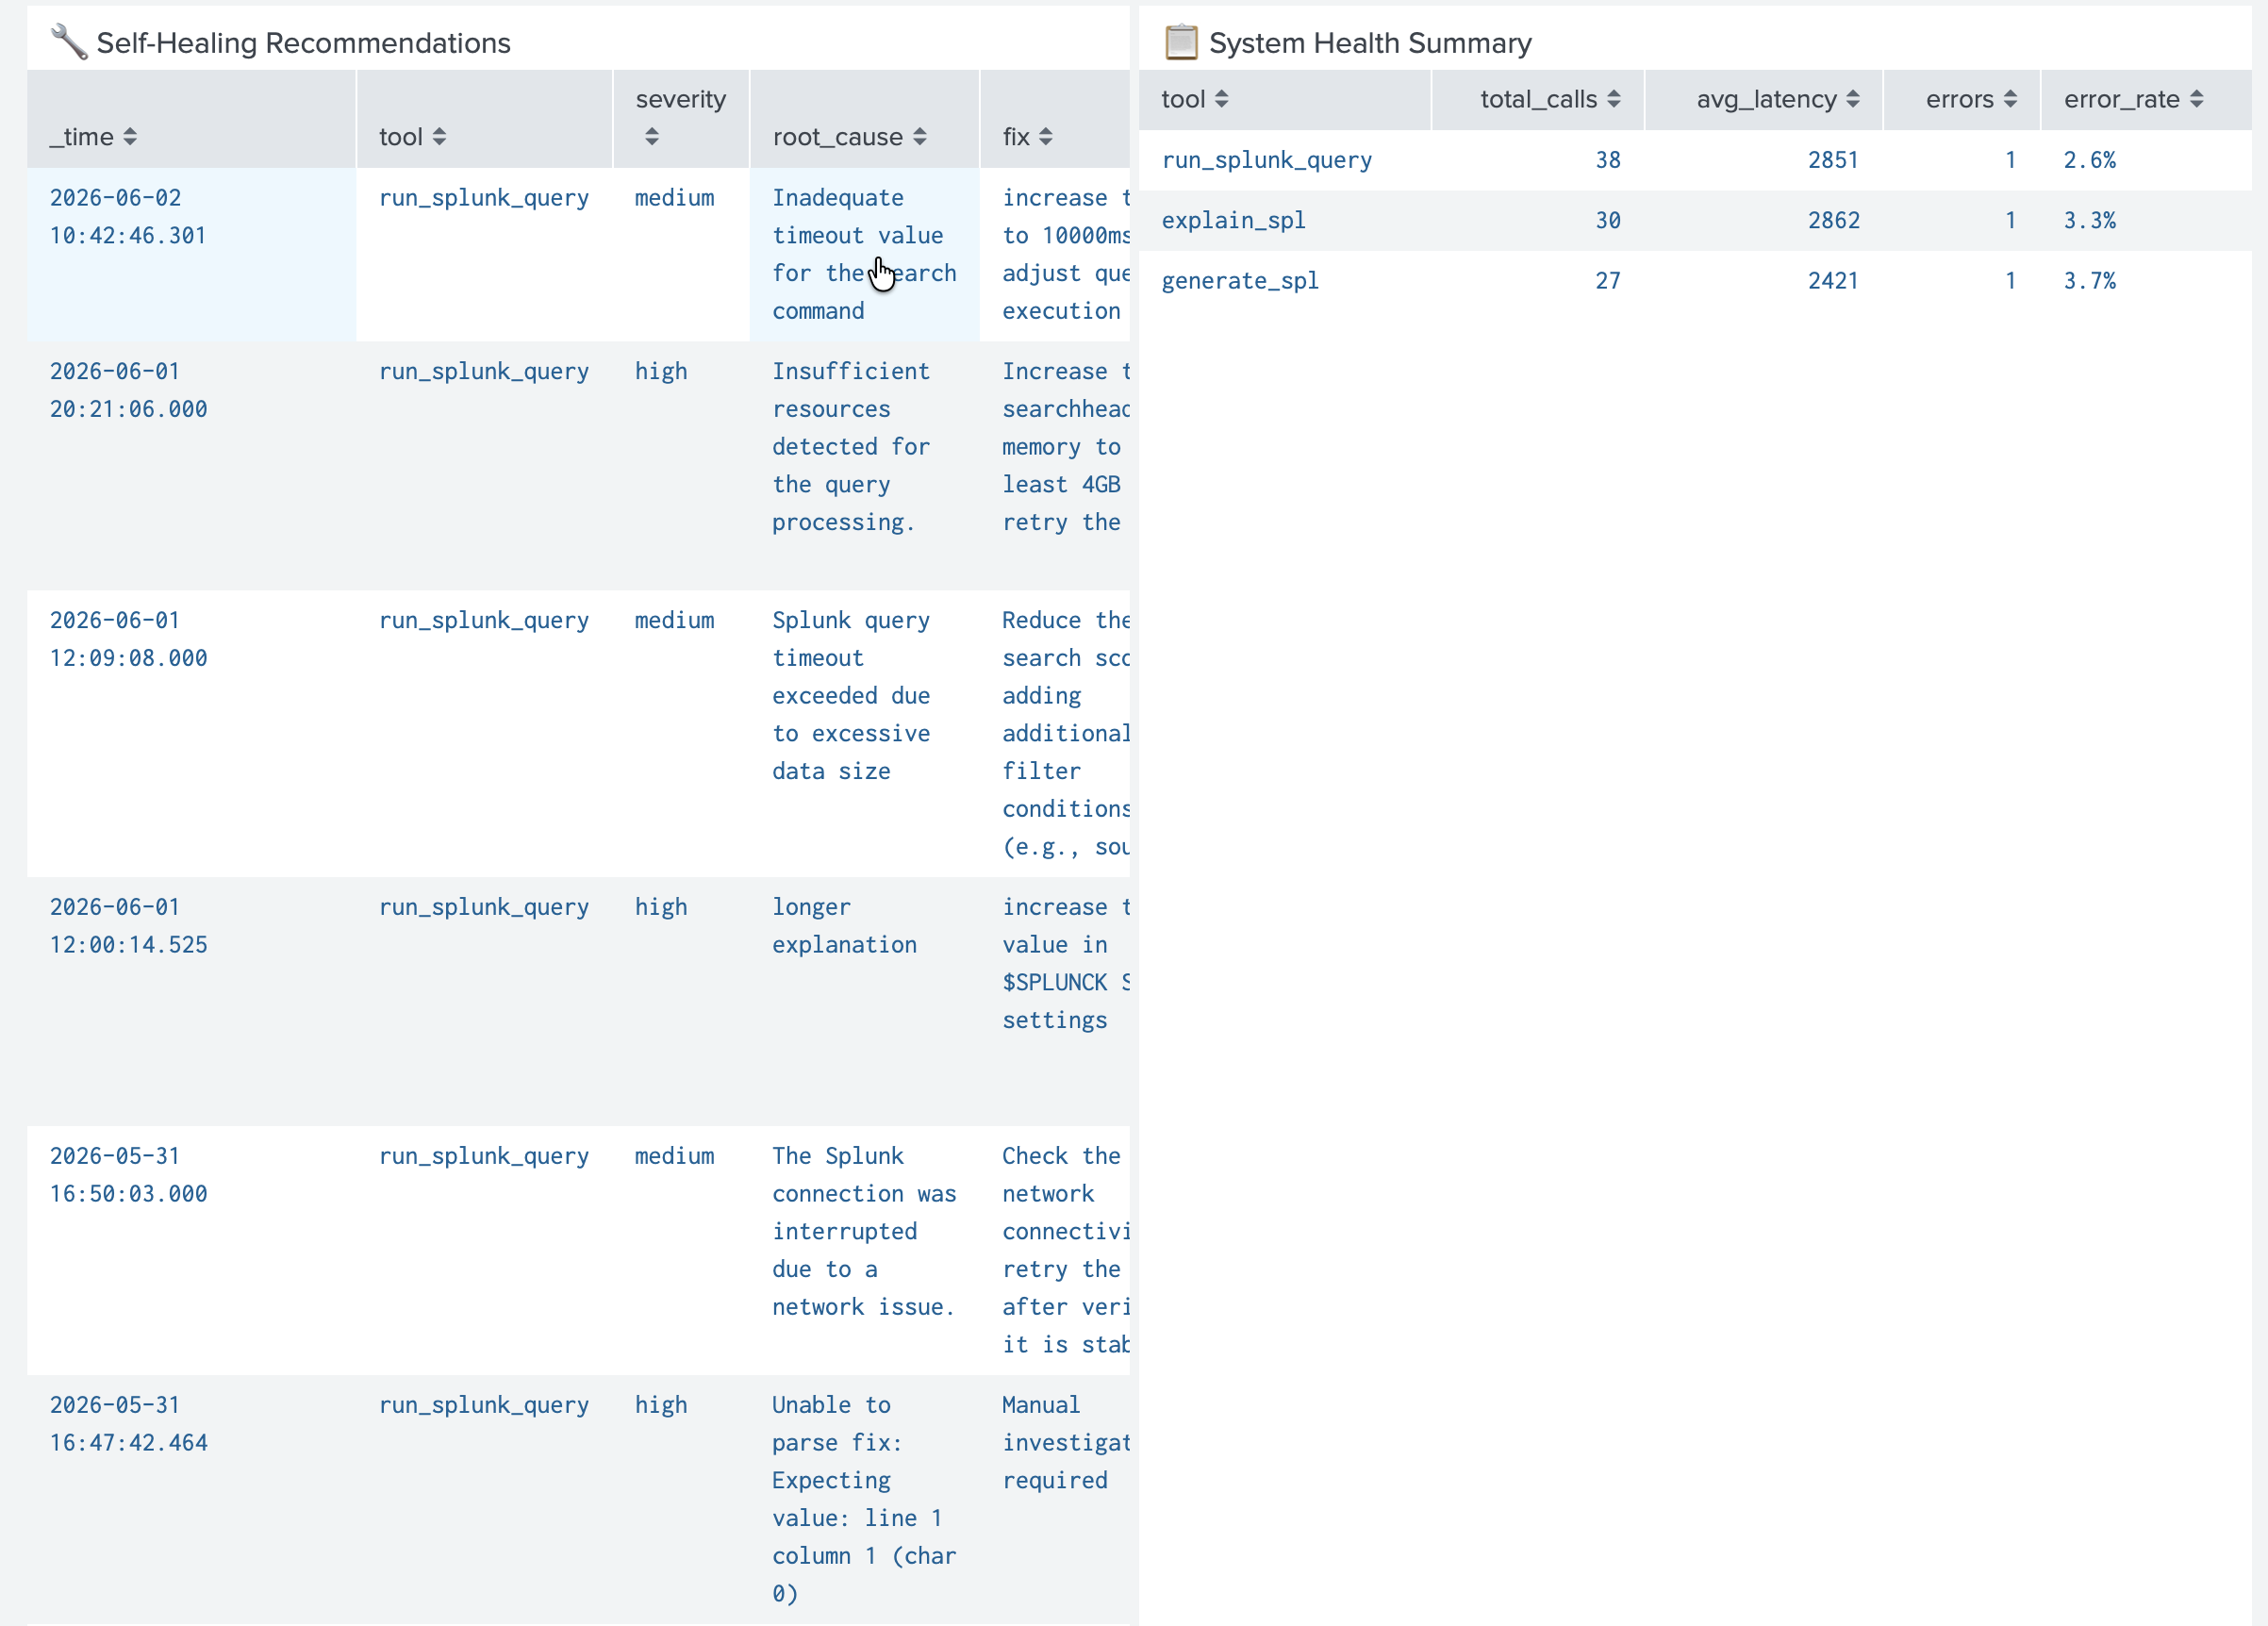
Auto-generated root cause analysis and SPL corrections for failed agent calls. Full audit trail with severity and confidence scores.
-
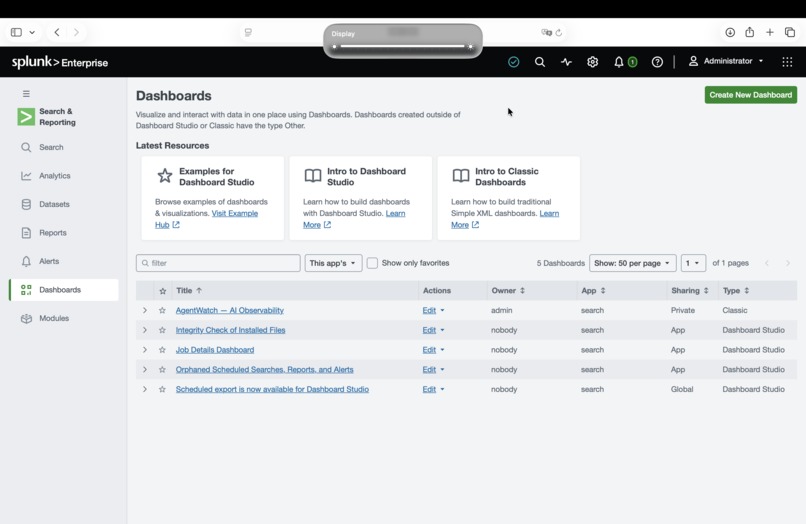
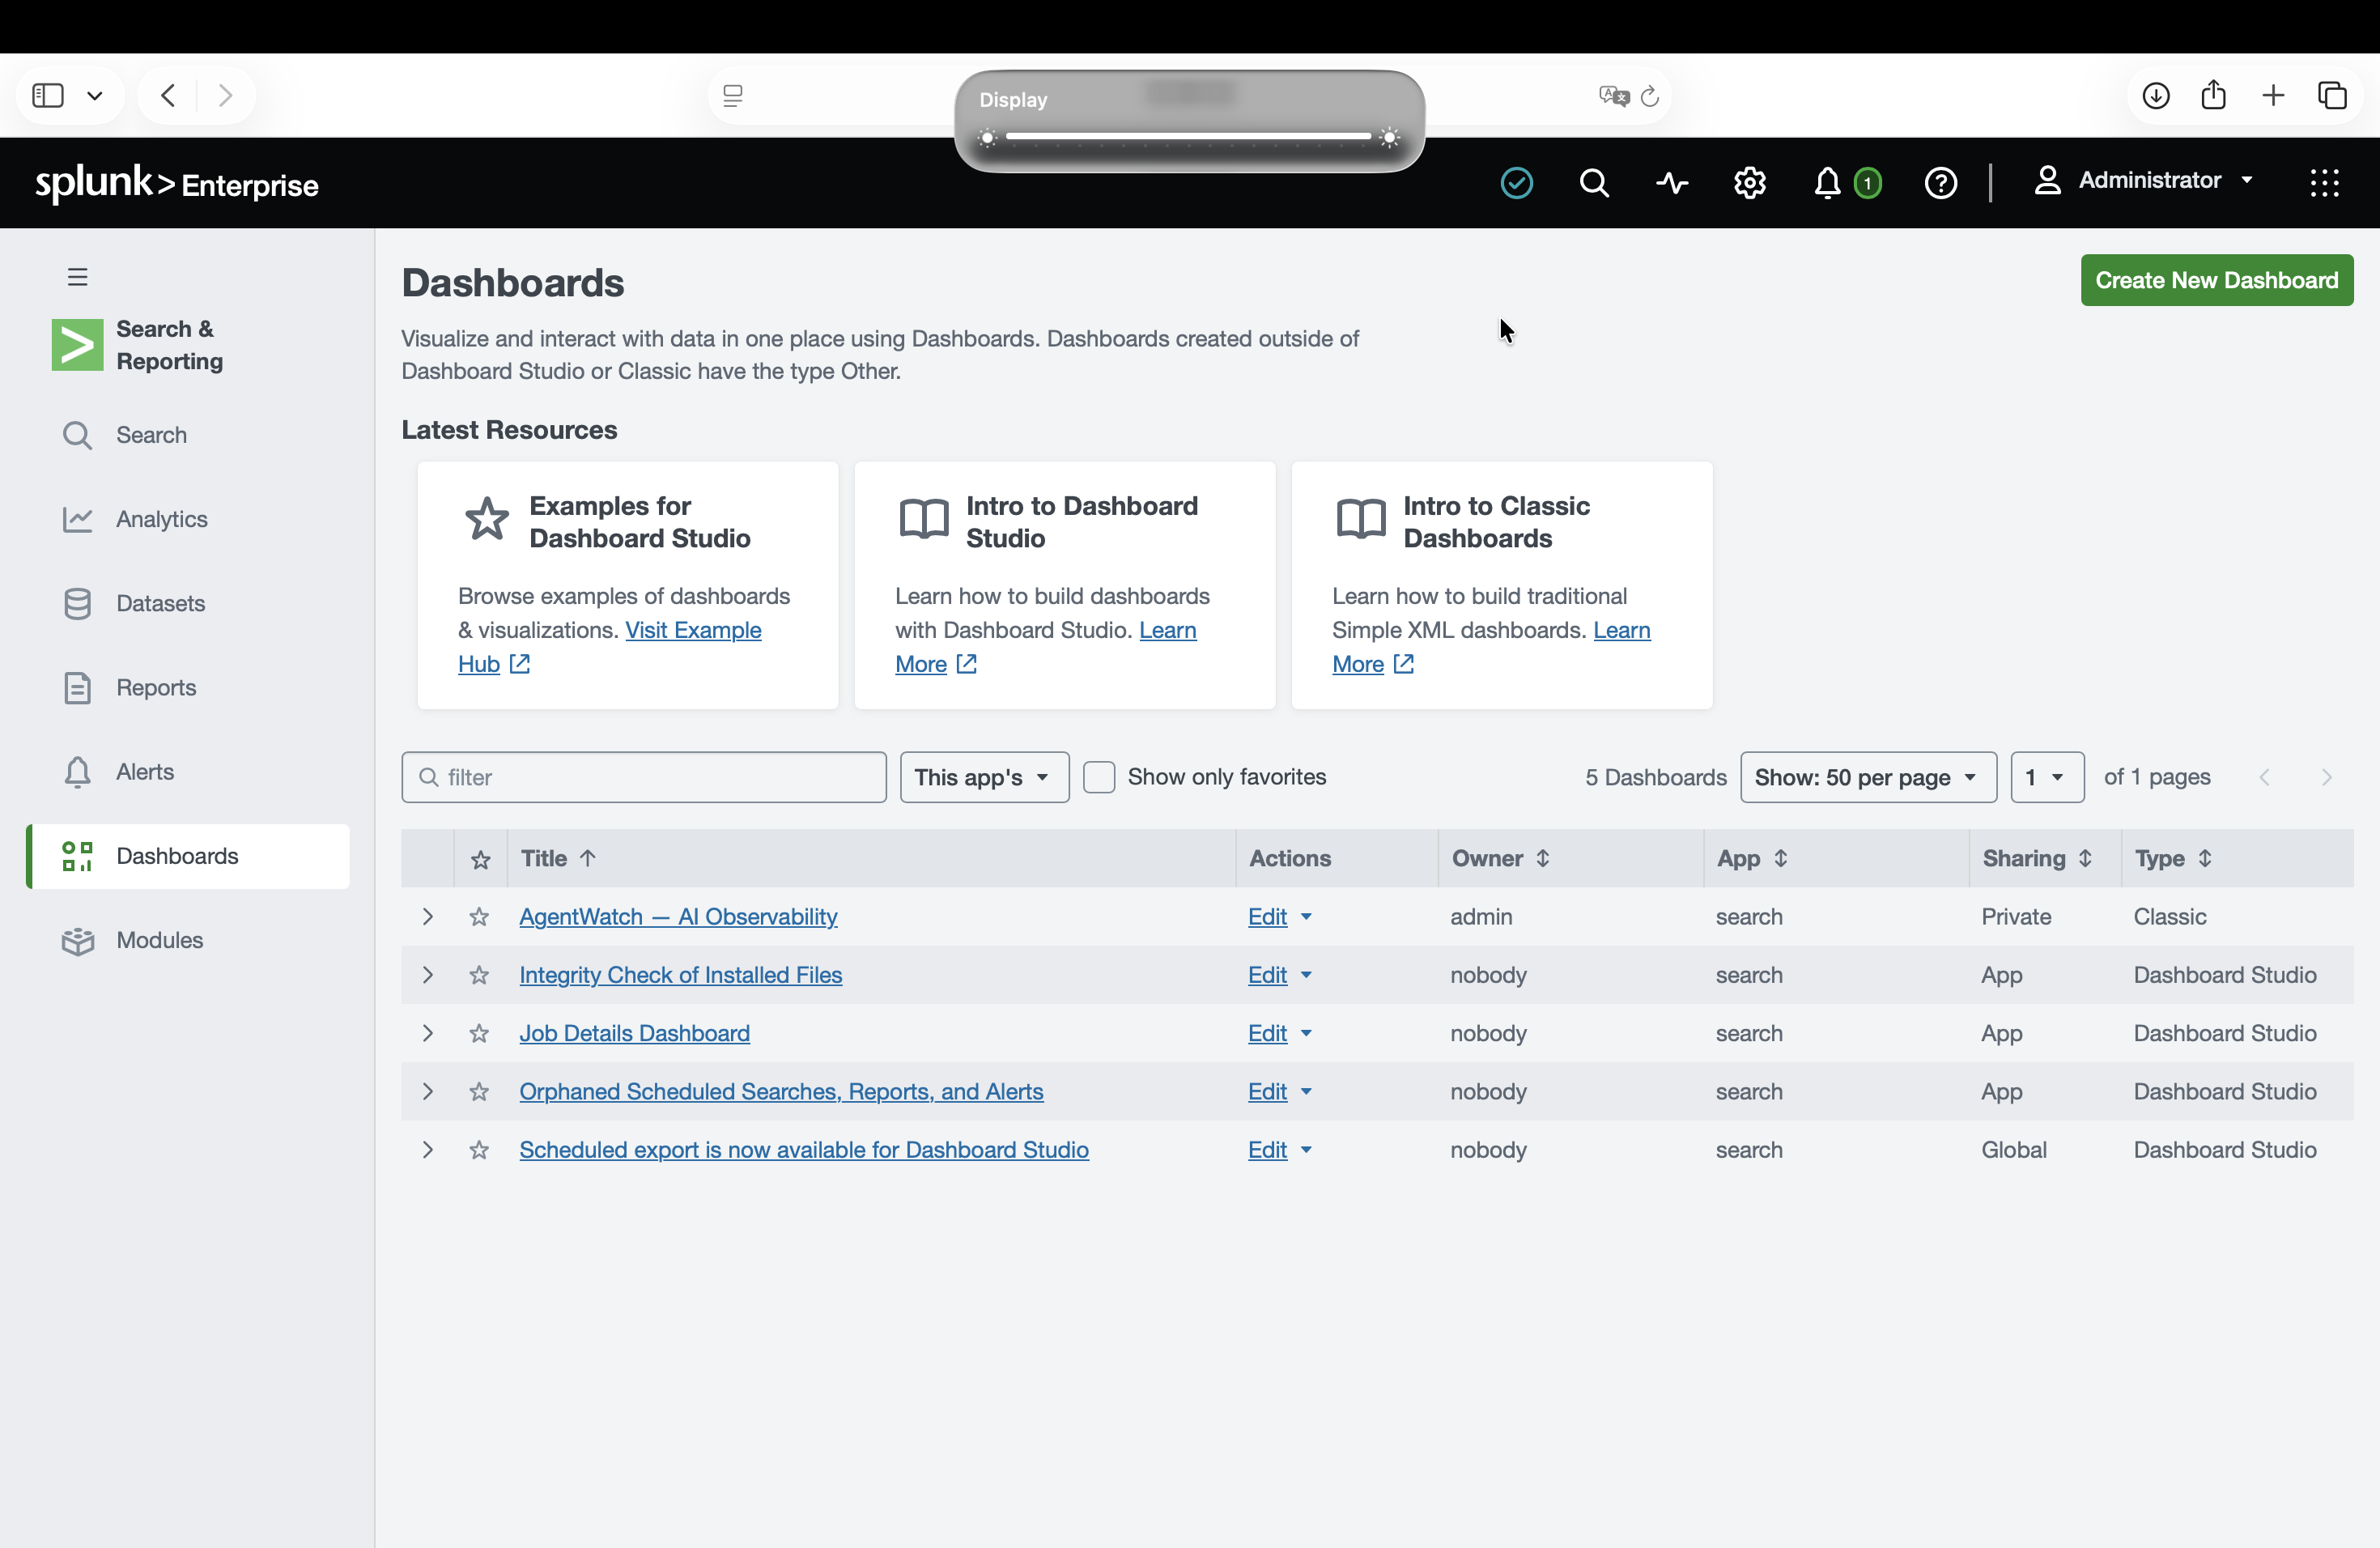
AgentWatch — 8-panel AI observability dashboard for Splunk. Traces, quality, forecasting, and self-healing in one place.
Inspiration
Every organization deploying AI agents inside Splunk faces the same blind spot. Your MCP Server is running queries, your AI Assistant is generating SPL — but when it returns a hallucinated result, when quality drifts over days, when token costs are about to spike — nobody catches it. AgentWatch was built to solve this: who watches your AI?
What it does
AgentWatch is a real-time AI observability platform with four core capabilities:
Agent Trace Collection — captures every MCP tool call with latency, token usage, and status. Logs 459+ trace events to a dedicated Splunk index with unique trace IDs.
AI Quality Scoring — uses an LLM-as-judge to score every agent response for hallucination, relevance, and completeness (0.0–1.0). Fires drift alerts when quality drops below 0.7 threshold.
Token Cost Forecasting — uses Splunk MLTK predict command to forecast token usage 24 hours ahead with 95% confidence bounds. Detected 6 real anomaly spikes in testing.
Self-Healing Engine — when a tool call fails, AgentWatch pulls context from Splunk, generates a root cause and corrected SPL query using local AI, and writes a notable event back to Splunk automatically.
How we built it
- Splunk MCP Server 1.2 — intercepts and traces every AI agent tool call
- Splunk AI Toolkit 5.7.4 — MLTK predict for time-series forecasting
- Splunk Python SDK — all data ingestion, search, and index management
- Ollama llama3.2 — local LLM running as quality judge and fix generator
- FastAPI — REST API exposing POST /trace and POST /score endpoints
- Splunk Classic Dashboard — 8 panels covering latency, quality, forecast, and healing
Challenges we ran into
The self-healing engine was the hardest component to make reliable. Ollama sometimes returns inconsistent JSON mixed with explanatory text. We solved this with a multi-strategy JSON parser that tries direct parsing, bracket extraction, and regex matching in sequence.
Generating 7 days of realistic historical data with correct timestamps for the MLTK forecast required careful handling of Splunk's time indexing.
Accomplishments that we're proud of
- Complete AI observability stack built in under 2 weeks as a solo developer
- Quality scorer correctly flags hallucinated responses with zero false negatives in testing
- MLTK forecaster detected 6 real token usage anomalies with zero manual configuration
- Self-healing engine generates actionable SPL corrections automatically
What we learned
Building observability for AI systems requires thinking recursively — you need AI to watch AI. The LLM-as-judge pattern for quality scoring is surprisingly effective at catching hallucinations that rule-based systems would miss. The Splunk MLTK predict command is powerful for anomaly detection with minimal setup.
What's next for AgentWatch — AI Observability for Splunk AI Agents
- Integration with Splunk Enterprise Security to surface AI quality issues as ES notable events
- Support for Splunk Cloud with hosted Foundation-sec model as the quality judge
- Real-time streaming dashboard using Splunk WebSocket API
- Multi-agent workflow tracing across full agentic pipelines
- Cost attribution per team or use case for AI budget management


Log in or sign up for Devpost to join the conversation.