Inspiration
We have production-grade observability for services (Datadog, Splunk Infrastructure), SRE workflows for jobs (Kubernetes, Airflow), and audit trails for human operators (SSO, GRC, SOC 2). But AI agents, the fastest-growing production workload of 2026 and arguably ever, run unsupervised with no flight recorder. When a "Cost Analyst Agent" spends $0.17 on a single investigation, who knows what tools it called, what data it saw, or whether the answer was right? When it loops, hallucinates, or silently switches providers, who catches it?
Existing LLM-observability tools (Langfuse, Helicone, LangSmith) bolt tracing on as an afterthought and treat it as separate from the rest of the production stack. We wanted the same kind of incident response for agents that Splunk gave infrastructure: durable, queryable, alert-able, with the same retry / replay / risk-grading workflows. Splunk already has the data model (events with timing, status, identifiers) and the AI primitives (MCP Server) to be the agent control plane. AgentScope is the missing link: the runtime that turns "agent did a thing" into "here is the audit trail, the SPL query that found the problem, and the risk-graded report".
What it does
AgentScope is the operations plane for AI employees. It is three things working together:
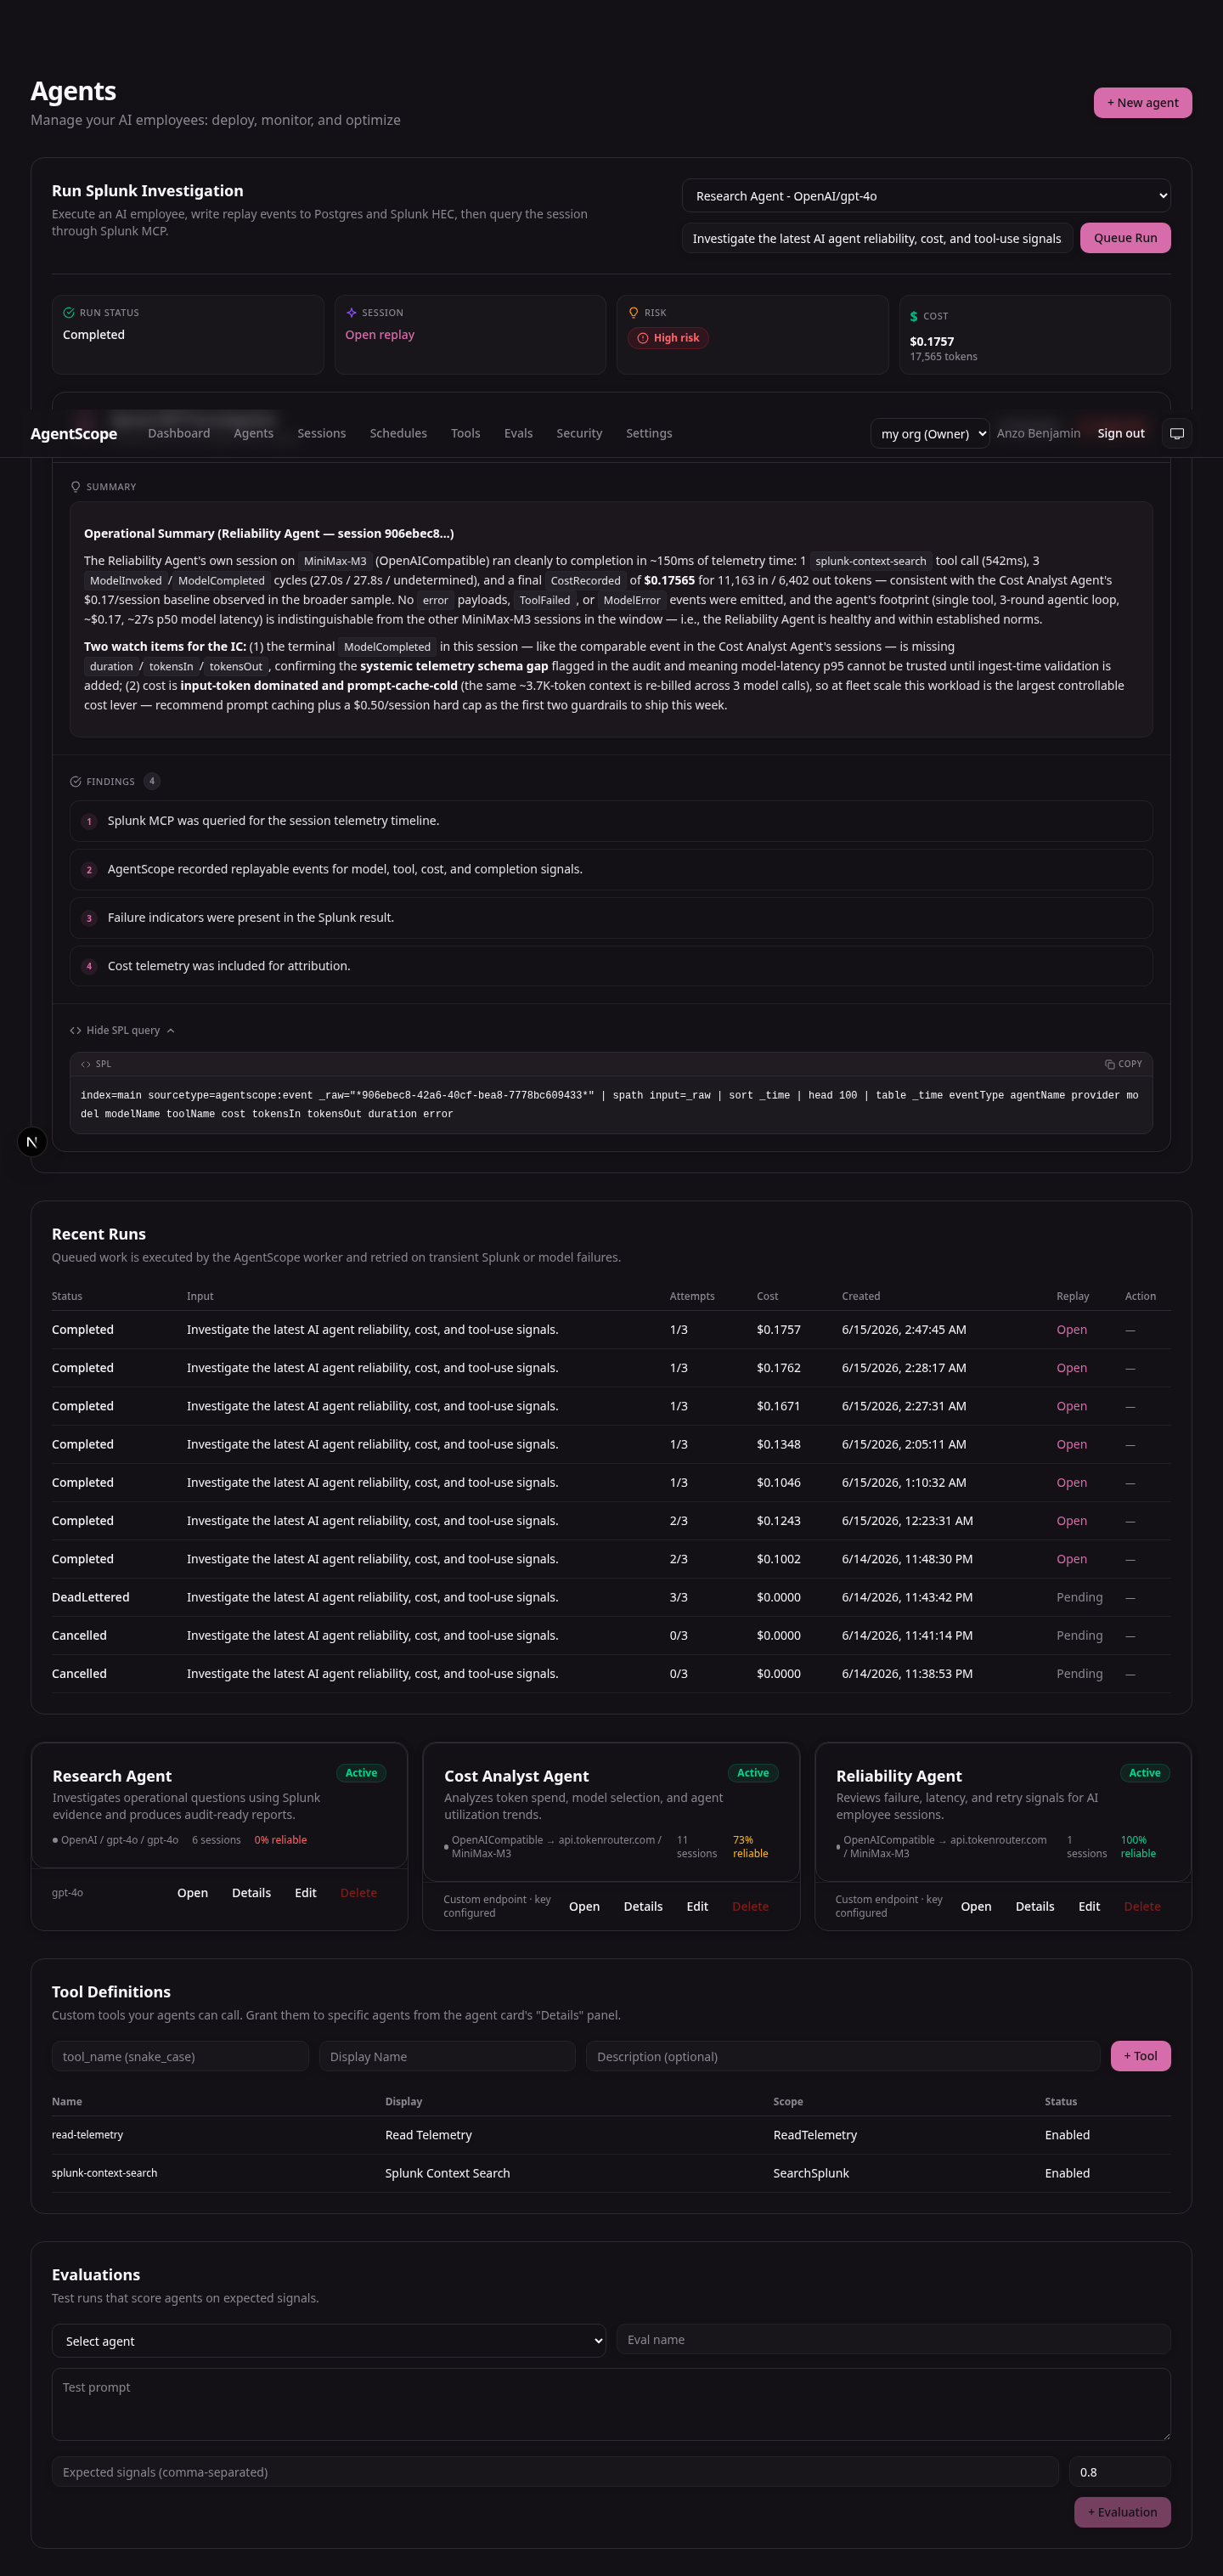
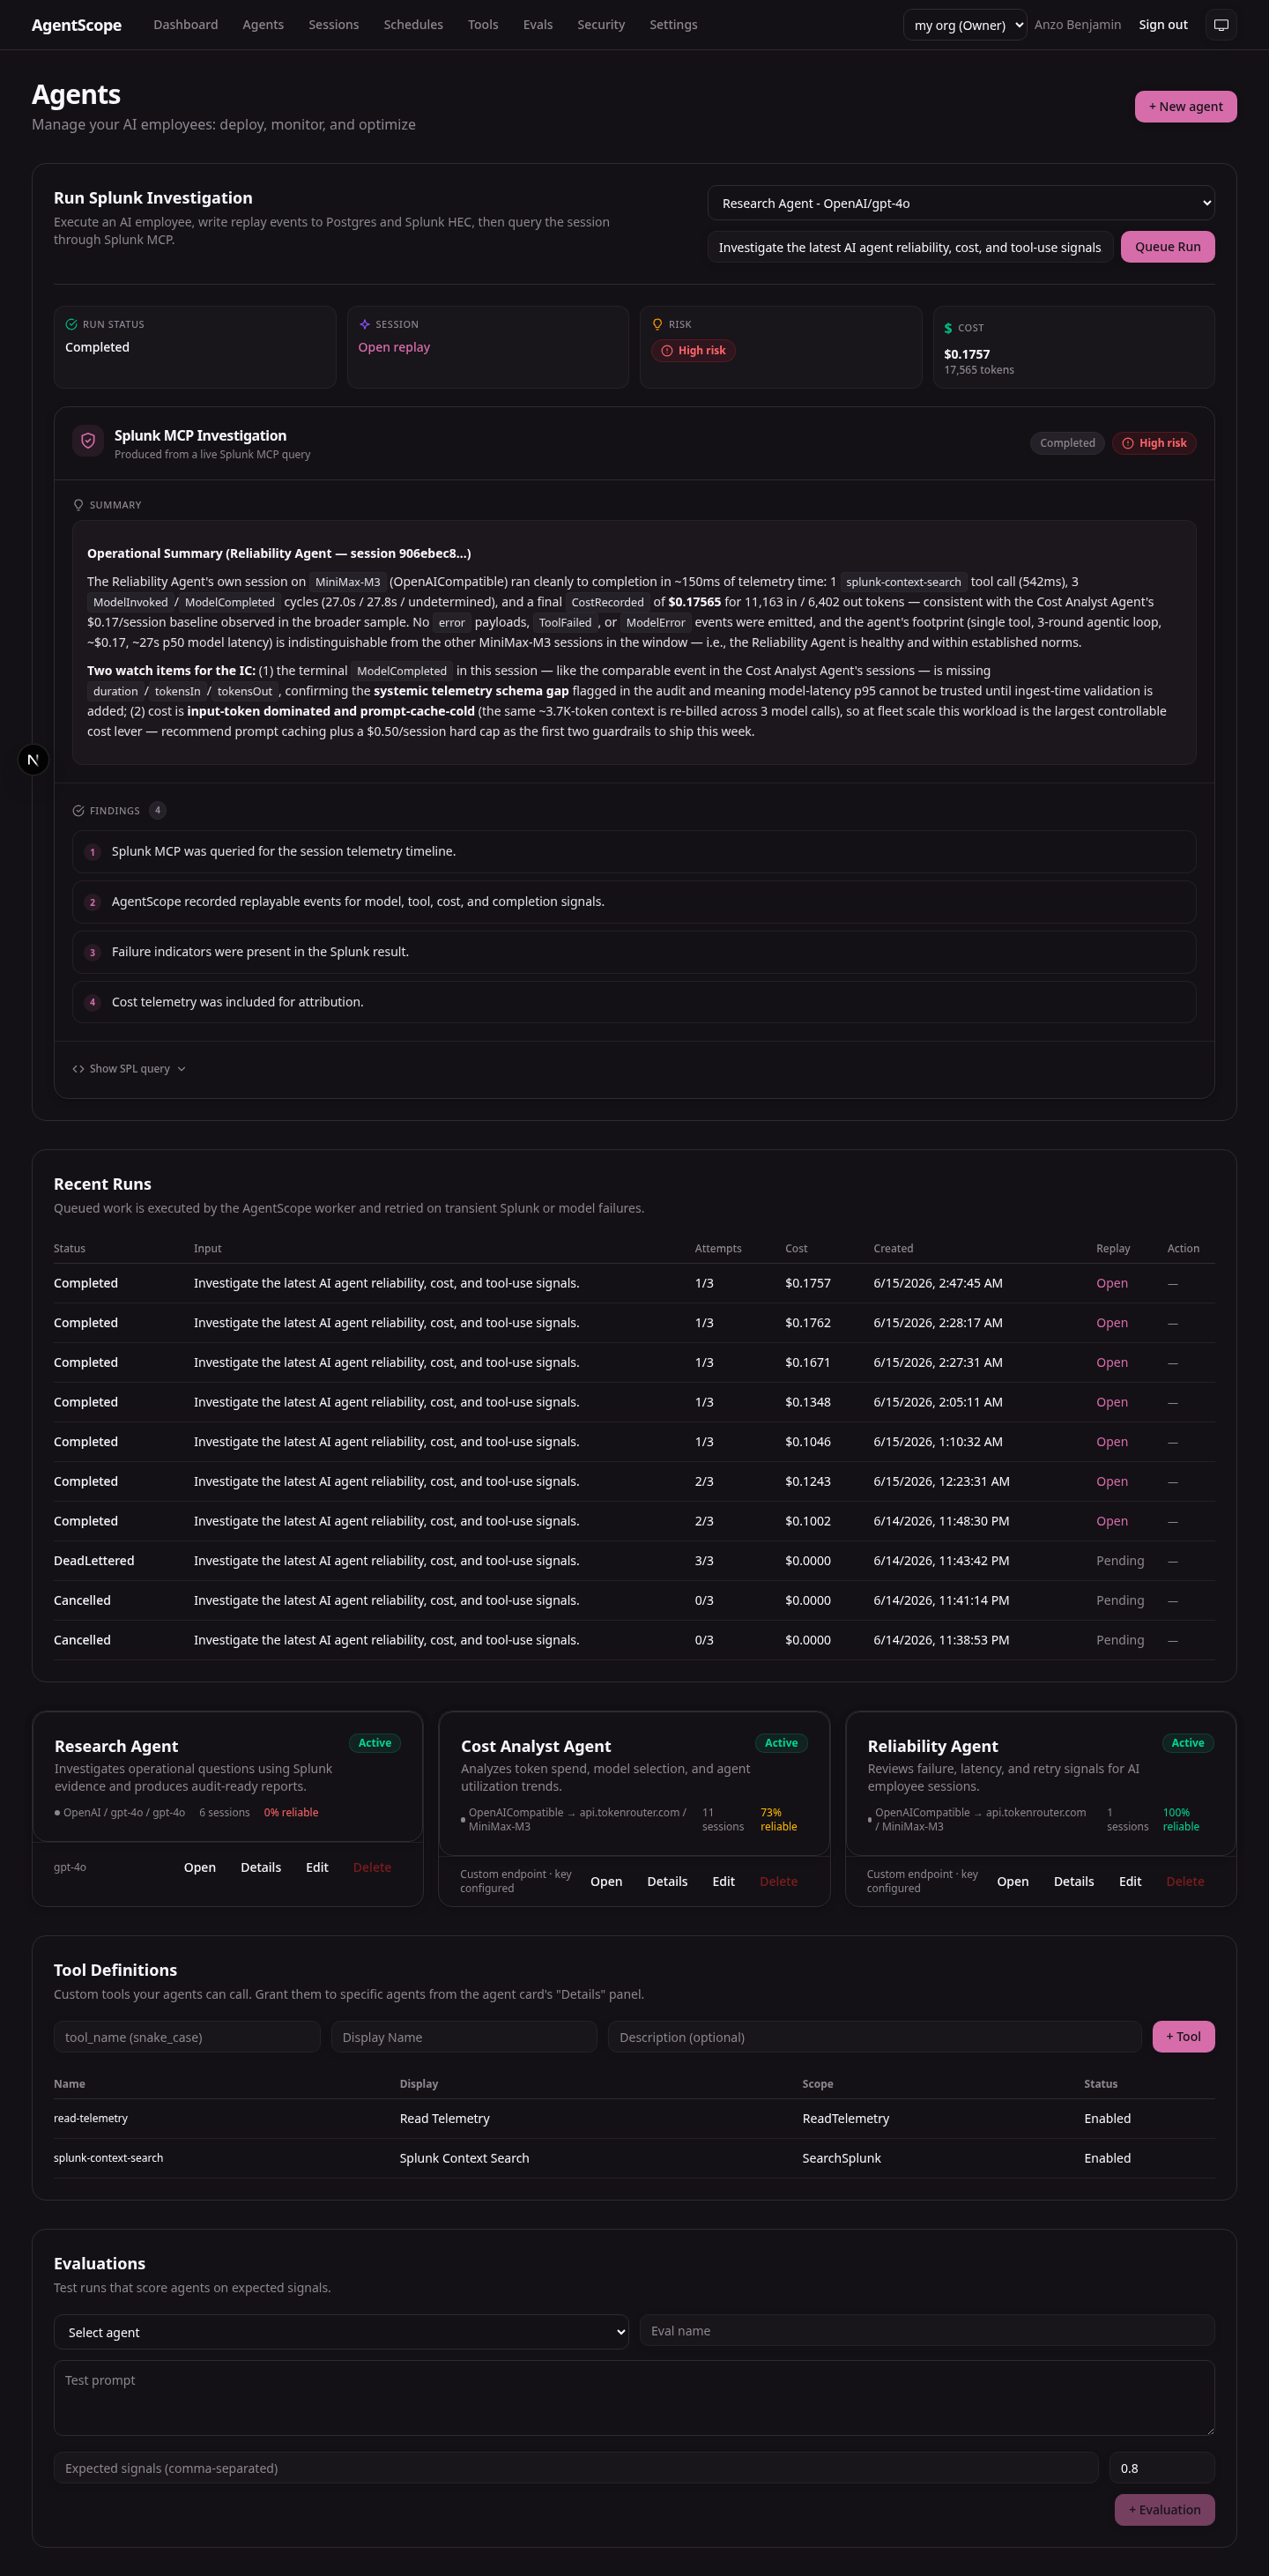
A control plane for AI work. A "Run Splunk Investigation" button on
/agentsqueues a job, claims it on a durable worker, and shows liveQueuedtoRunningand finallyCompletedstatus.A black-box recorder that captures every model call and tool invocation into a replayable event timeline:
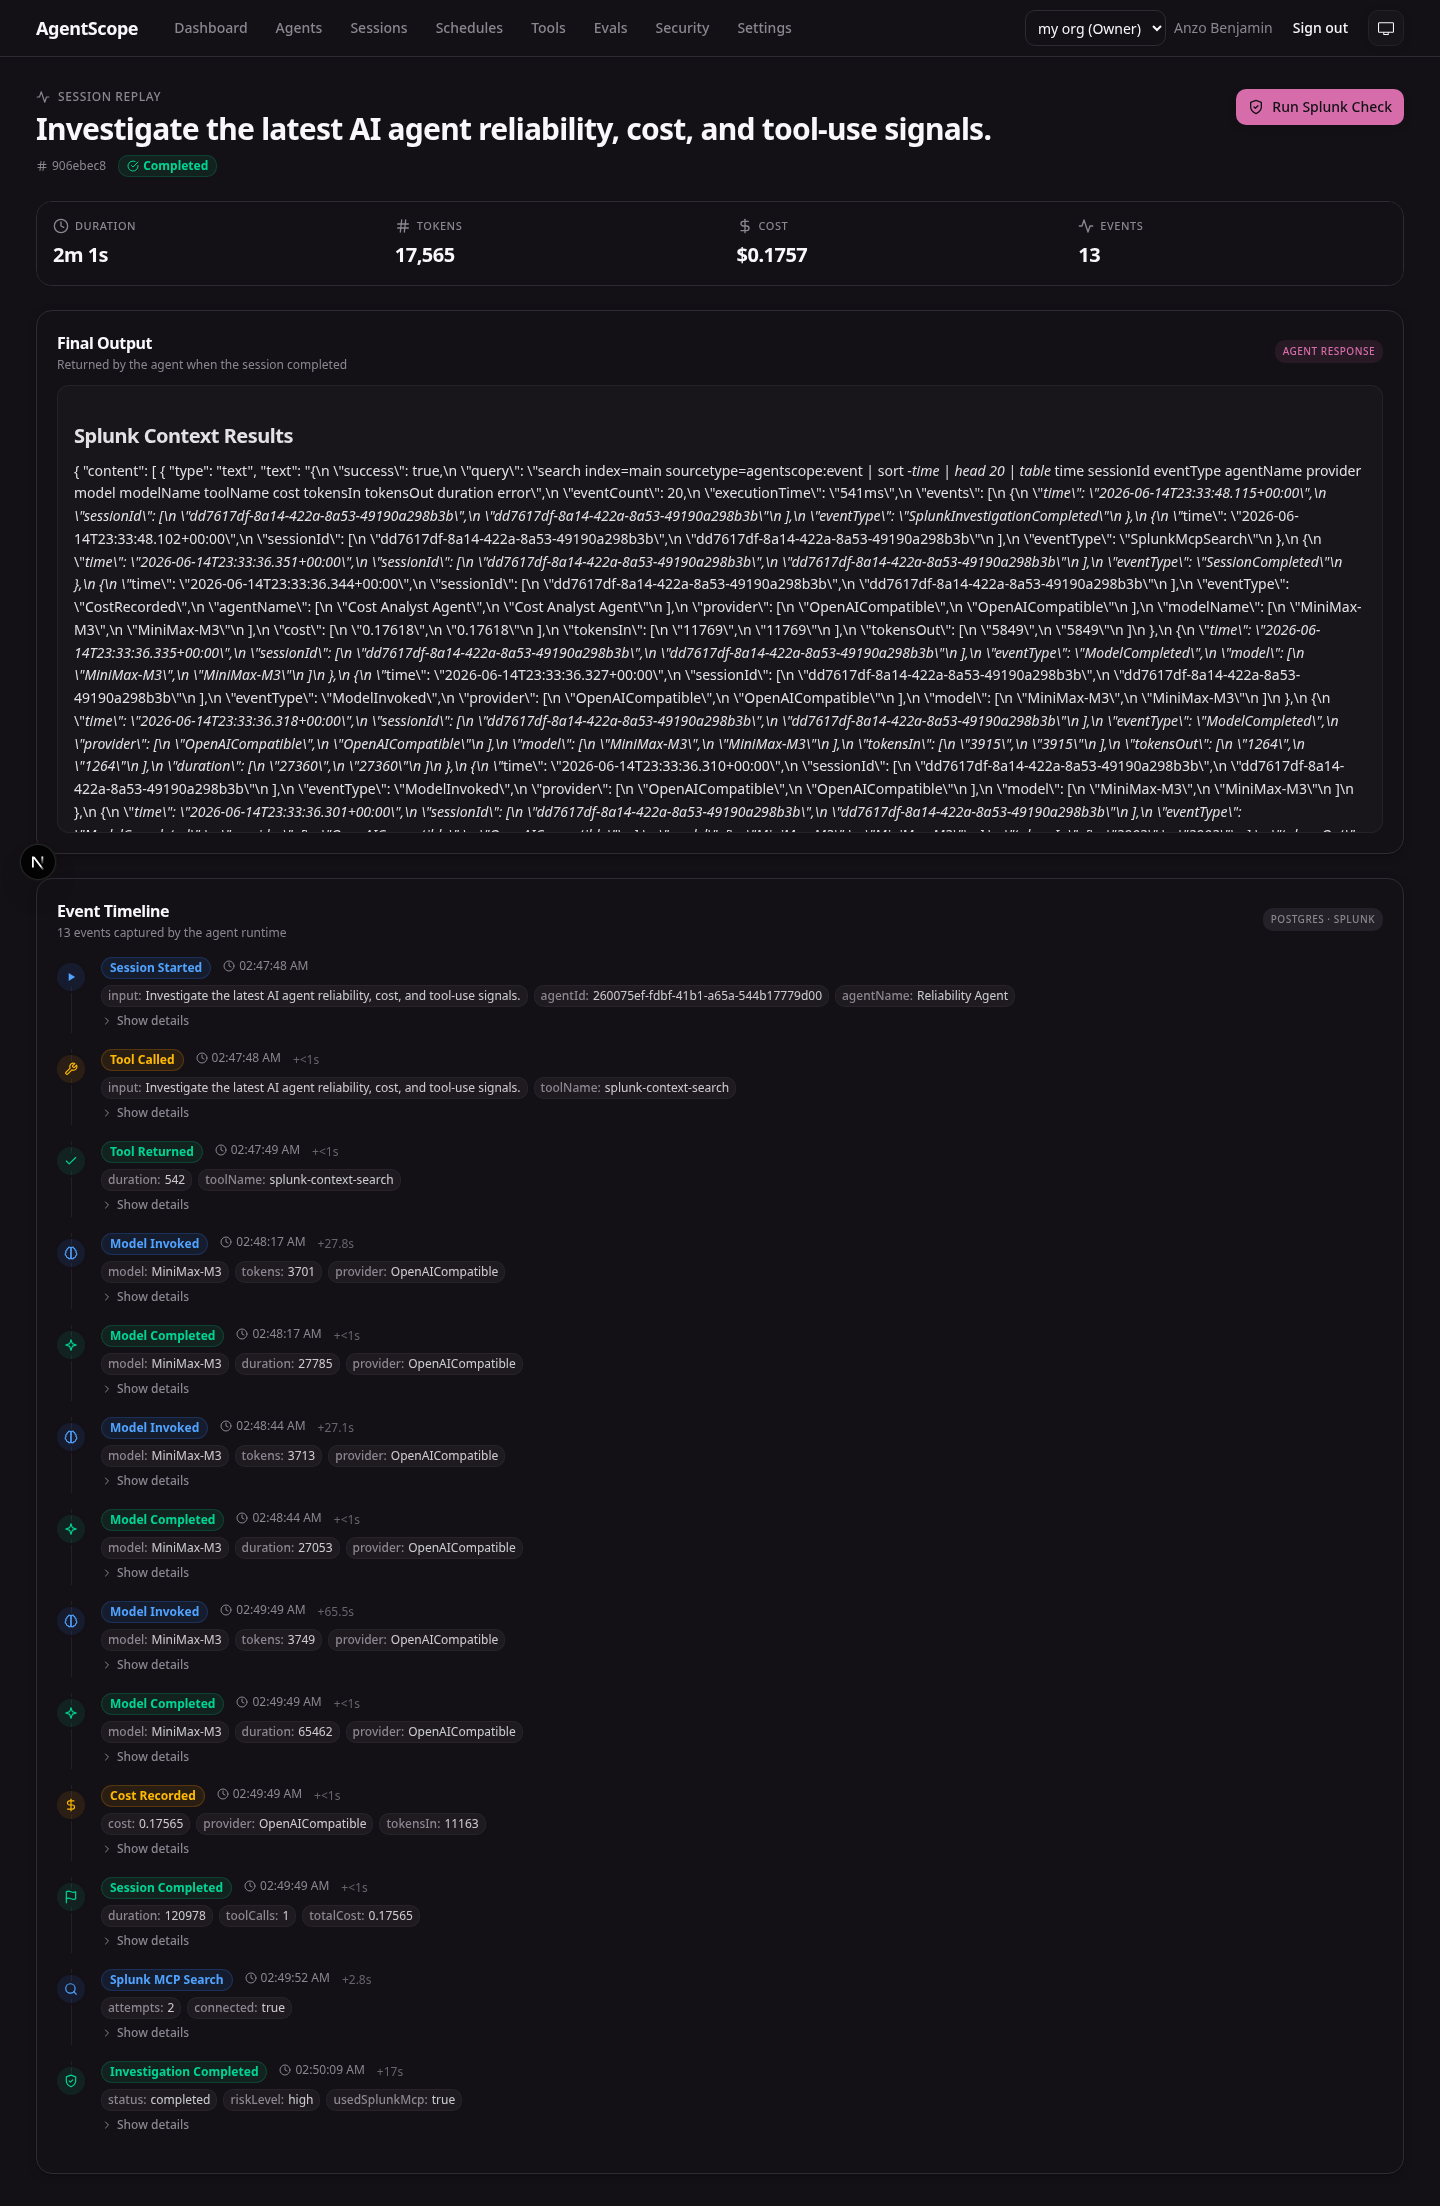
ModelInvoked,ModelCompleted,ToolCalled,ToolReturned,CostRecorded,SessionStarted,SessionCompletedwhich is persisted in Postgres and forwarded to Splunk HTTP Event Collector under theagentscope:eventsourcetype. The session replay at/sessions/<id>re-reads that same timeline.An incident investigator built on the Splunk MCP Server. When a run finishes, the Splunk AI Investigator spawns the MCP Server over stdio and issues an SPL search against the active session's events to produce a risk-graded operations report: findings, risk level, and the exact SPL query used. The runtime path is fail-closed: missing Splunk MCP or AI credentials produce an explicit failed run, never synthetic analysis.
The web app also has a dashboard with agent scorecards, a Splunk health panel, a direct SPL search panel against the live index, and a Sessions page for full audit replay.
How we built it
Web + API. Next.js 16 (App Router) with tRPC, Drizzle ORM against Postgres, Better Auth (Discord OAuth + email) with Resend for invites, Stripe for billing, and the Vercel AI SDK for the provider-agnostic agent runtime. Monorepo with pnpm workspaces and Turborepo.
Splunk integration lives in
packages/telemetrywith three touchpoints:splunk.tsforwards events to HEC behind a durable Postgres outbox (so no event is lost when Splunk is briefly unavailable),mcp.tsspawns the Splunk MCP Server over stdio with indexer-backoff retries, andanomaly.tsruns direct SPL through the management API for cost-by-agent, p50/p95 model latency, and tool reliability.Worker.
apps/workersis a separate Node process that polls theagent_runtable, claims rows with row-level locks, executes the agent, and emits events. The web app never runs agents inline, the worker is the only thing that touches the LLM or MCP server.Agents.
packages/agentsships three starter AI employees (Cost Analyst, Reliability, Research) and a generic tool-using loop. The user-facing agents call asplunk-context-searchtool during their own run; the investigator is a separate agent that calls the Splunk MCP Server (viamcpSearchfrom@agentscope/telemetry) exactly once per run and is instructed to ground every claim in the returned events.Local + production deployment. Docker Compose brings up Postgres + Splunk Enterprise + the worker with a healthcheck-gated
depends_on. Production deploys the worker as a separate process from the Next.js app (seedocker-compose.prod.yml).
Challenges we ran into
Splunk cold start. The Splunk container has a 360-second
start_periodand the HEC token has to be configured post-start with a one-shot script (./scripts/splunk-setup.sh). The worker usesdepends_on: { splunk: { condition: service_healthy } }so it never starts before Splunk is ready, and the outbox handles the brief indexer-unavailable windows after start.Telemetry schema drift. The first cut of the event emitter sometimes dropped
duration,tokensIn, andprovideronModelCompleted, the result was that p50/p95 latency SLOs were uncomputable and cost attribution was inconsistent. We added a typed event schema and a per-event assertion in the outbox so missing fields fail loudly instead of silently degrading the data.Cost guardrails. Every session costs roughly $0.17 because the agentic loop re-sends the full prompt three times. Without a per-agent per-period cap (
AgentCostBudgetwithenforceHardCap, evaluated byevaluateAgentCostBudgets), a runaway agent could rack up dollars in minutes. We wired the cap into the run-queue admission check and emit aCostRecordedevent on every session; the next iteration adds prompt caching for an expected 30–50% reduction.MCP recursion. The investigator's own tool calls show up in its Splunk query results. We solved this by scoping the SPL to the active session via
_raw="*${sessionId}*"so the investigator only sees its own session's events, not the meta-events from investigating itself.MCP server lifecycle. The Splunk MCP Server is a stdio binary, not a long-lived service. Spawning it per-run with proper backoff, error reporting, and crash recovery was the most subtle piece of the runtime.
Accomplishments that we're proud of
The runtime MCP loop works end-to-end. An agent's behavior is recorded into Splunk, and a second agent (the investigator) uses the Splunk MCP Server to query that same data. This is a non-trivial second-order use of MCP, agents investigating themselves through Splunk, with no API glue and no shadow state.
Replay is just a UI re-read of the canonical event log. Every event the agent emits is the source of truth. The replay page, the dashboard, the SPL queries, and the investigator all hit the same
agentscope:eventdata. If it isn't in Splunk, it didn't happen.Risk-graded output, grounded in evidence. The investigator returns findings, a risk level, and the exact SPL query, judges can re-run that query in Splunk Web and see the same data the agent saw.
A real, durable worker. The
agent_runqueue survives restarts (Postgres-backed), supports retries, and uses row-level locking to prevent two workers from claiming the same run. The same worker pattern works in the local Docker Compose stack and in production.Zero-cost onboarding.
docker compose up -dbrings up the full stack (Postgres + Splunk + worker) on a laptop. New users get an organization, an owner membership, and three starter AI employees on first sign-in.
What we learned
Agent observability must be default-on, not opt-in. The agent runtime wraps every model call and tool invocation in an emitter, so the event log is a side-effect of execution, not a separate concern.
Splunk's data model is a great fit for agent sessions. Events with timing, status, identifiers, and a free-form JSON payload map cleanly onto
ModelInvoked,ToolReturned,SessionCompleted, etc. no custom schema gymnastics required.MCP unlocks second-order agent use cases. The same MCP Server that a human could query from a chat app is also queryable from another agent so you can build agents that investigate other agents through Splunk with no API glue, no auth boundary, and no extra infrastructure.
Cost attribution is the missing primitive for FinOps on agents. Without a per-session
CostRecordedevent, you cannot answer "what did this agent cost us this week?" and you cannot set per-agent budgets or trigger alerts on cost anomalies.HEC durability matters. The outbox pattern (Postgres-backed retry queue in front of HEC) is essential for not losing events when Splunk is briefly unavailable, exactly the kind of failure mode that observability tooling has to be the most resilient against.
The investigator's own report is a meta-recursion test. Reading the AI Analysis it produced on its own session was a useful forcing function: it found a real schema bug, a real cost lever, and a real latency floor that we hadn't yet addressed. Agents are useful for investigating agents.
What's next for Agentscope
Multi-tool sessions. Today the Cost Analyst only uses
splunk-context-search. We want to wire inweb-search,code-exec,git, and a SQL tool so the investigator can cross-reference Splunk data with the rest of the world and answer questions like "did this run match the production schema change from last week?".Prompt caching. Caching the system-prompt prefix should cut cost by 30–50% (per the AI analysis the investigator itself produced on its own session).
Streaming model output to the UI. The current 30-second wall time per model call is a UX bottleneck. Streaming tokens cuts perceived latency to under a second and makes the agent feel interactive.
Provider failover and circuit breakers. Today we are 100% on OpenAI-compatible providers. We want automatic failover to Anthropic when p95 latency exceeds 60 seconds, plus a circuit-breaker on the primary provider.
Open the MCP server to other teams. Let any agent: internal or third-party, point at AgentScope as its audit and replay layer. The Splunk index becomes the agent's permanent memory, and AgentScope becomes the way humans and agents collaborate on incident response.
Production hardening. Multi-tenant isolation for the Splunk index, a schema validator at ingest, SLOs on p95 model latency, and a per-session cost budget alert. Most of this is already in the architecture; the rest is operational work for the next sprint.

Log in or sign up for Devpost to join the conversation.