-
-
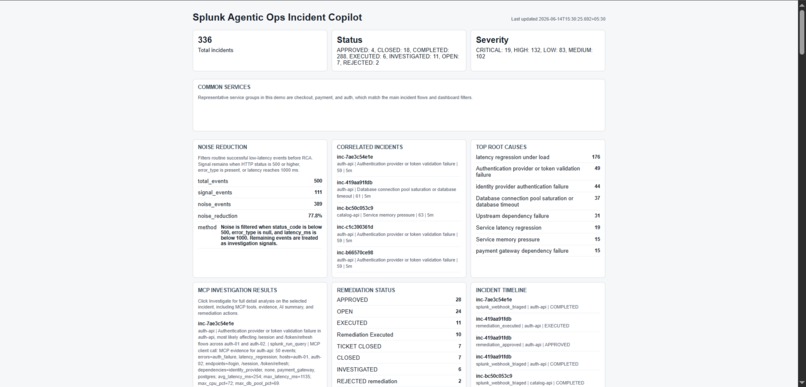
Splunk Home Dashboard
-
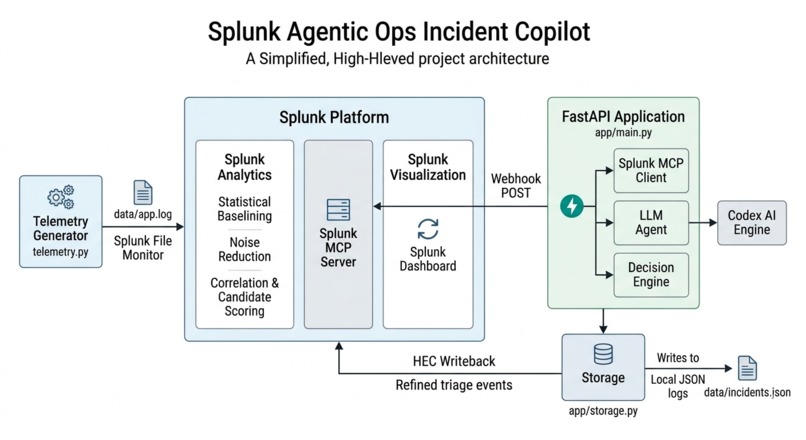
Project Architecture and Flow
-
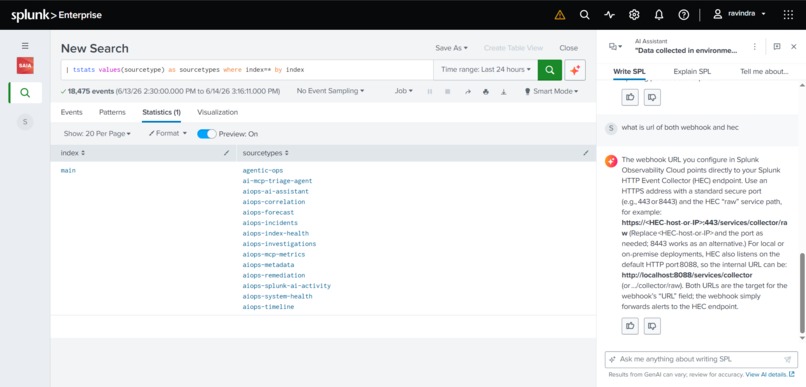
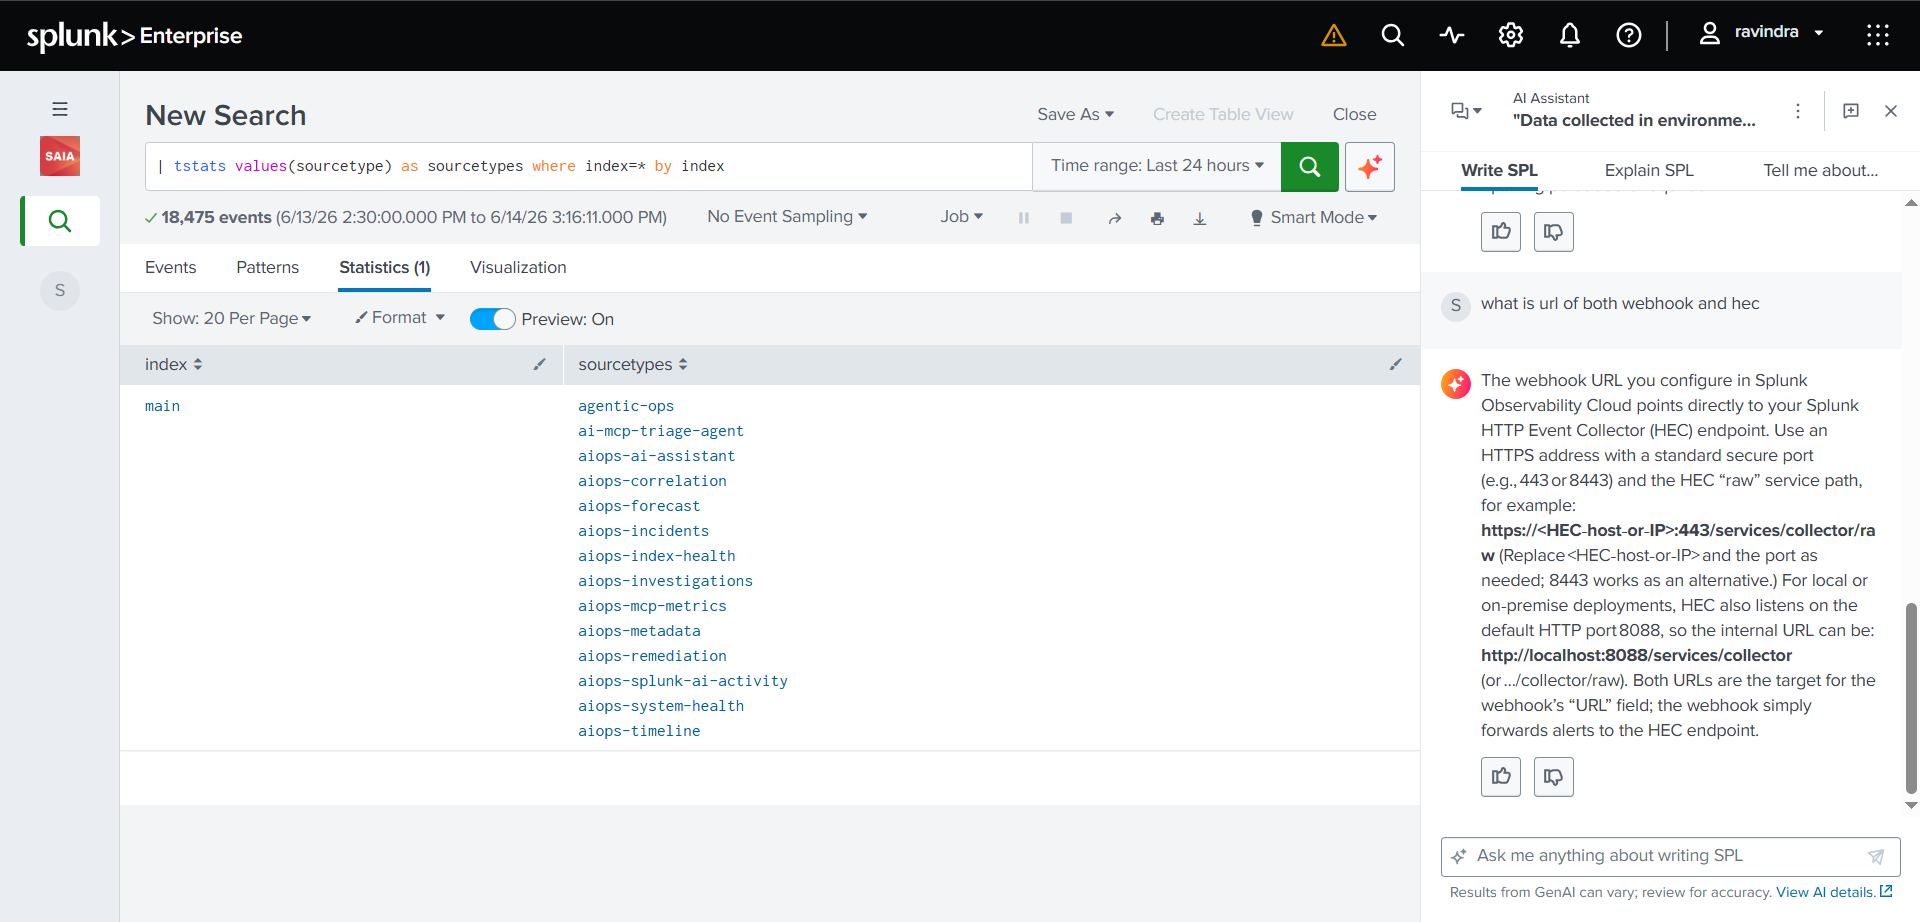
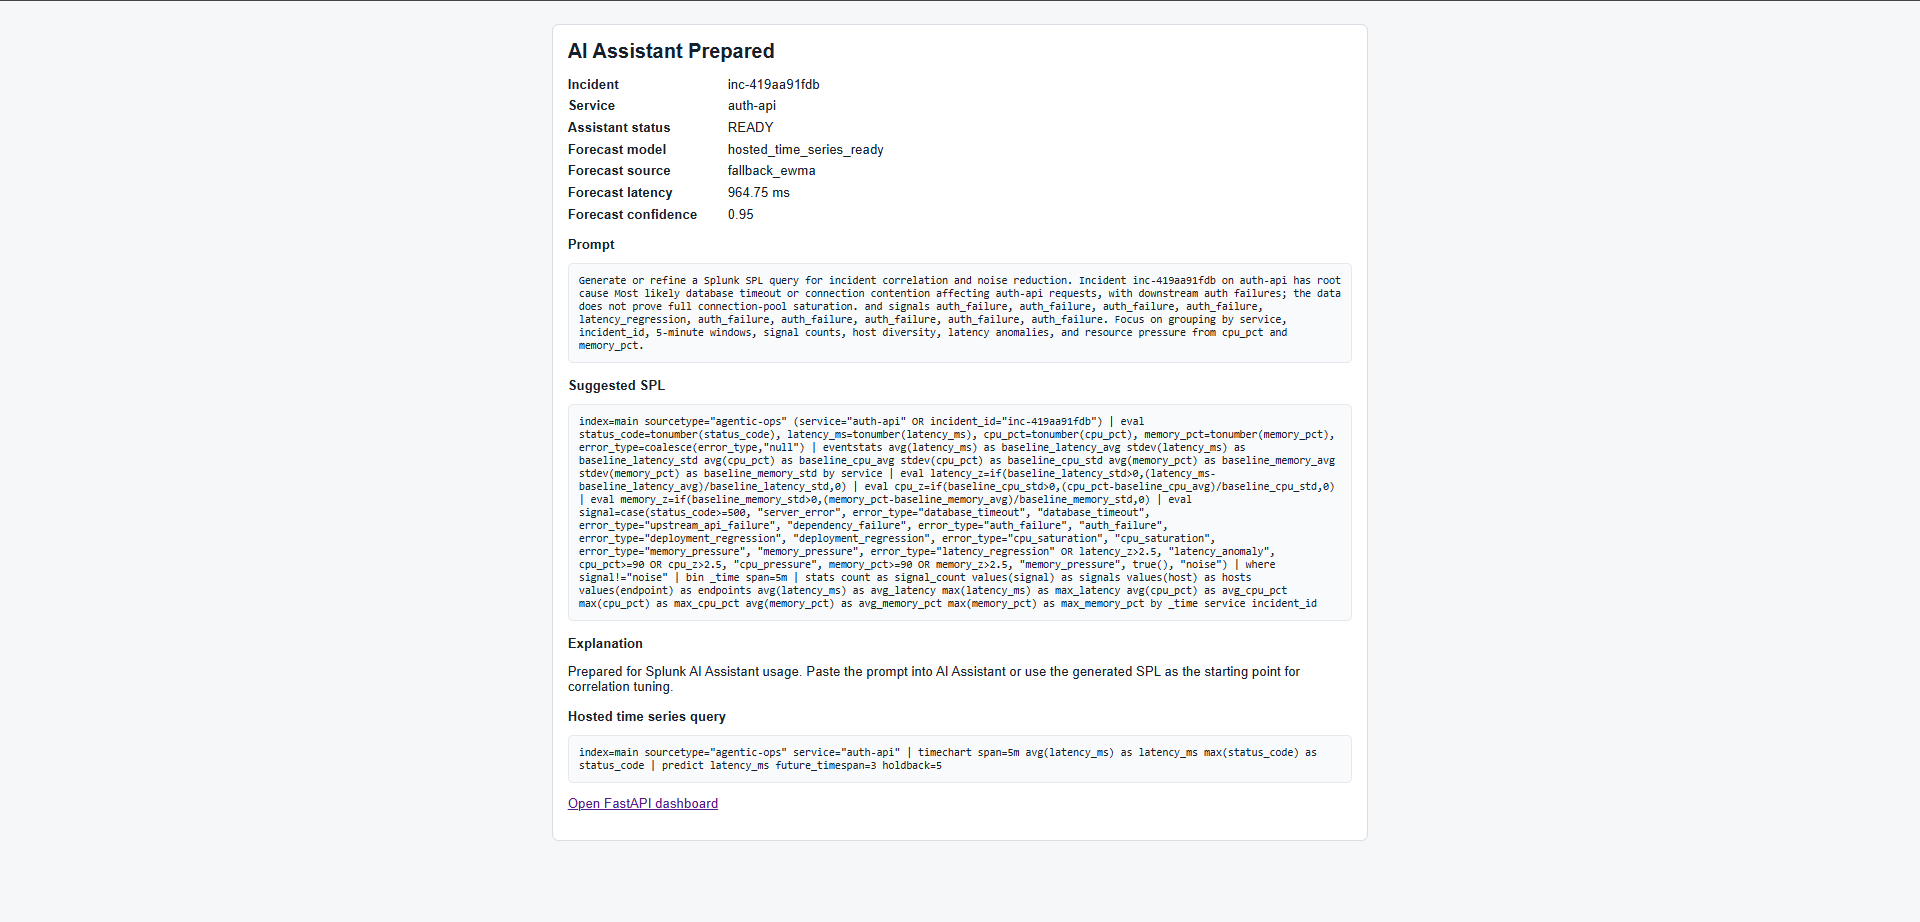
Splunk AI assistant
-
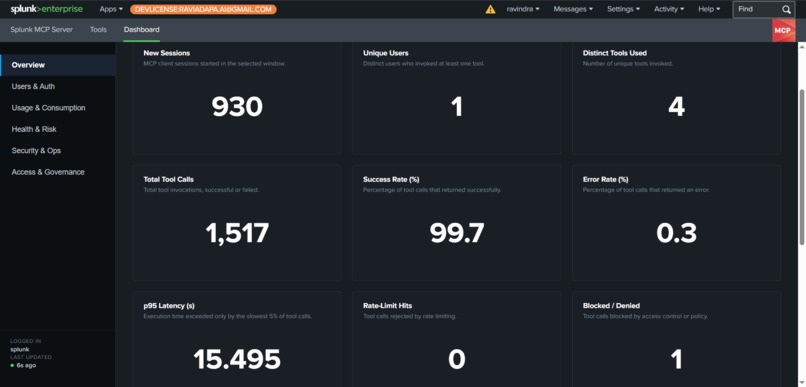
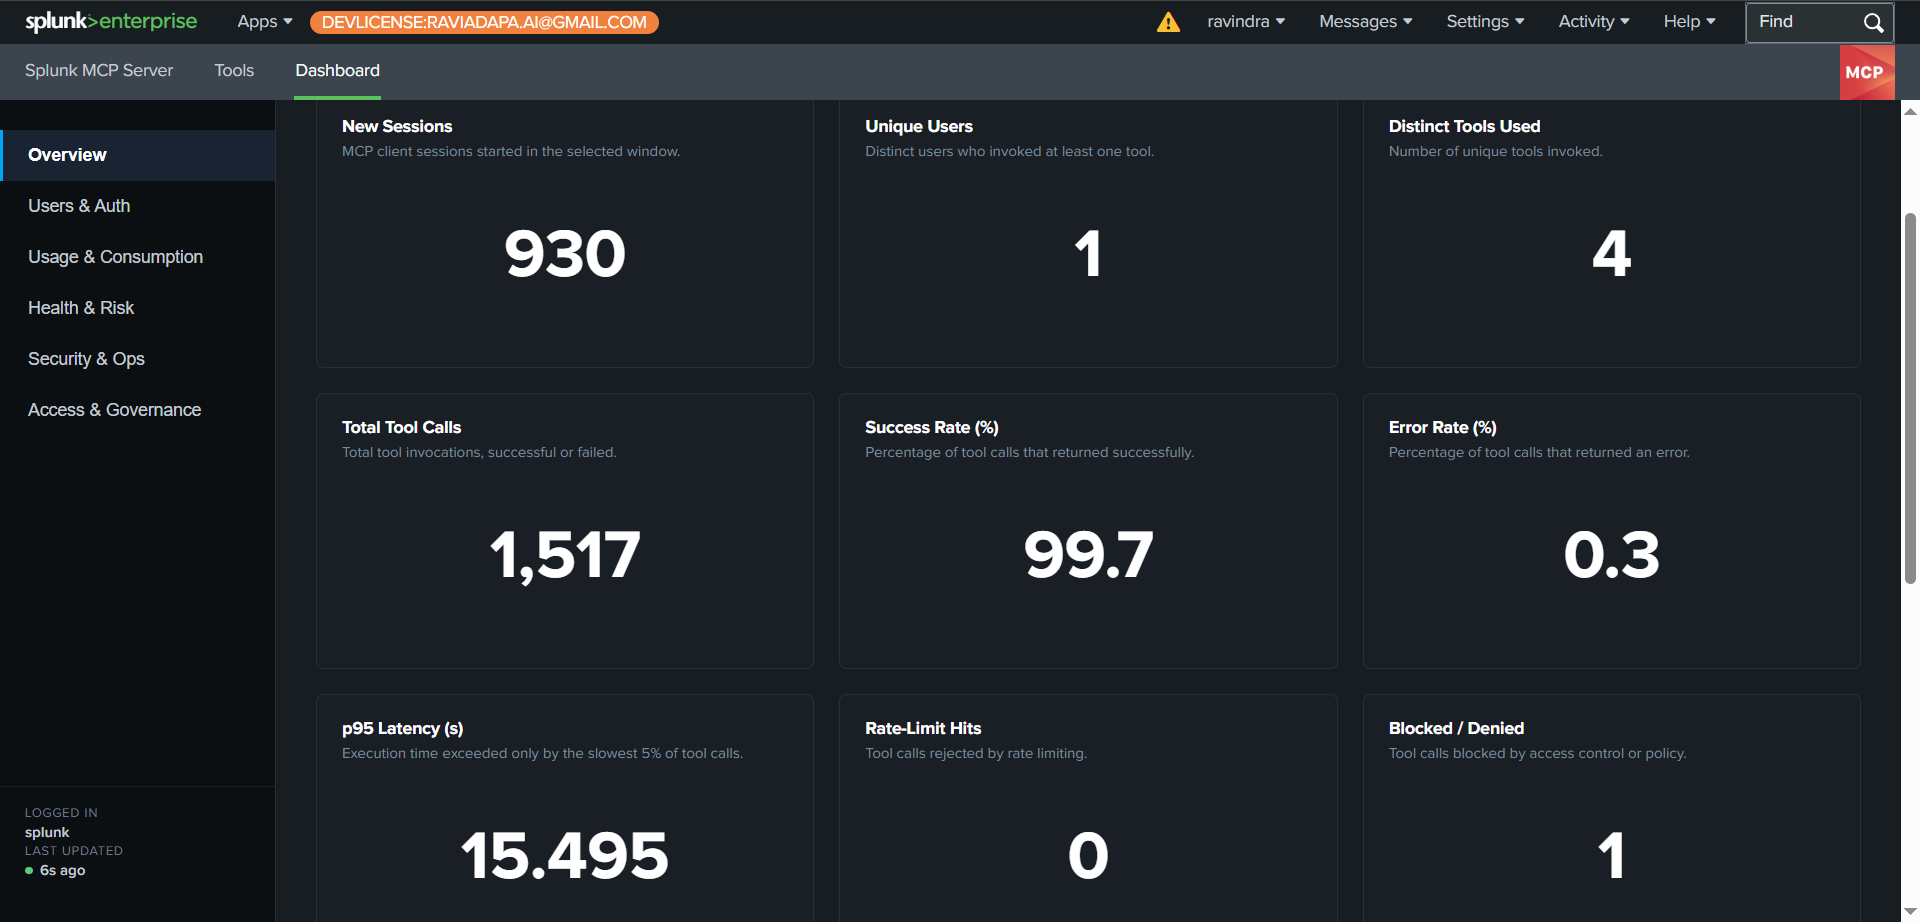
Splunk MCP Server Dashboard
-
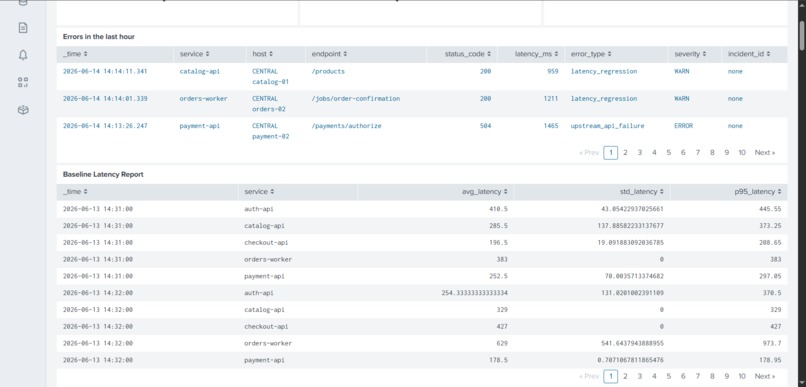
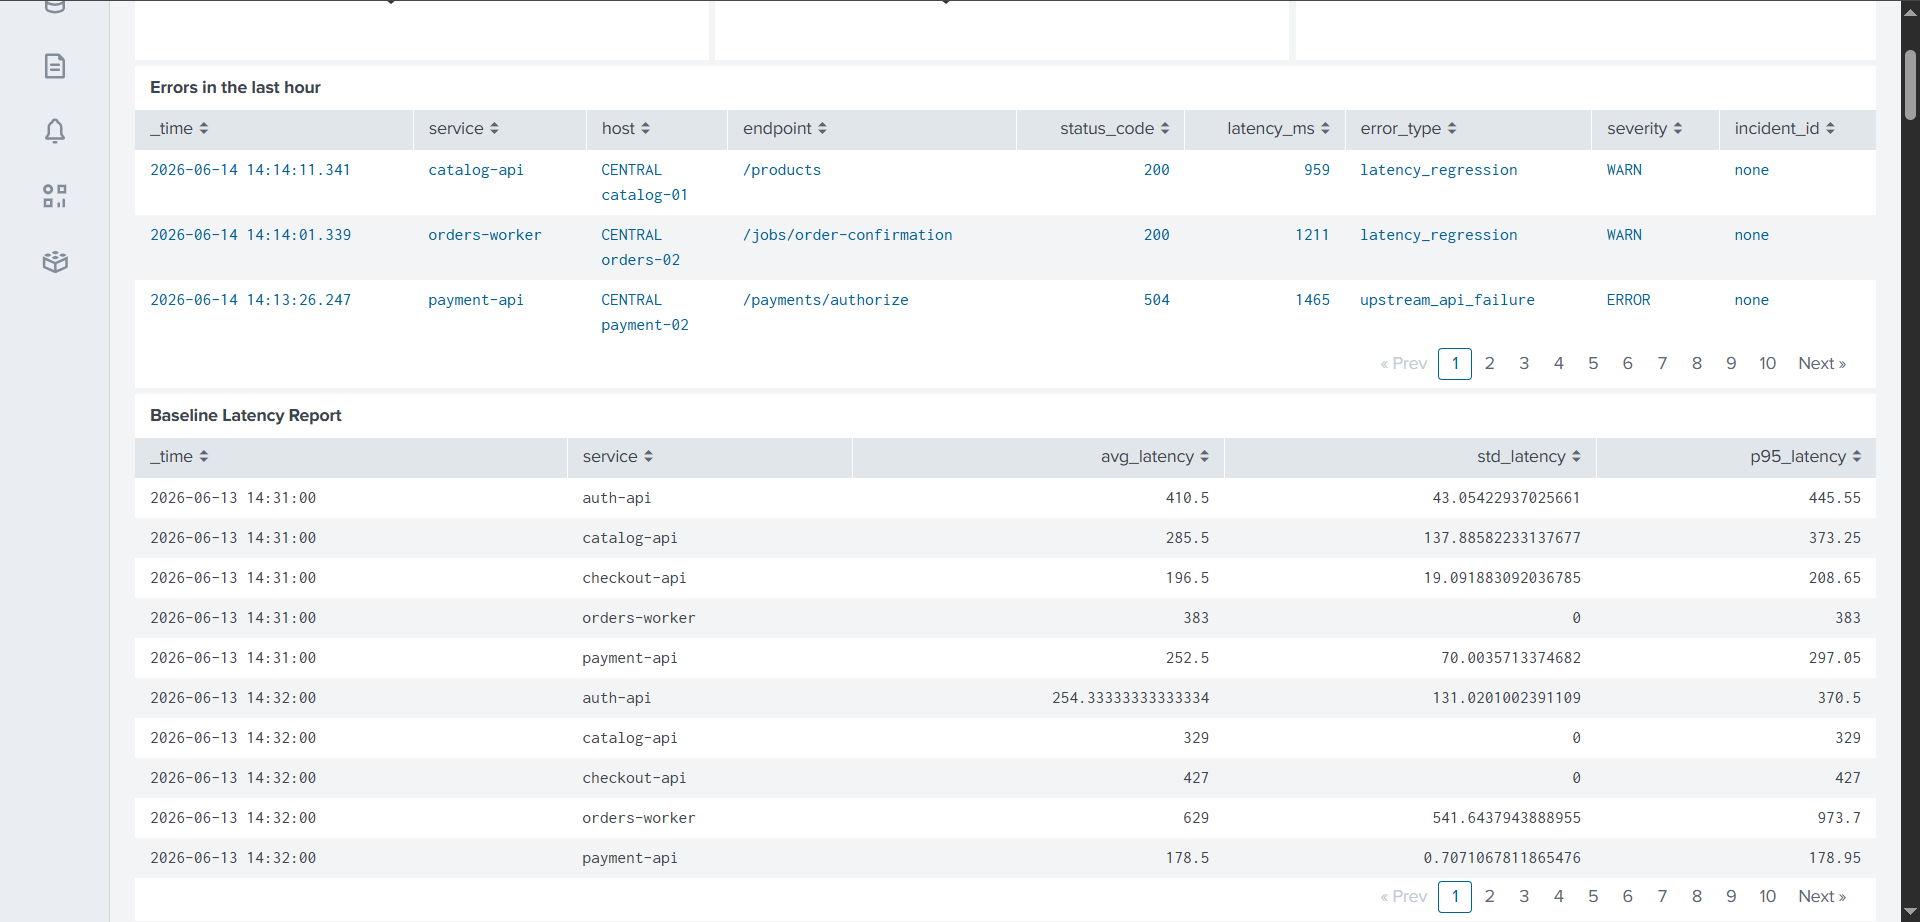
Noise, Errors and Baseline Latency Panel
-
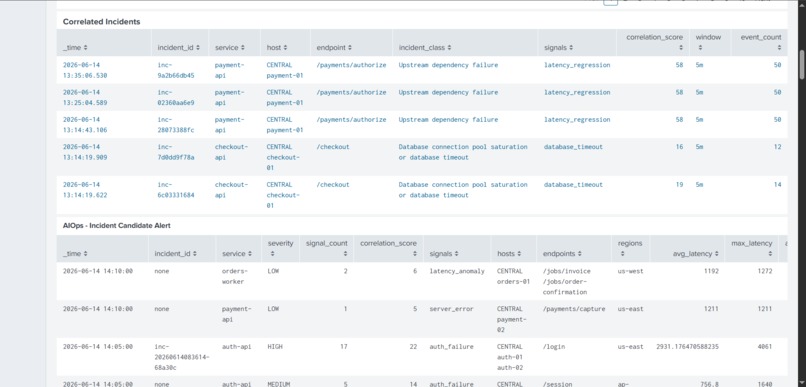
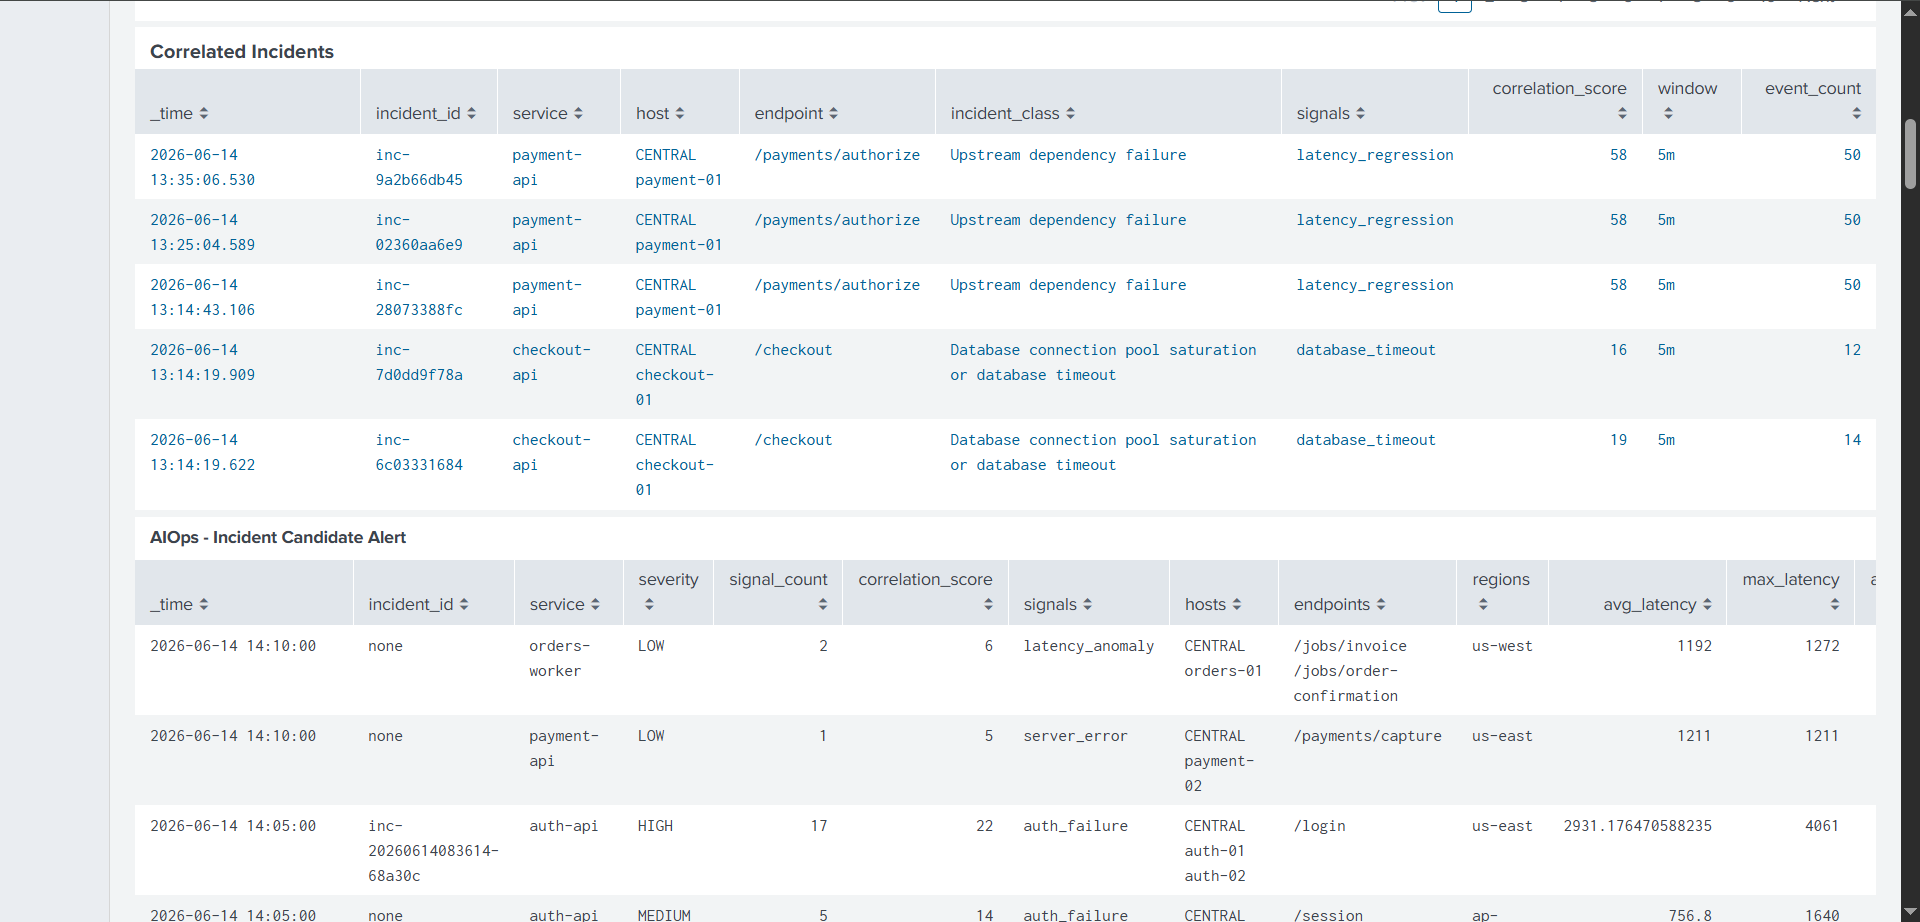
Correlated Incidents and Incident candidate Alert
-
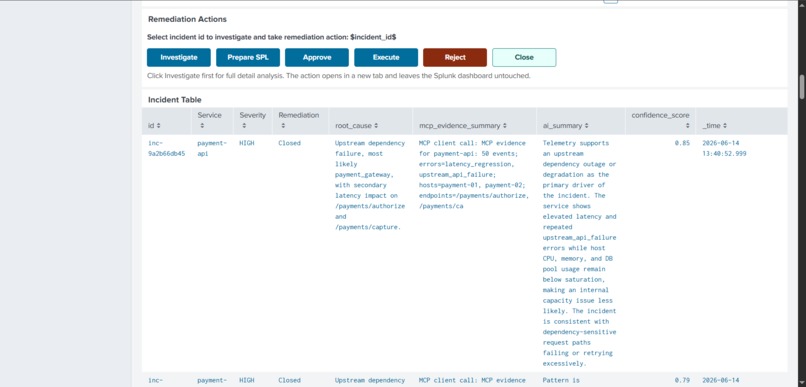
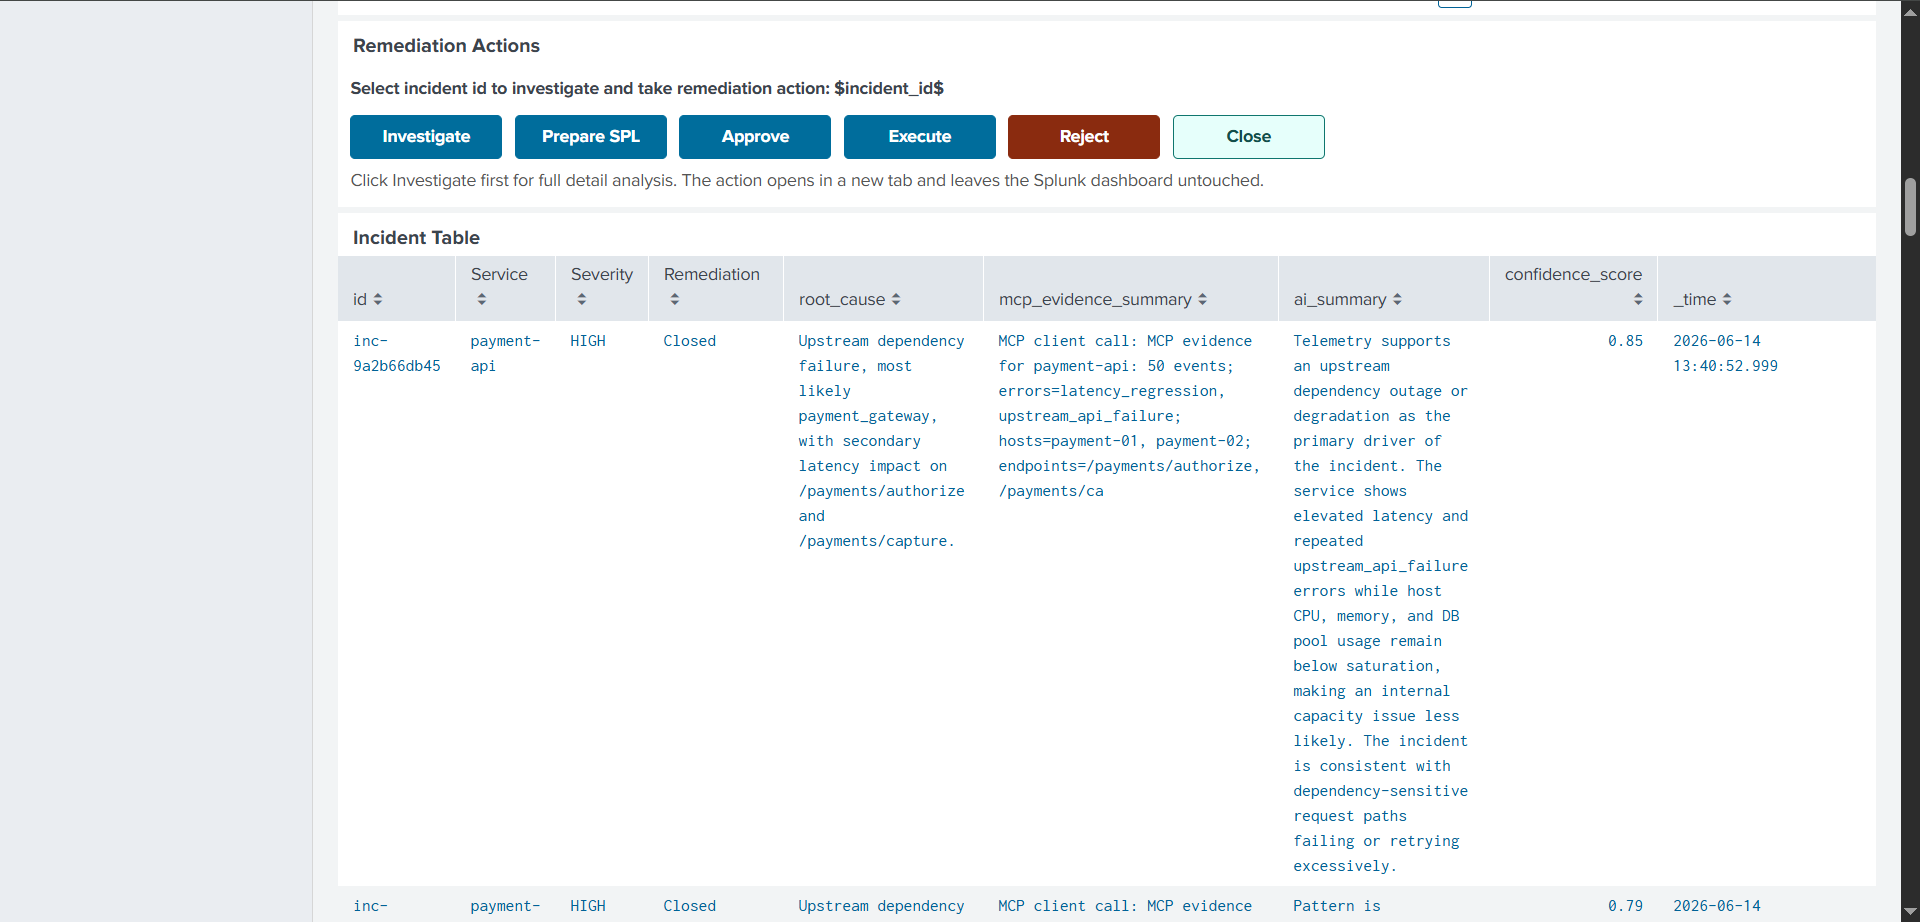
Incident table and HITL Remediation Flow
-
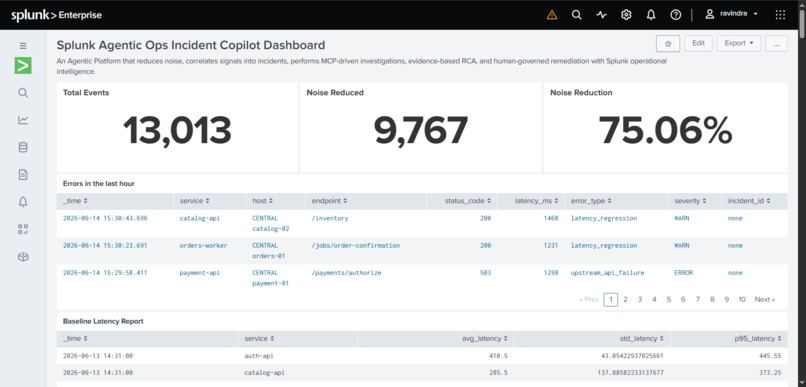
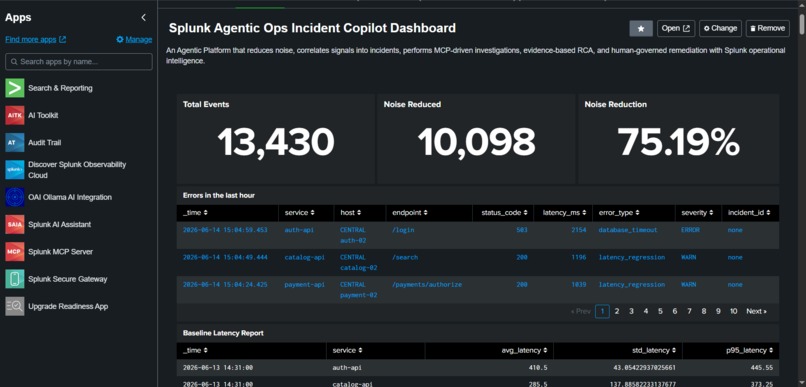
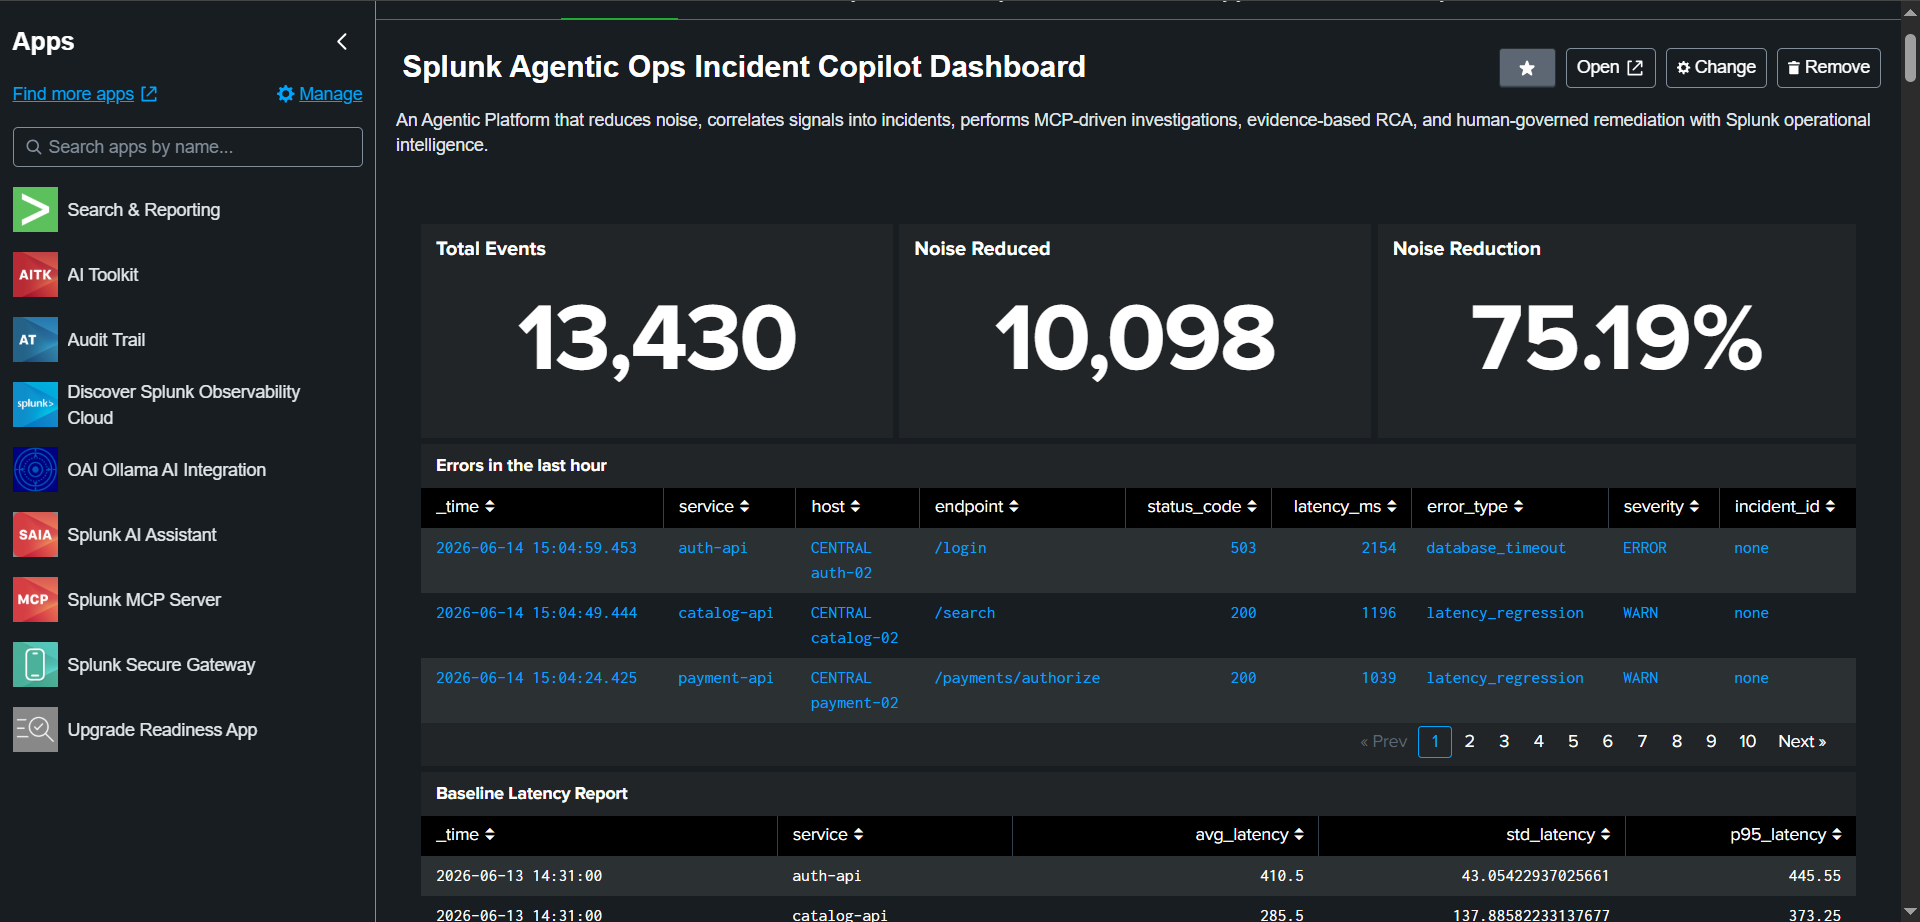
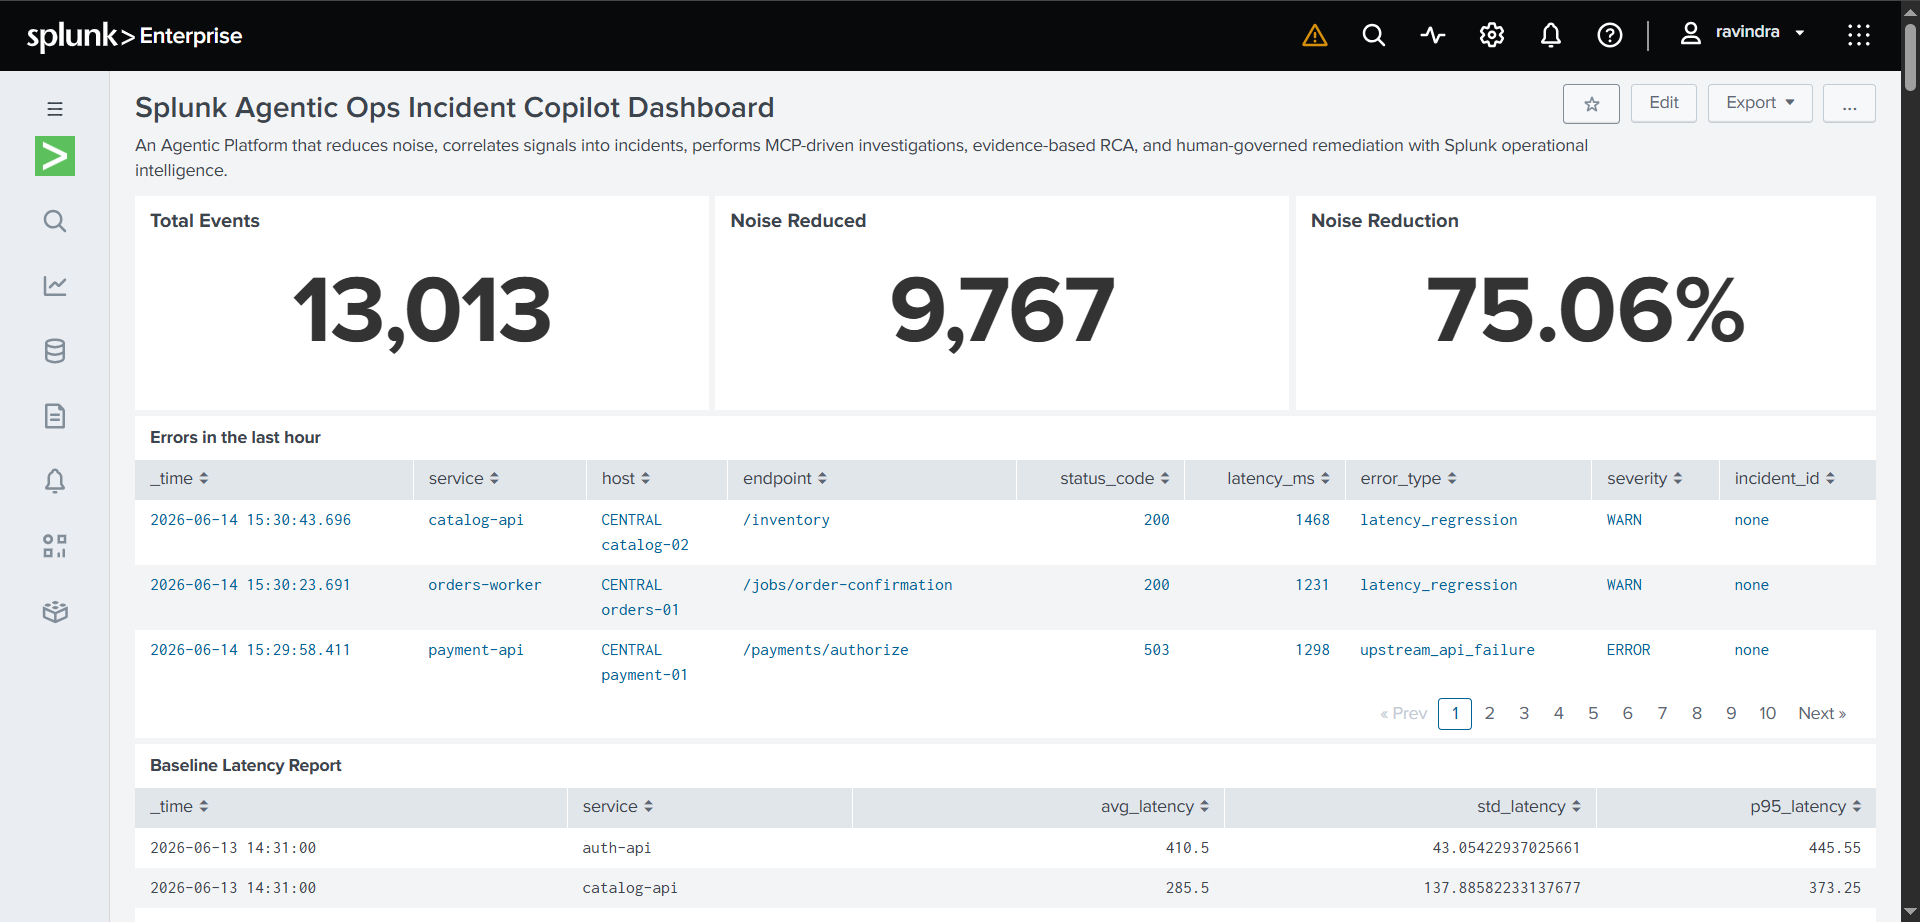
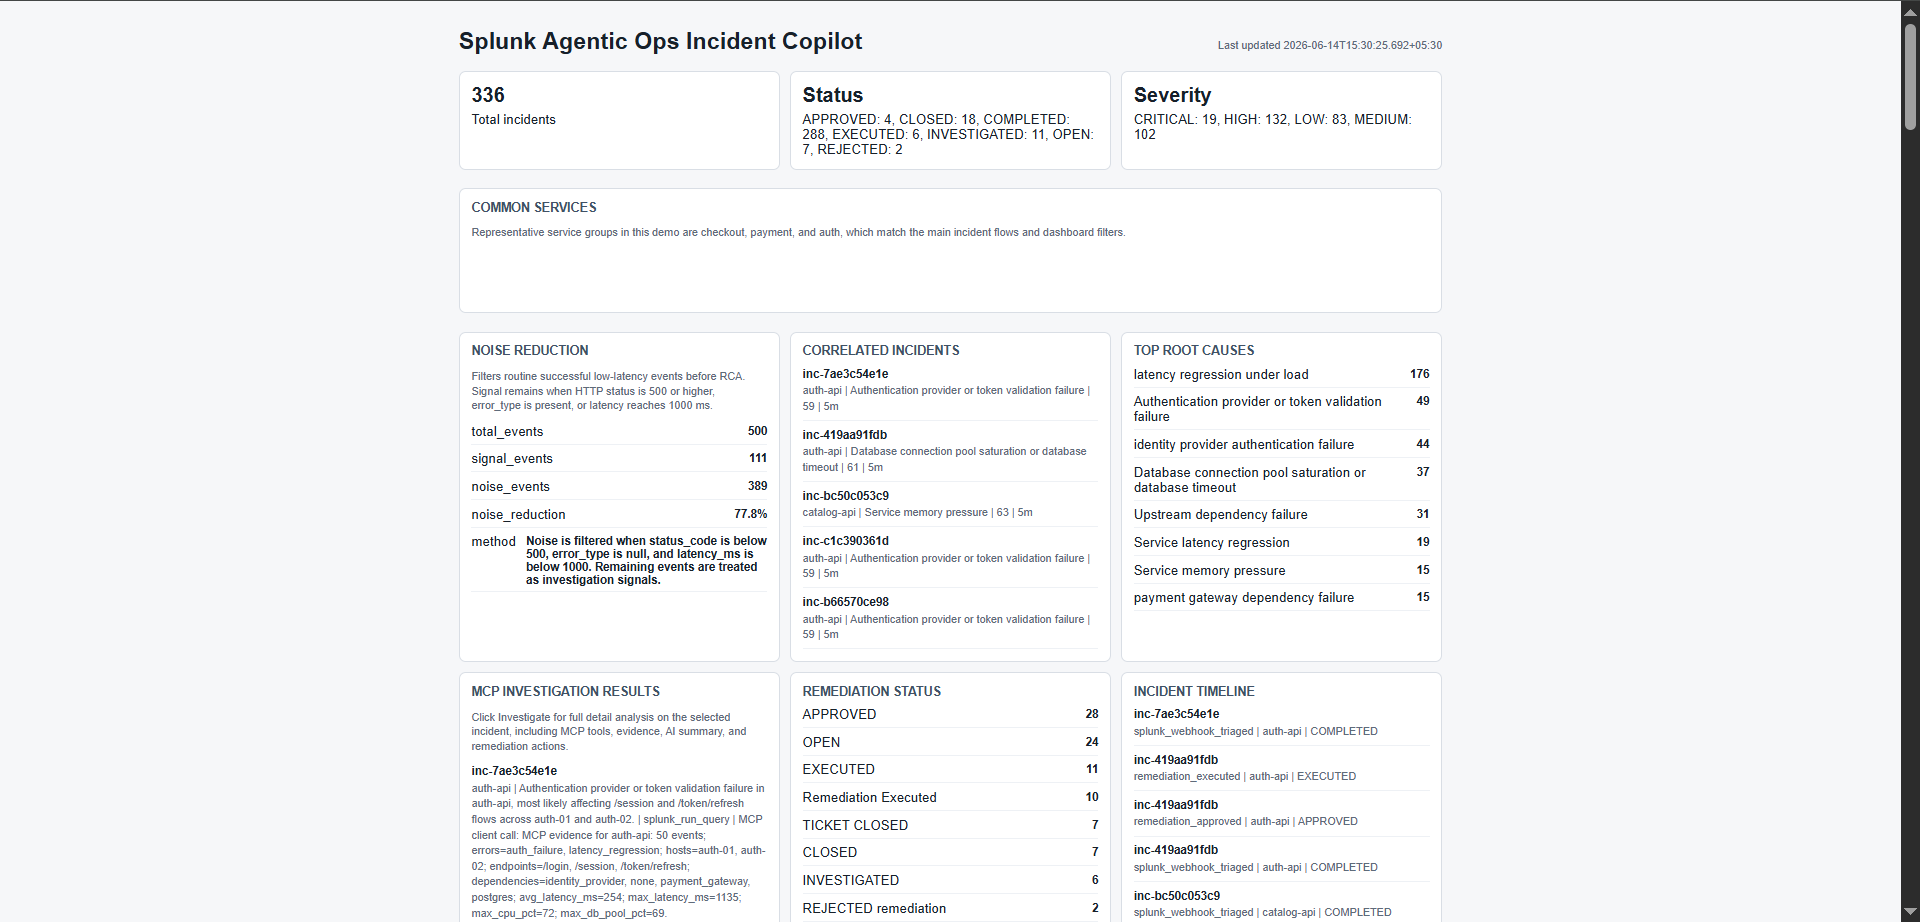
Splunk Agentic Ops Dashboard
-
Fast API Dashboard
-
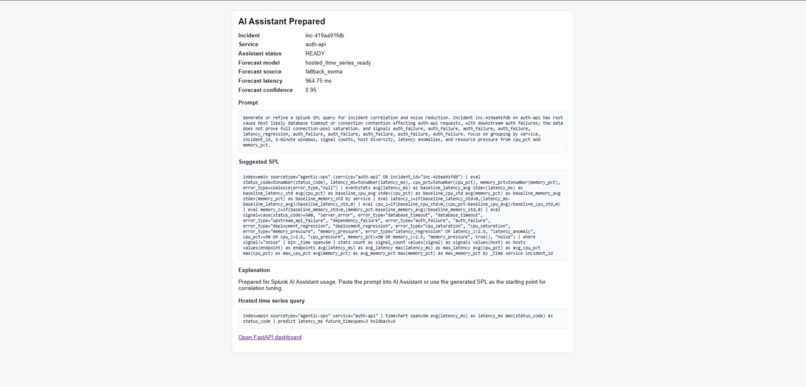
SPL Query Generation on the incident for Analysis in Splunk AI Assistant
-
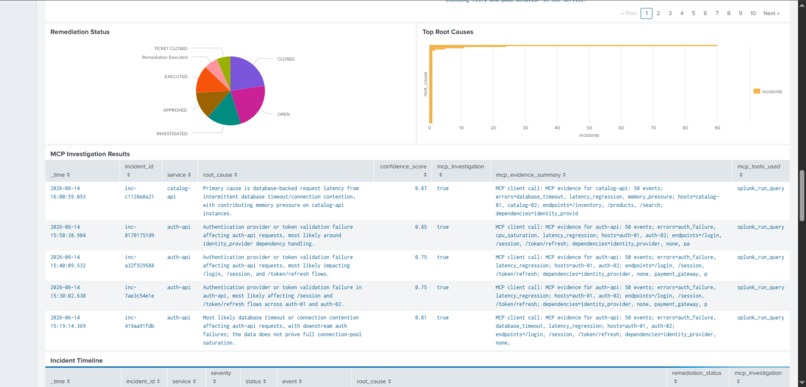
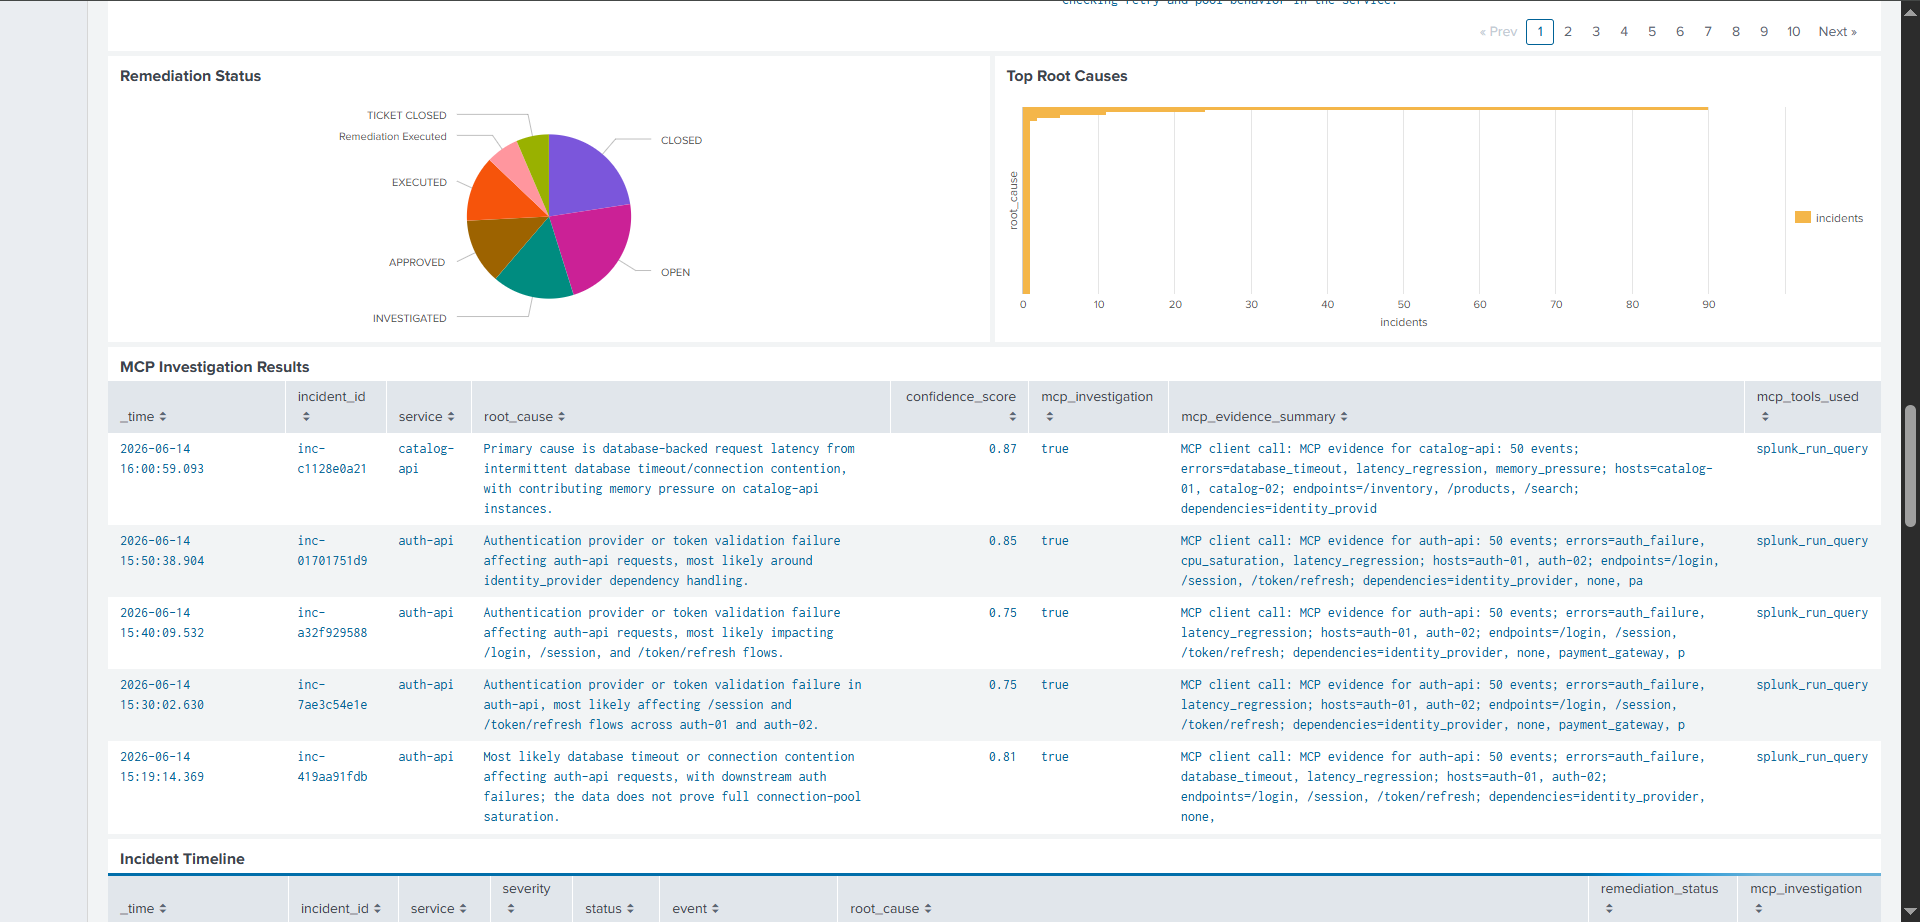
Remediation status and MCP Investigation Panel
-
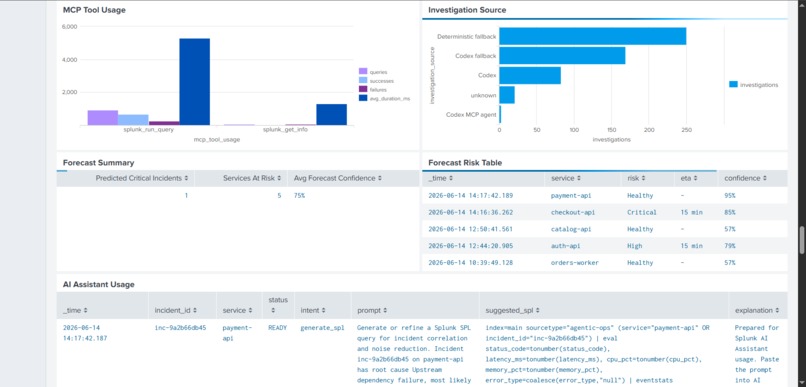
MCP Tool, AI Assitant Usage and Forecast Table
-
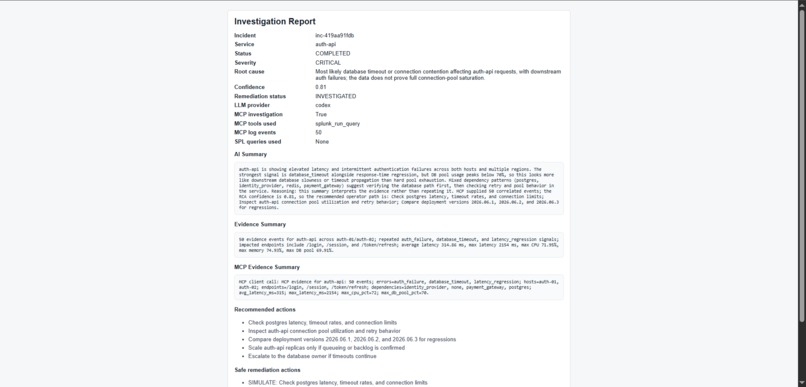
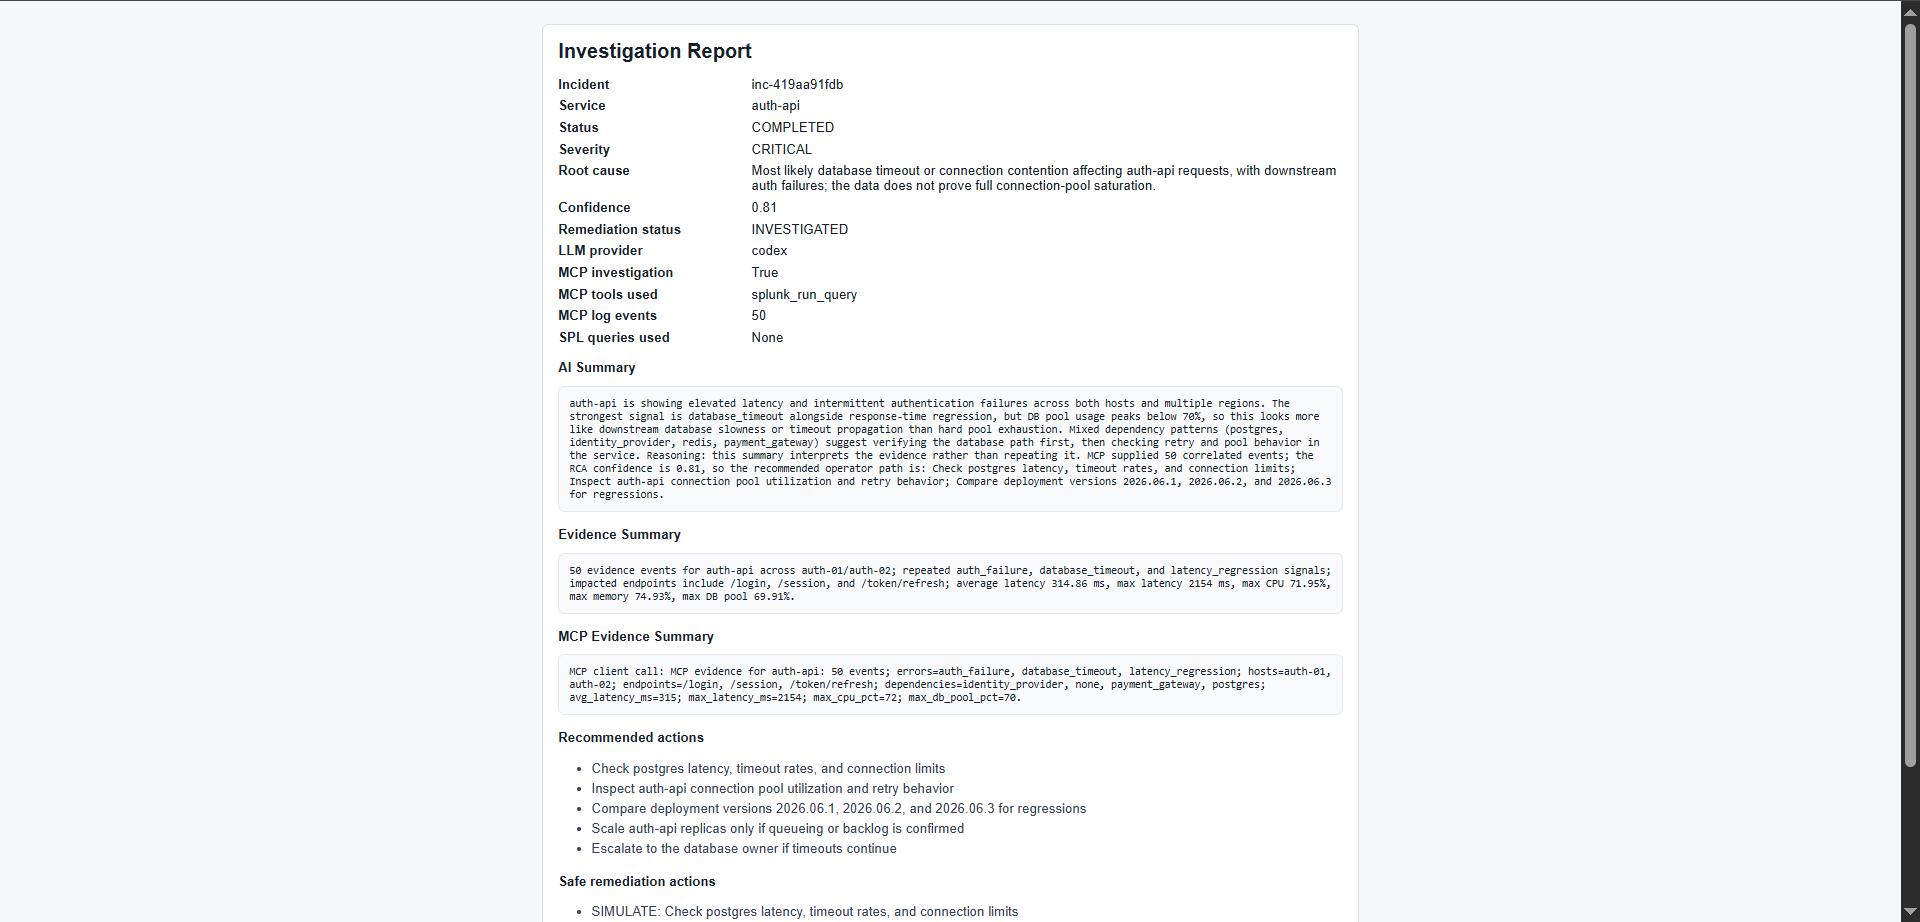
Investigation Report


Splunk Agentic Ops Incident Copilot
Inspiration
Modern operations teams are overwhelmed by telemetry. A single infrastructure issue can produce many logs, alerts, and symptoms across services, which makes it hard to separate noise from the signals that matter.
This project explores a more evidence-driven approach to incident response. Instead of surfacing more raw alerts, it uses Splunk, MCP, FastAPI, Python, and Codex-assisted investigation to help teams move from detection to diagnosis and remediation faster while keeping humans in control of critical decisions.
What It Does
Splunk Agentic Ops Incident Copilot is an AgenticOps platform that turns operational telemetry into incident intelligence.
The workflow is:
- Python generates realistic telemetry and controlled incident bursts.
- Splunk ingests the JSONL logs and computes statistical baselines.
- Noise reduction filters routine events and highlights signals.
- Correlation groups related signals into incident candidates.
- Splunk alerts or dashboard actions can trigger a webhook into FastAPI.
- Python queries Splunk MCP for evidence and metadata.
- Codex can run a second-pass RCA when available.
- The app writes investigation, forecast, timeline, and remediation results back into logs.
- Splunk re-ingests those logs so the dashboard reflects the full incident lifecycle.
Key capabilities:
- Statistical noise reduction before incident generation
- Signal correlation and candidate creation
- MCP-powered evidence collection from Splunk
- AI-assisted RCA with deterministic fallback
- Human-in-the-loop remediation approval
- Incident lifecycle management
- Splunk write-back of investigation and remediation outcomes
- Operational dashboards for visibility and governance
How I Built It
The repo is built around a few clear layers:
app/telemetry.pygenerates normal traffic plus anomalies such as latency regressions, database timeouts, auth failures, CPU saturation, memory pressure, and deployment regressions.app/main.pyexposes the FastAPI endpoints for incident creation, webhook triage, investigation, approval, execution, closeout, and dashboard rendering.app/splunk_mcp_client.pyconnects to the Splunk MCP server and calls tools such assplunk_get_info,splunk_get_indexes,splunk_get_metadata, andsplunk_run_query.app/llm_agent.pybuilds a structured RCA prompt for Codex and normalizes the returned JSON output.app/decision_engine.pyprovides deterministic RCA and safe remediation guidance when AI is unavailable or should not be trusted alone.app/storage.pywrites incident, correlation, remediation, timeline, triage, forecast, and MCP metrics records to JSONL logs.splunk/dashboard_simple.xmlandsplunk/dashboard_panels.spldefine the dashboard experience and the reusable SPL panels.
Architecture
+---------------------------------------------------------------------------------+
|                         DATA GENERATION & INGESTION                             |
|  [telemetry.py] ---> (data/app.log) ---> [Splunk File Monitor] ---> [Splunk]    |
+---------------------------------------------------------------------------------+
                                                                       |
                                                                       v
+---------------------------------------------------------------------------------+
|                         SPLUNK ANALYTICS & VISUALIZATION                       |
|   [Statistical Baselines] -> [Noise Reduction] -> [Correlation & Candidate]     |
+---------------------------------------------------------------------------------+
                                                                       |
         +------------------ (Webhook / Dashboard Action) -------------+
         |
         v
+---------------------------------------------------------------------------------+
|                          FASTAPI ORCHESTRATION & AGENTIC PLANE                  |
|                      +---> [splunk_mcp_client.py] ---> (Splunk MCP Server)      |
|  [main.py] (FastAPI) |                                                          |
|                      +---> [decision_engine.py] (Deterministic RCA Fallback)    |
|                      +---> [llm_agent.py] ------> (Codex LLM Engine)            |
+---------------------------------------------------------------------------------+
         |
         v
+---------------------------------------------------------------------------------+
|                            LOG STORAGE & WRITEBACK                              |
|  (data/incidents.json) & [Splunk HEC Writeback] ---> [Splunk Dashboard Refresh] |
+---------------------------------------------------------------------------------+
The Agentic Investigation & RCA Architecture
[ FastAPI Webhook Triggered ]
                               |
                               v
               [ Step 1: Splunk MCP Discovery ]
         Query metadata, indexes, and surrounding context
                               |
                               v
               +---------------+---------------+
               |                               |
               v                               v
    [ Track A: Codex Agent ]      [ Track B: Deterministic Engine ]
    Build structured JSON prompt   Evaluate hardcoded rules & bounds
               |                               |
               +---------------+---------------+
                               |
                               v
               [ Step 3: Synthesis & Merge ]
         Fallback applied if Codex fails or deviates
State Machine & Human-In-The-Loop (HITL) Workflow
[ Open ] ---> [ Triage / Investigating ] ---> [ Pending Approval ]
                                                       |
                        +------------------------------+
                        |                              |
                        v                              v
               [ Executing Action ]             [ Rejected / Closed ]
                        |
                        v
                 [ Post-Closeout ]
Data Flow Between Components
Python to Splunk
Python writes telemetry and workflow records to disk. Splunk file inputs monitor those JSONL files and parse them into searchable events.
Splunk to Python
Splunk can hand off to FastAPI in two ways:
- Dashboard action links call the API endpoints directly.
- A saved correlation alert can POST a webhook payload to
/webhook/splunk-alert.
The webhook handler accepts both top-level fields and nested result fields, including:
search_name,alert_name, ornamehostserviceincident_idorsidseveritytrigger_time,triggered_time, ortime
MCP and Codex
The app uses Splunk MCP as the evidence layer. The MCP client is responsible for:
- startup verification with
splunk_get_info - index discovery with
splunk_get_indexes - metadata discovery with
splunk_get_metadata - evidence collection with
splunk_run_query - MCP tool metrics writeback into
data/mcp_metrics.log
The Codex RCA agent:
- builds a structured JSON prompt from incident context, evidence, and raw events
- asks Codex to return only JSON
- normalizes severity, confidence, root cause, and action recommendations
- falls back to deterministic RCA if the CLI is unavailable or the output is invalid
Statistical Analysis and Correlation
Splunk computes latency baselines and z-scores to separate noise from meaningful signals.
Correlation groups events into 5-minute windows and scores them using:
- signal count
- unique signal types
- host diversity
- endpoint diversity
- latency spikes and z-scores
- CPU and memory pressure
- repeated failures on the same incident id
This produces a candidate incident severity that appears in the dashboard and can trigger the webhook flow.
Alert Triggering Through Webhook
When a Splunk alert fires, the webhook path hydrates or creates the incident record, gathers surrounding evidence through Splunk MCP, runs deterministic RCA, optionally enhances the result with Codex, and writes the result back to the local logs and, when configured, to Splunk via HEC.
HEC Writeback
HEC is used to write the AI triage summary back into Splunk as a dedicated event stream.
If SPLUNK_HEC_URL and SPLUNK_HEC_TOKEN are configured, the app posts a triage event containing:
- incident metadata
- severity
- confidence score
- AI summary
- root cause summary
- MCP evidence summary
- alert payload
- writeback status
If HEC is unavailable or fails, triage still completes and the dashboard still reflects the incident.
Dashboard Features in Splunk
The dashboard is backed by splunk/dashboard_simple.xml and splunk/dashboard_panels.spl.
It shows:
- total events and noise reduction
- latency baseline reporting
- errors in the last hour
- correlated incidents
- incident candidate scoring
- incident table with drill-down
- selected incident AI summary
- MCP investigation results
- remediation status and lifecycle
- incident timeline
- MCP tool usage
- investigation source
- AI assistant usage
- forecast summary and forecast risk tables
The dashboard also exposes the remediation workflow:
- Investigate
- Approve
- Execute
- Reject
- Close
Challenges I Ran Into
One of the hardest parts was keeping the workflow evidence-driven instead of turning it into a black-box AI demo.
Key challenges:
- Integrating Splunk MCP Server with Codex due to the mismatch of Splunk JSON based config input with codex toml config setup.
- Activating Splunk AI Assistant due to token mismatch.
- Building statistical noise reduction without hiding important signals
- Splunk Search lag to trigger alert for the incident with the webhook.
- Converting raw telemetry into incident candidates
- Integrating Splunk MCP investigation workflows cleanly
- Designing explainable RCA generation
- Creating a safe human-in-the-loop remediation process
- Keeping traceability between evidence, RCA, approvals, and remediation actions
- Making the dashboard in SPLUNK in xmL to reflect multiple stages of the incident lifecycle which needs more exploration of feature available in SPLUNK dashboard.
Another challenge was balancing automation with operational safety. The system can accelerate investigation, but remediation decisions still remain under human control.
Accomplishments
I built an end-to-end AgenticOps workflow that combines observability, AI-assisted investigation, and operational governance.
Highlights:
- Statistical noise reduction before incident creation
- Correlation-based incident candidate generation
- MCP-powered evidence collection
- Codex-assisted RCA with deterministic fallback
- Human-governed remediation lifecycle
- Incident state management from open to closed
- Splunk write-back architecture
- Operational intelligence dashboards
- Forecast-ready architecture for future predictive capabilities
Most importantly, the project shows how AI can augment operations teams without removing human oversight from critical operational decisions.

Log in or sign up for Devpost to join the conversation.