
Inspiration
Two things were obvious to anyone who's been on call.
First, modern observability has a noise problem. A crash-looping service can flood your ingest pipe with identical stack traces faster than anyone can react, blowing through your Splunk budget while the incident itself is still unfixed.
Second, teams forget what fixed things. The engineer who found and solved the database pool exhaustion six months ago has moved teams. The incident report (if there is one) is buried in Confluence. Nobody reads it at 2 a.m. The next on-call solves the same problem from scratch, and the cycle repeats.
Splunk's own buyer's guide is direct about this: "When a new incident occurs, teams shouldn't have to start from scratch. A strong observability solution surfaces similar past incidents, shows how they were resolved, and highlights what worked." That's exactly what Aegis does - and nobody had shipped it inside the Splunk ecosystem.
What it does
Four pillars, all inside a single Rust daemon (~5,000 lines of code, no external services, free SQLite for storage):
Noise gate (already shipped). Hashes structural log signatures and collapses repeats into one metric event per window. The first occurrence is always forwarded raw so the operator never loses incident context. ~99.96% ingest reduction on a crash loop, math in
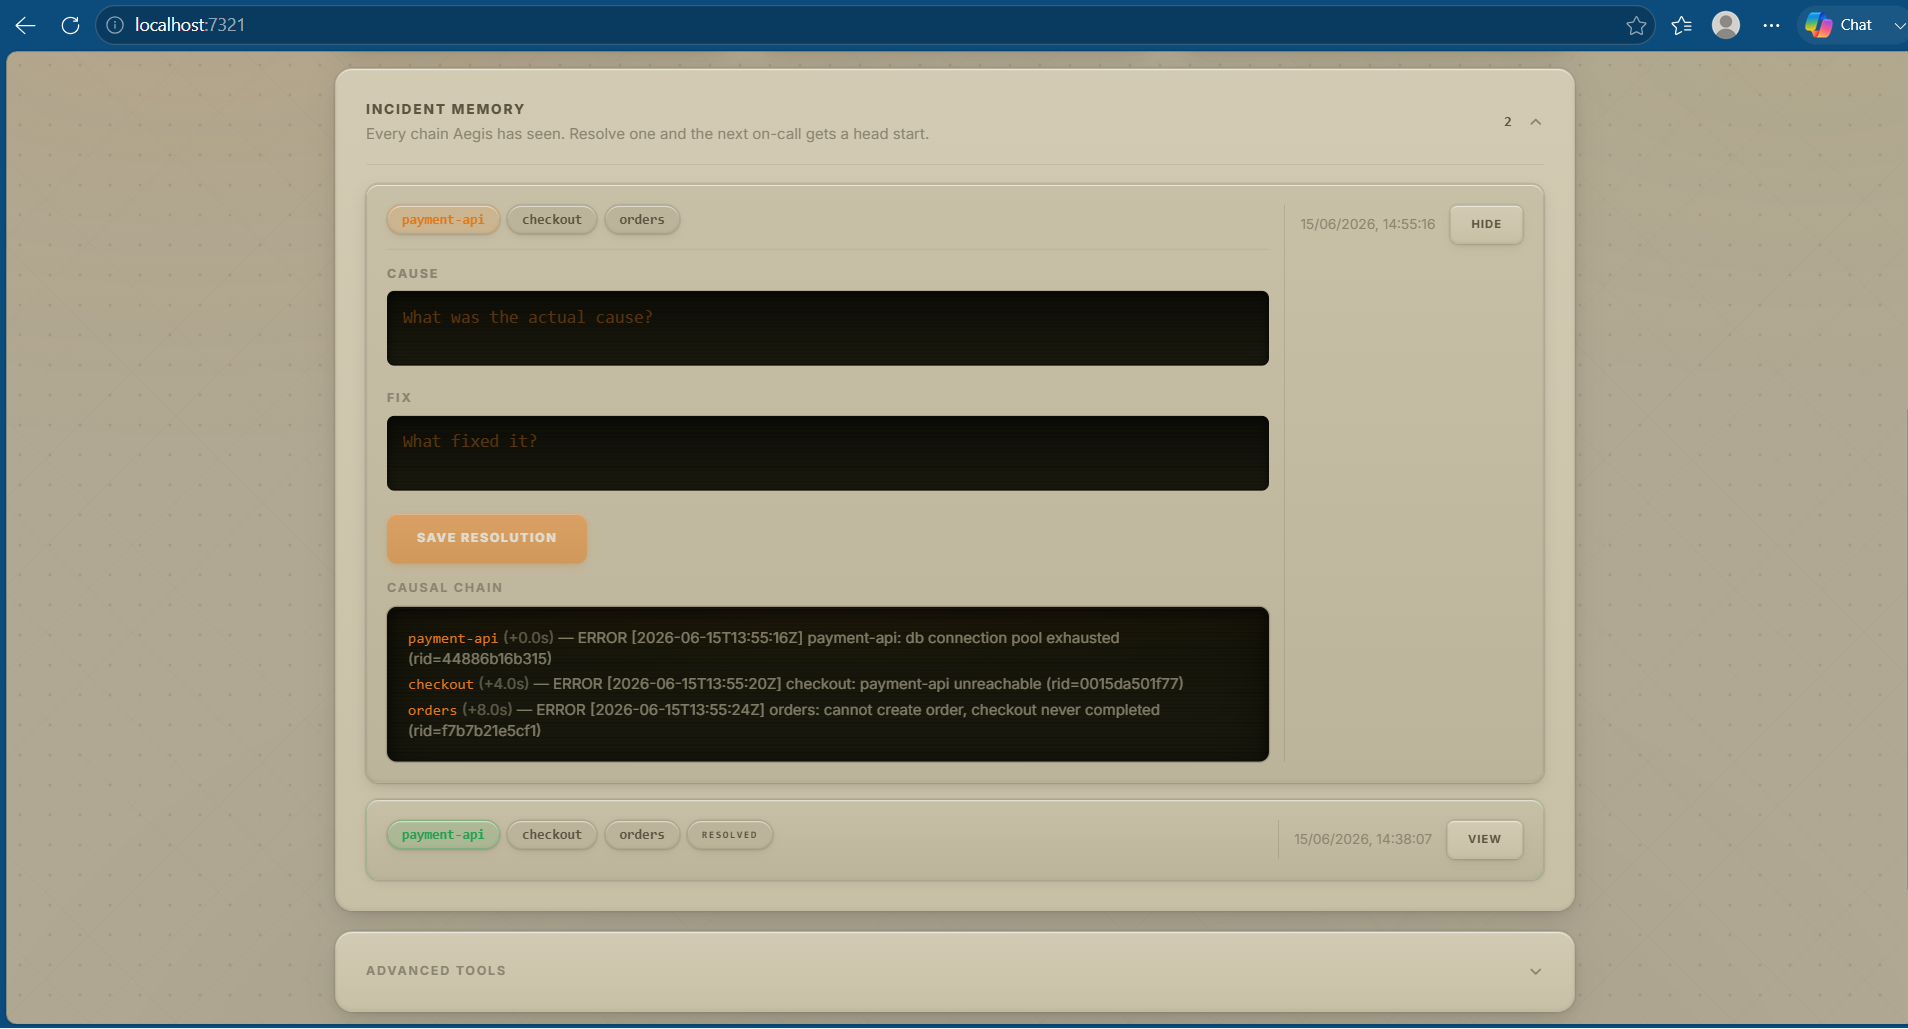
docs/finops-math.md.Causal chain (new). When ≥ N services first-fire new signatures inside a window, Aegis identifies the one that broke earliest as the probable root cause. Output is one sentence - "payment-api broke first. checkout followed 4s later. orders followed 8s later. Root cause: payment-api." - not 200 alerts.
Incident memory (new). Every chain is fingerprinted (service set, signature set, ordered chain, root cause) and written to a small local SQLite store. When the engineer fills in a two-line resolution card (what was the cause? what fixed it?), that text is attached to the fingerprint. Next time a similar chain happens, Aegis surfaces the past cause + fix on the new decision card. Similarity search is local, deterministic, sub-millisecond at 10,000 incidents - no embedding model, no vector DB.
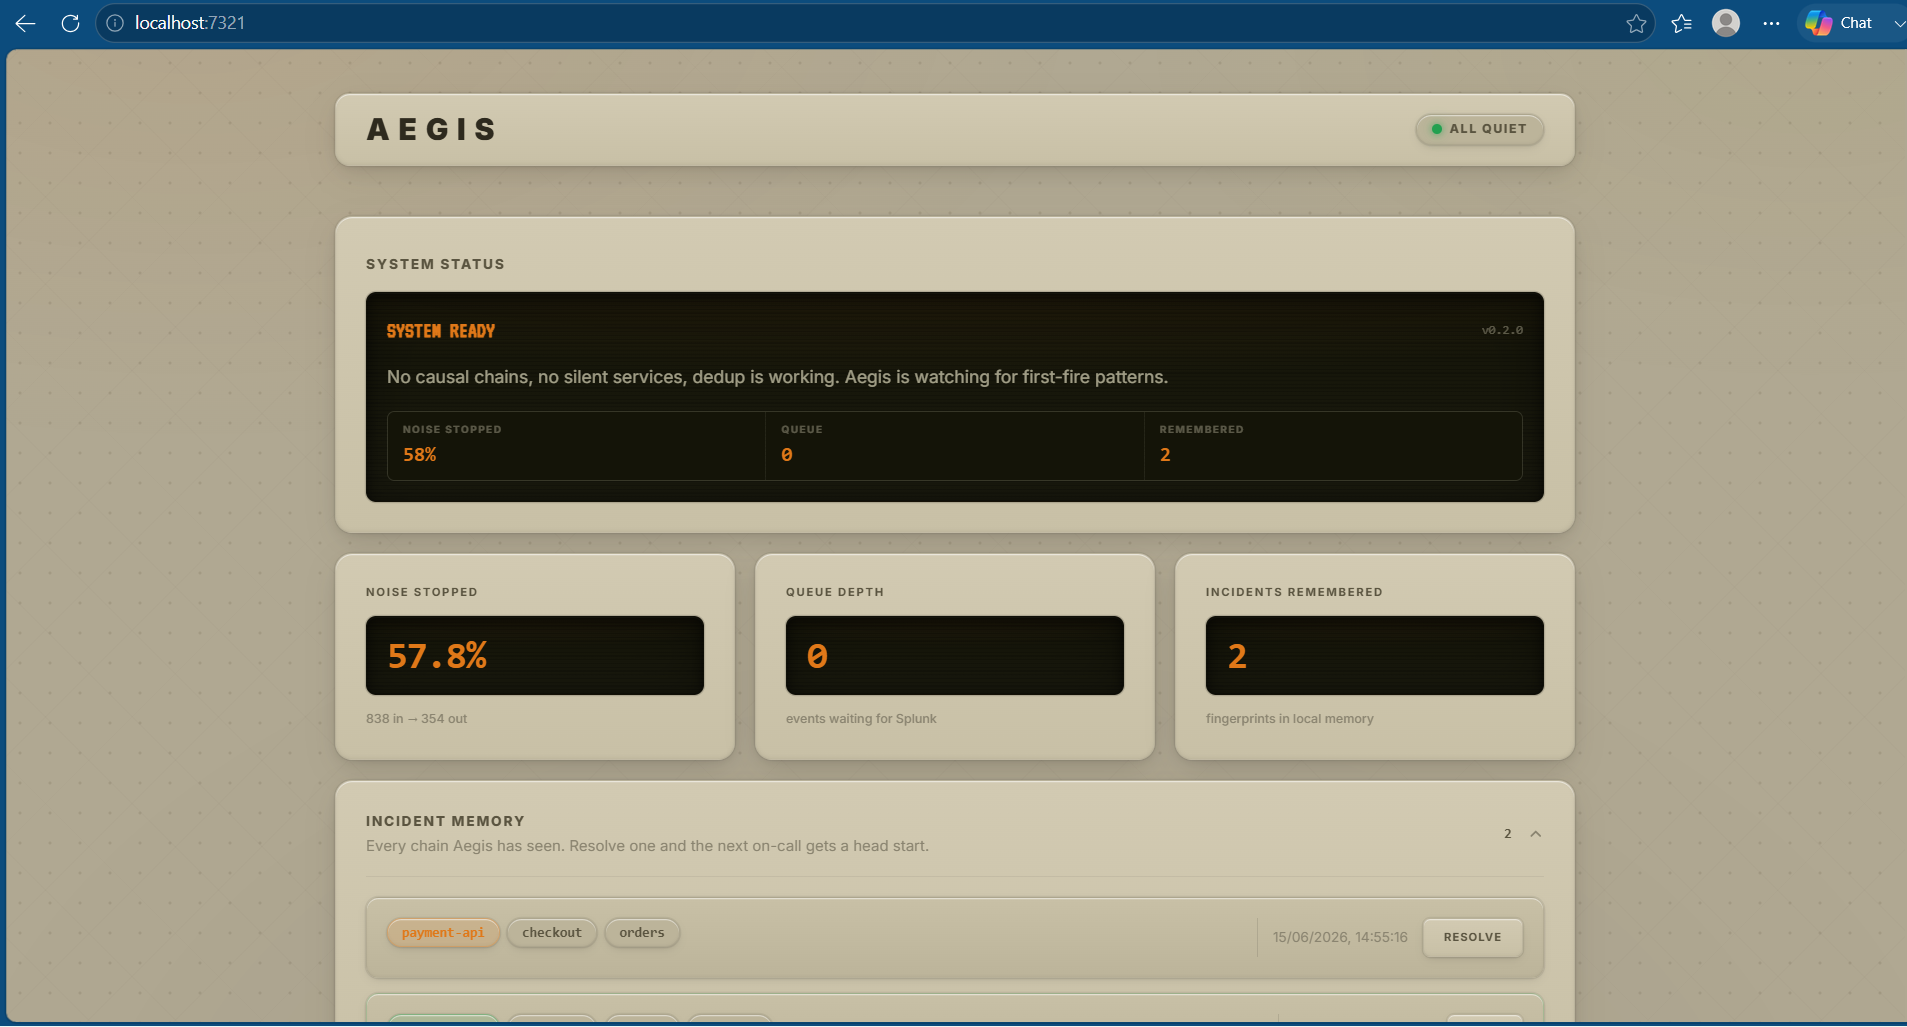
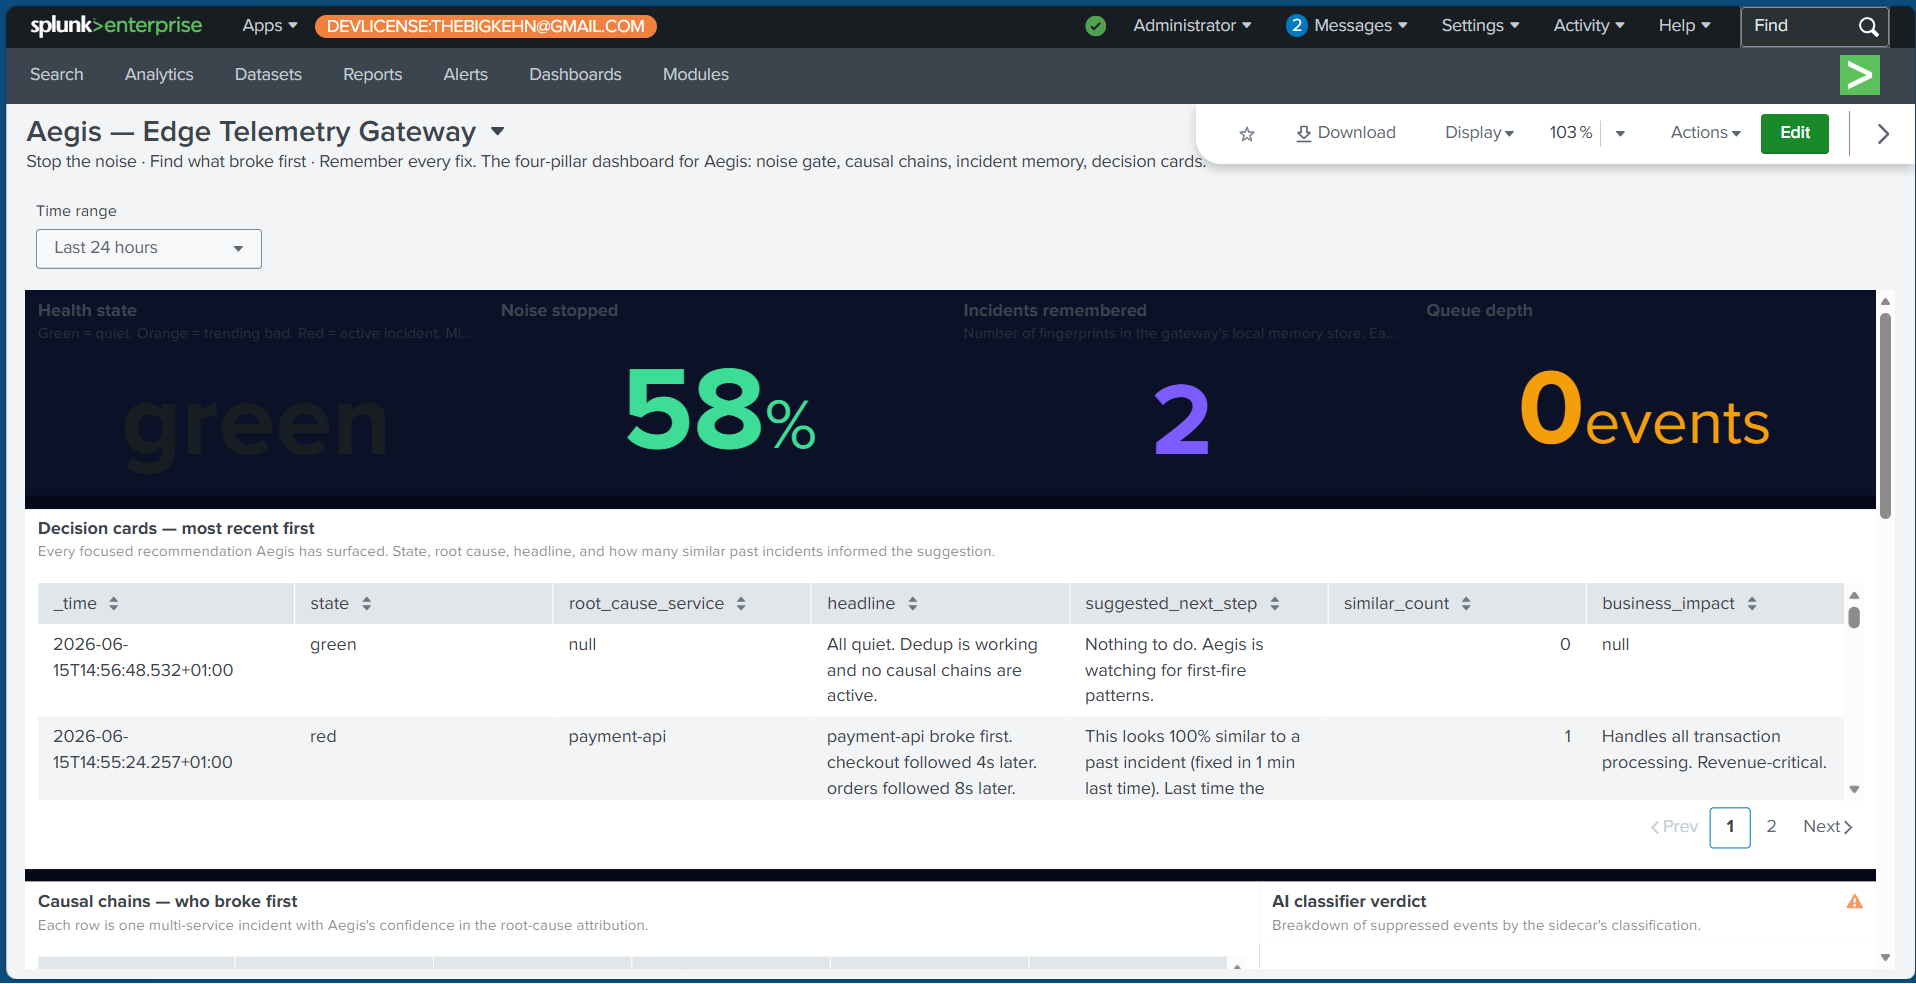
Decision card (new). Replaces the "Execute" button. The engineer sees one focused card with root cause, similar past fix, business impact, and a single concrete next step. Three buttons -
I'm on it,Show me more past incidents,This looks different- never reach into production. The card lives in the UI, the Splunk dashboard, the MCPlatest_decisiontool, andGET /api/decision.
Plus a silent-service detector for services that go quiet, and a green/orange/red state machine surfaced on every gateway snapshot.
How i built it
- Rust workspace (Cargo, edition 2021):
aegis-core(data plane, causal chain, incident memory, decision engine),aegis-mcp(MCP server + REST API),aegis-daemon(binary). rmcp1.7 streamable-HTTP MCP server over axum 0.8. rusqlite 0.32 with bundled SQLite for both the priority queue and the incident memory store. blake3 for structural hashing.- Python AI sidecar (FastAPI + uvicorn) for embedding-distance log classification - optional; gateway works without it. Falls back to keyword heuristics when sentence-transformers isn't installed.
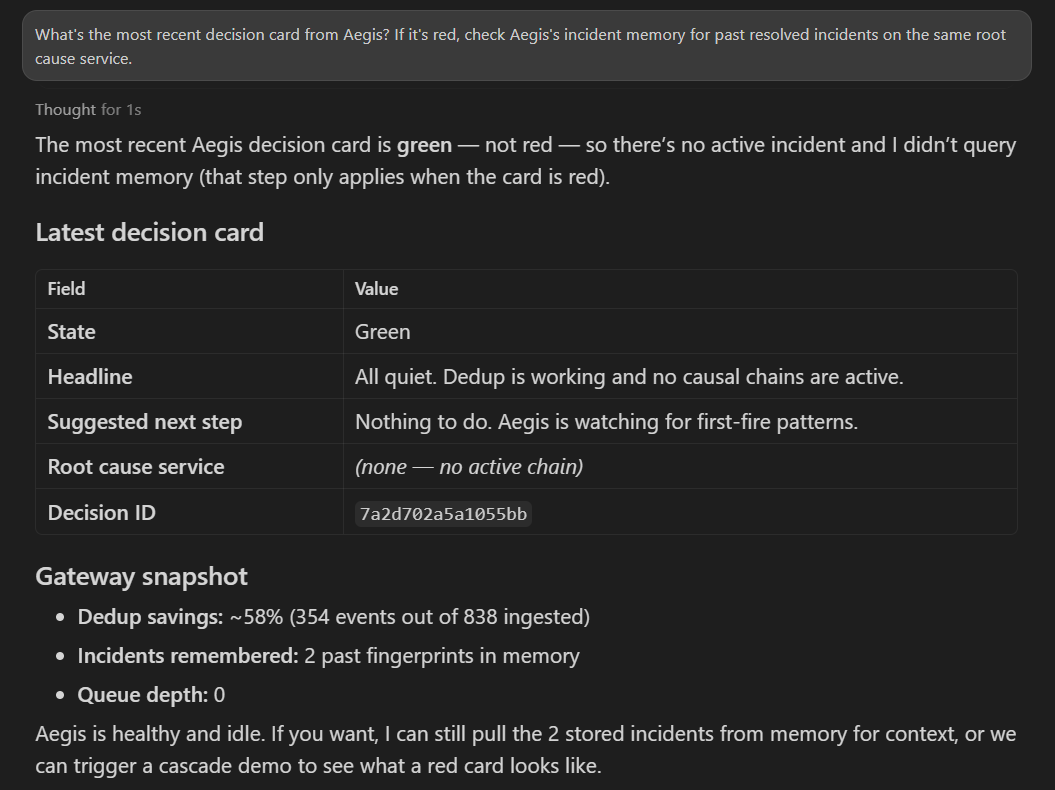
- AegisOps autonomous agent (Typer + Pydantic v2): observes the
gateway over REST, reads the gateway's own decision card directly
(
/api/decision), forwards it to the LLM as anINCIDENT CARDblock so the model doesn't re-derive what the gateway already knows. Three LLM transports: raw Ollama, AITK-routed Ollama, true Splunk Hosted Models - one config flag switches. apps/aegis_ai/- Splunkbase-shaped app usingsplunklib.ai.OpenAIModel(base_url=…). AppInspect: 0 failures.- Splunk Dashboard Studio with a per-pillar panel layout. CDTSM forecast panels are wired and activate when pointed at a Cloud stack with SLIM provisioned.
- React 19 + Vite 7 + Tailwind v4 control panel. The decision card is the hero on the page; everything else is below the fold.
Challenges
Causal attribution without a static service map. We don't want operators to write a service-graph YAML by hand. The solution is to extract a service tag from each line at ingest time (JSON
servicefield,LEVEL service:prefix,svc=key-value, bracket prefix) and propagate it across continuation lines (stack frames,caused by:) by tracking per-source last-known-service. The earliest first-fire across services is the root cause.Similarity search without infrastructure. We didn't want an embedding model or a vector DB just to recall past incidents. Jaccard similarity on signature sets, Jaccard on service sets, and LCS ratio on chain order - combined with a weight per axis - gives a fast, deterministic score that operators can reason about and tune. The whole search loop is
SELECT * FROM incidents LIMIT 2048- a Rust-side scan. Sub-millisecond at production scale.
One process, three planes, zero IPC. The data plane, the MCP control plane, and the REST API all run inside
aegis-daemonsharing a singleArc<Control>+Arc<Queue>+Arc<IncidentStore>. An external MCP client (Cursor, Claude Desktop) callingaegis.override(seconds=30)mutates the very same control surface the data plane reads on its hot path. No shimming, no second database.AppInspect quirks on Windows. PowerShell's
Compress-Archivewrites zip entries with backslash separators, which the Splunk-appinspect tool can't extract. Switched to a Pythontarfilescript with explicit forward-slash arcnames - clean run.
Accomplishments that i'm proud of
97 tests across two languages, all passing. 38 Rust unit tests cover the data plane end-to-end — noise gate, causal chain, incident memory, decision engine, similarity search, and the MCP tool surface. 59 Python tests cover the AegisOps agent, the Splunk MCP client, transport switching, and the AI sidecar. Every merge was gated on
cargo test --workspace+pytest.One
docker compose up --buildand everything works. The gateway, the React control panel, and a self-driving workload all run inside a single container. A judge can go fromgit cloneto a red-state decision card with a fully-attributed causal chain in under two minutes — no Splunk, no API keys, no configuration.Bidirectional MCP — server and client in the same project. Aegis hosts its own MCP server (8 tools over streamable HTTP via
rmcp1.7 + axum 0.8) and our AegisOps agent is a real MCP client of the official Splunk MCP Server. Both endpoints can be wired into a single Cursor or Claude Desktop session, giving the LLM tools from both servers in one conversation. We haven't seen another hackathon entry do both directions.Similarity search with zero infrastructure. No embedding model, no vector database, no external service. Jaccard similarity on signature sets, Jaccard on service sets, and LCS ratio on chain order — combined with tunable weights — gives a fast, deterministic score that operators can reason about. The entire search loop is a single SQLite query plus a Rust-side scan: sub-millisecond at 10,000 incidents.
99.96% ingest reduction, with math to back it up. The noise gate collapses a crash-looping service's 5.76 GB/day of identical stack traces down to ~2.6 MB/day — and the first occurrence is always forwarded raw so operators never lose incident context. The FinOps math is worked through in
docs/finops-math.mdwith concrete dollar figures.AppInspect: zero failures. The Splunk app (
apps/aegis_ai/) passessplunk-appinspect inspectwith 0 failures — ready for Splunkbase submission. Getting there on Windows required switching from PowerShell'sCompress-Archive(which writes backslash zip entries) to a Pythontarfilescript with explicit forward-slash arcnames.~5,500 lines of Rust, ~2,900 lines of Python, ~1,900 lines of React/TypeScript/CSS — all written in a hackathon window. The Rust gateway is the hot path (async tokio, zero-copy where possible, release profile with LTO). The Python layer handles the AI/agent concerns. The React control panel puts the decision card front and centre with a polished, LCD-styled UI that makes the demo land.
The decision card keeps humans in control. No "Execute" button anywhere in the product. The engineer reads the card, clicks one of three buttons (
I'm on it,Show me more,This looks different), and none of them reach into production. The card is the same object whether you see it in the UI, the Splunk dashboard, or the MCPlatest_decisiontool — one source of truth.
What i learned
- Incident memory is something Splunk's own docs ask for and nobody ships. Pulling that quote out of the Buyer's Guide and building the feature inside the Splunk ecosystem turned out to be the highest- leverage move in the project.
- The default Ollama model name should match the Splunk Hosted Models
identifier.
gpt-oss:20blocally →gpt-oss-20bon SLIM. One env var difference. The same Splunk app code path works against both, so the "when SLIM lands you flip a flag" story is real, not aspirational. - CDTSM is a foundation time-series model. No
| fitstep, just| apply CDTSM <field> forecast_k=N. Wiring it both into the dashboard and into the agent reasoner was a one-day win.
What's next
- Orange state from CDTSM trends. The decision-card state machine
has the
Orangevariant today; the green→orange transition based on CDTSM forecasts crossing a threshold is the next iteration. - Real
replay_raw. Add a separate history table with a configurable TTL so the MCP tool can re-emit buffered raw events. - OAuth on the MCP HTTP transport for production deployments that cross network boundaries.
- OpenTelemetry ingest path alongside TCP / UDP so the gateway slots in next to existing OTel Collectors.

Log in or sign up for Devpost to join the conversation.