-
-
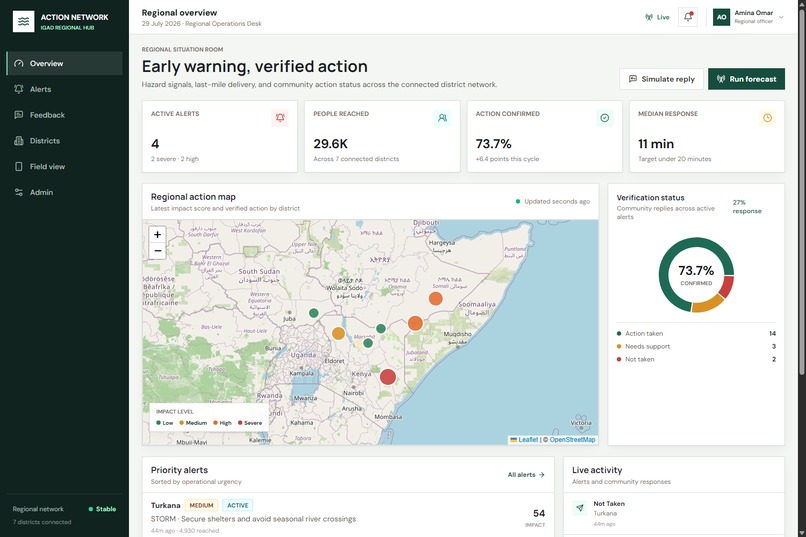
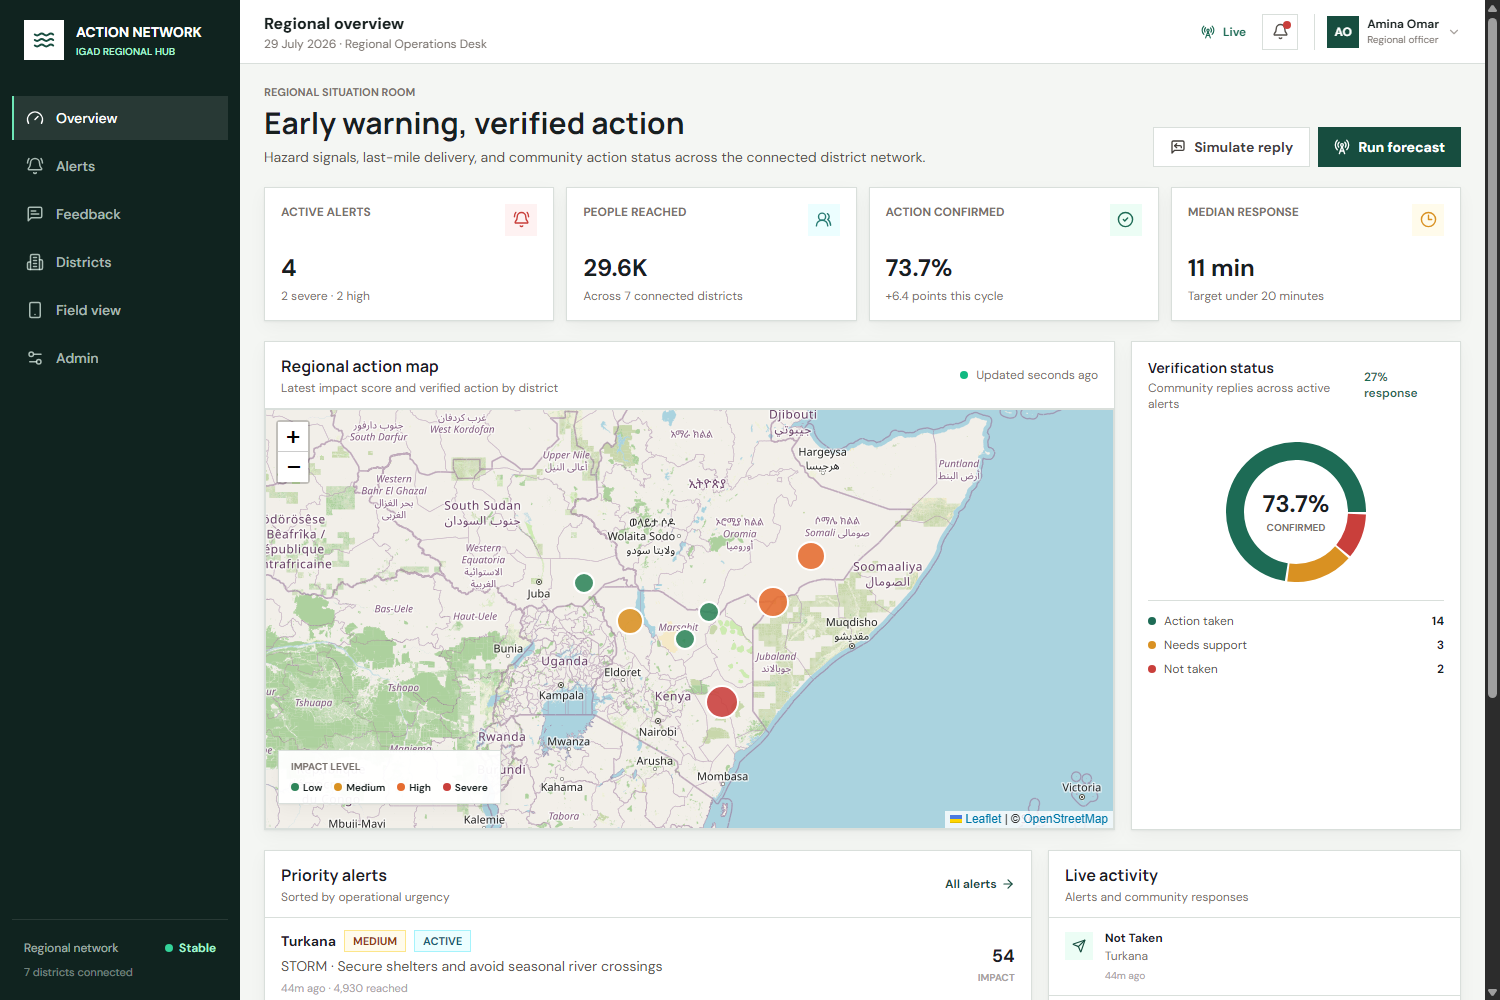
Verified Early Action Network
-
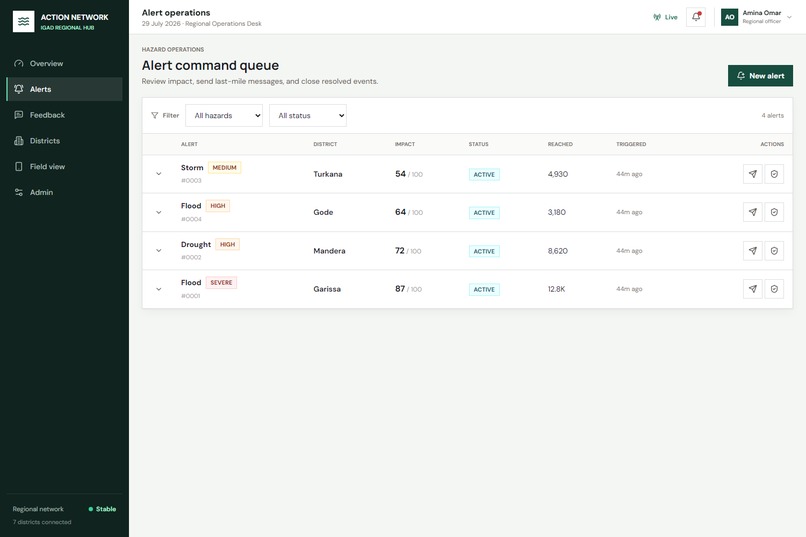
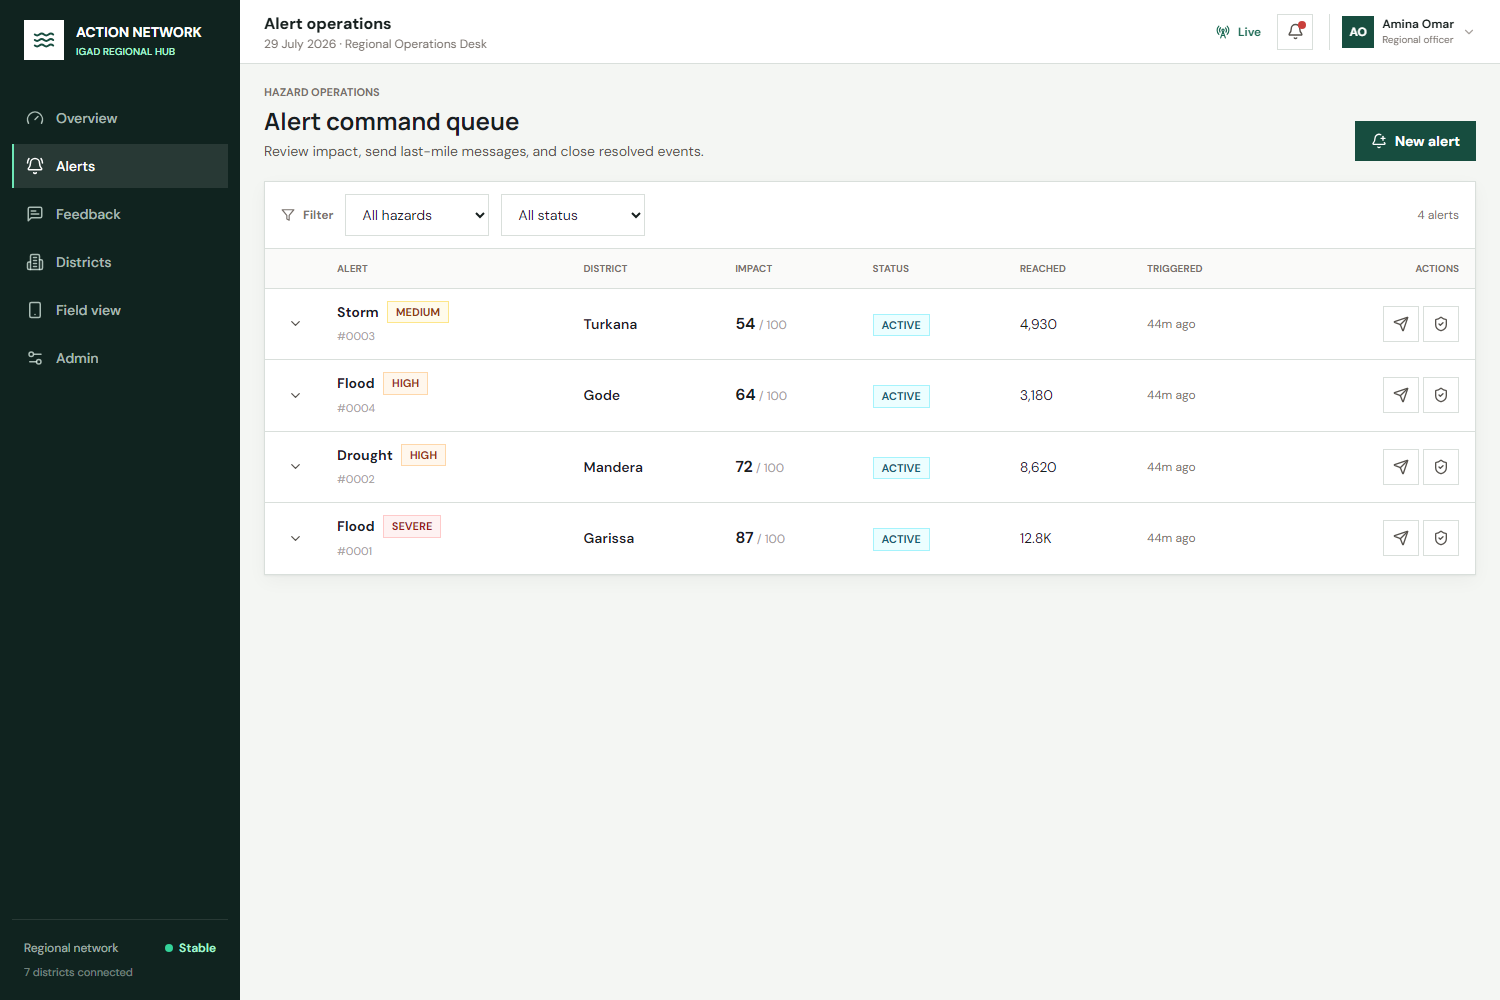
Hazard Command Queue
-
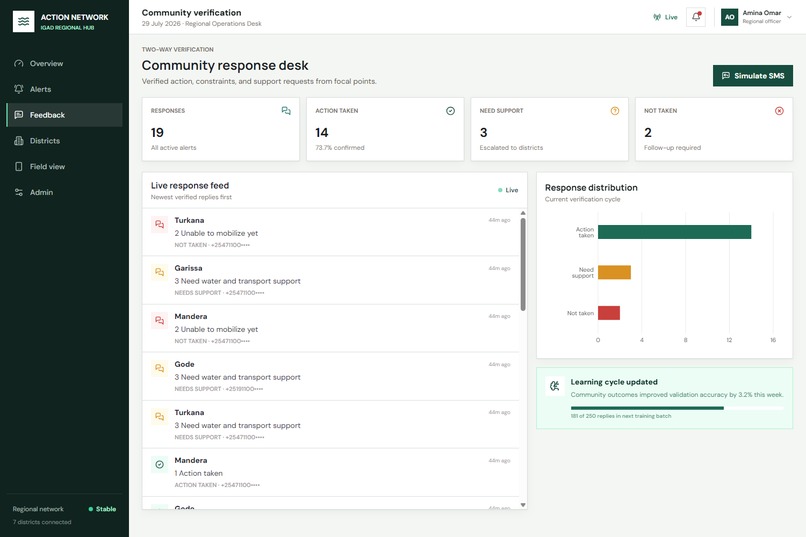
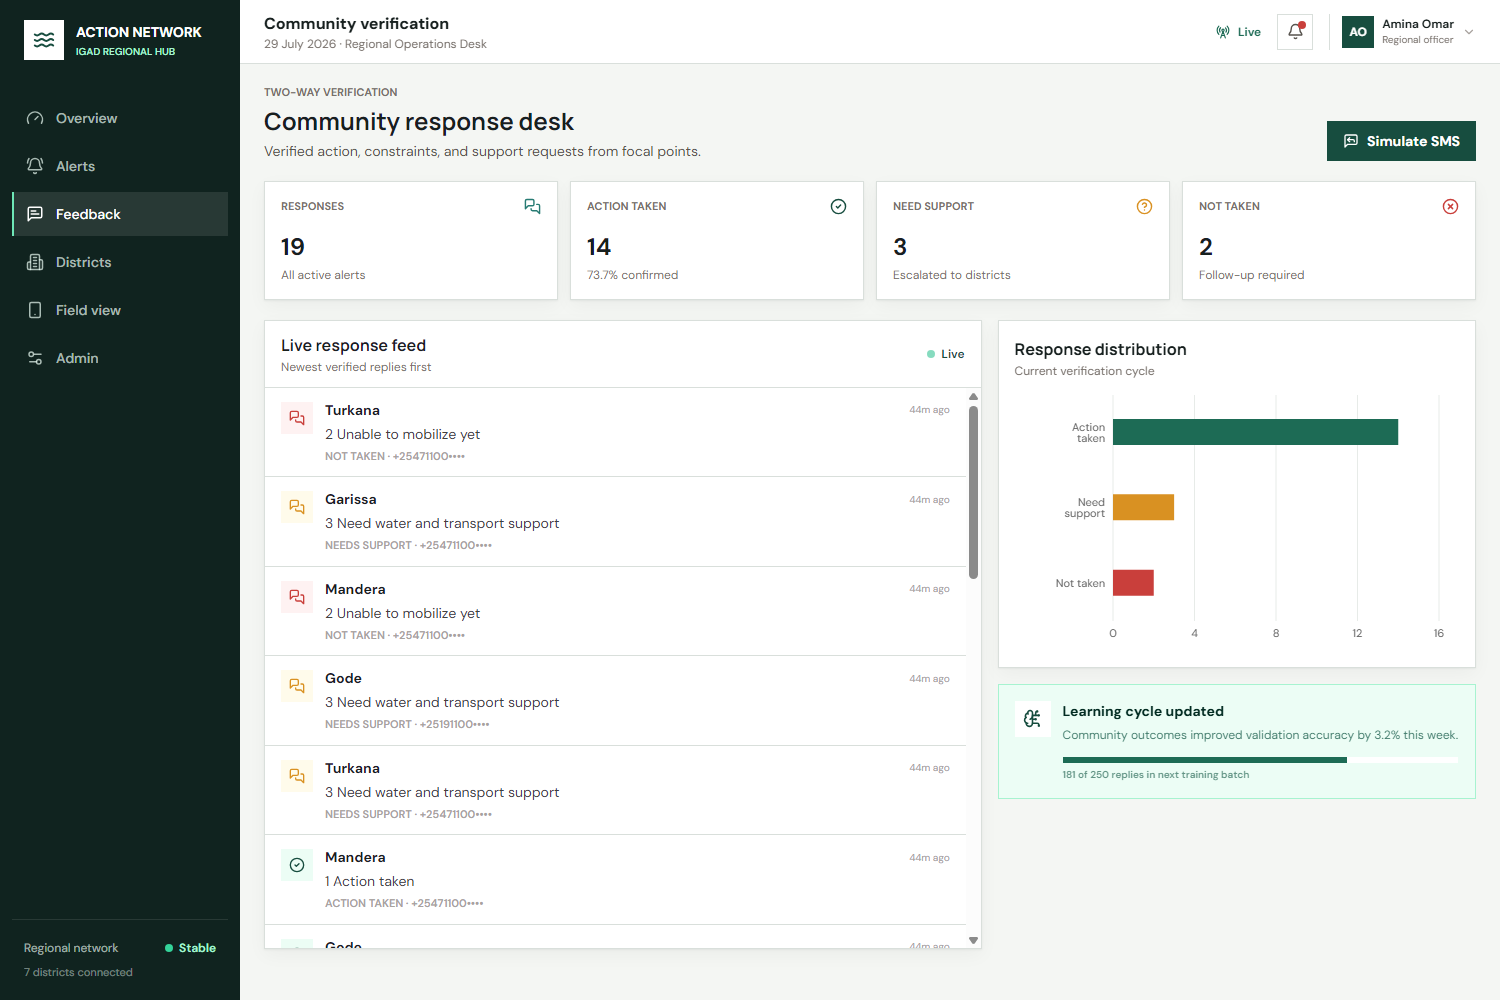
Community Feedback
-
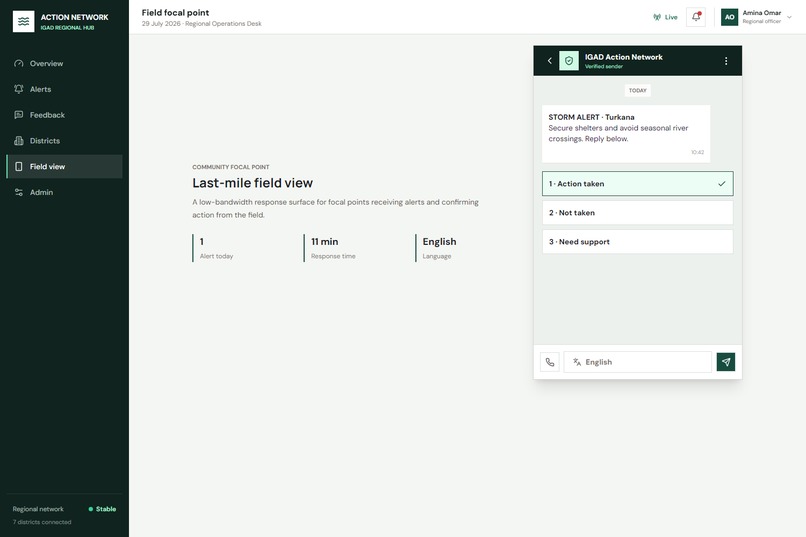
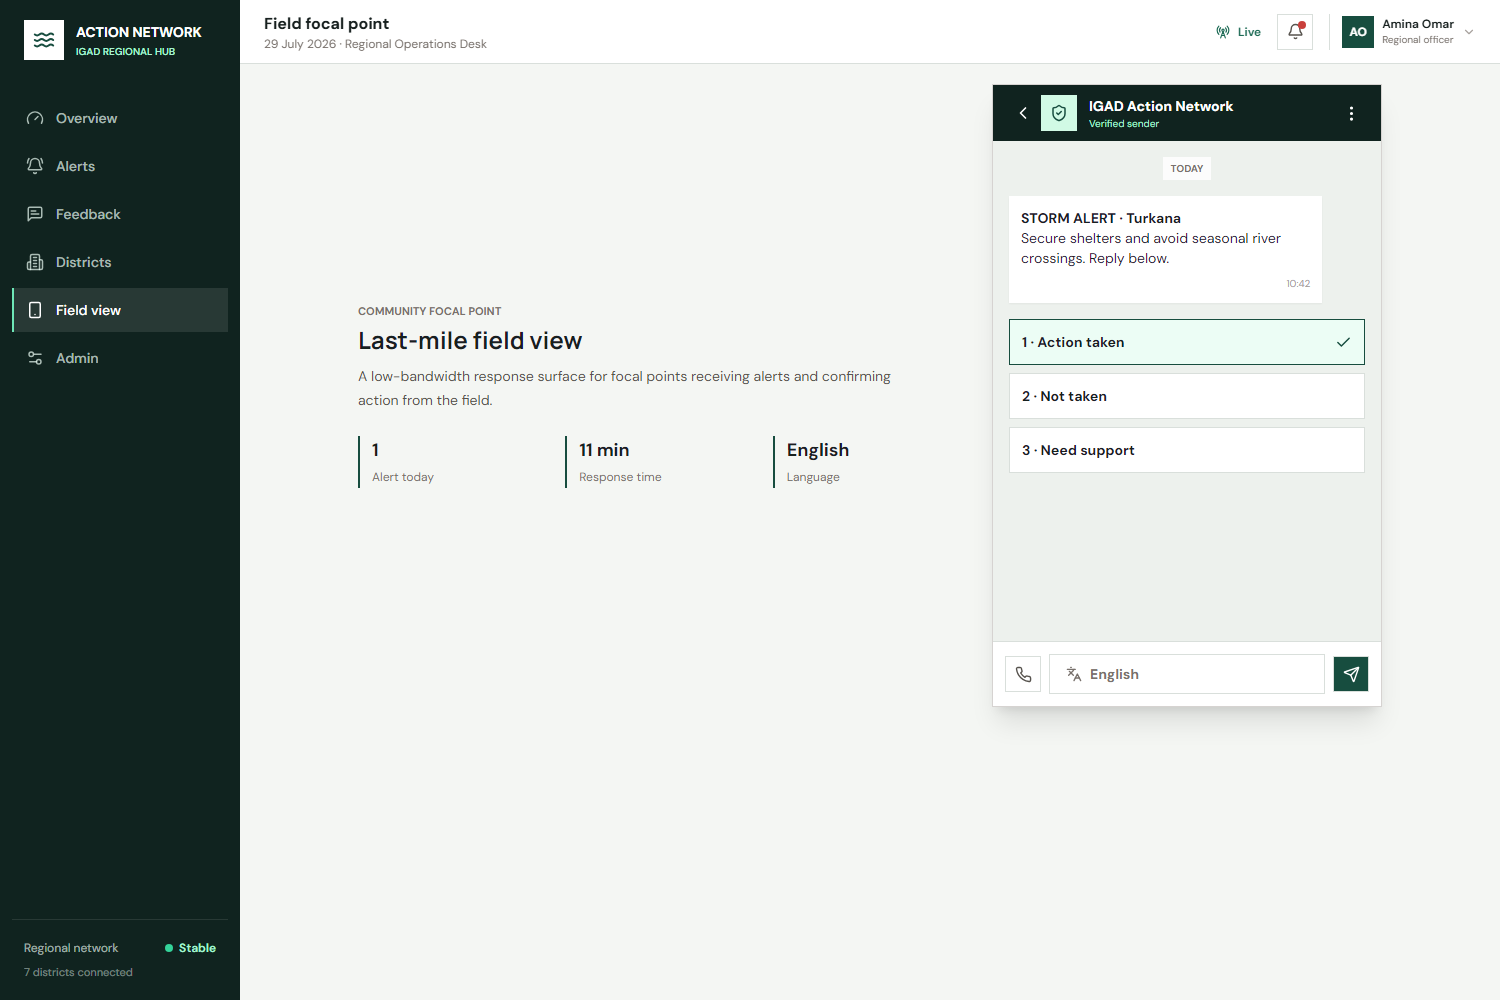
Last-Mile Focal Point Response
Inspiration
In the IGAD region, early-warning systems often stop after a message is broadcast. A warning can be delivered successfully while communities still do not know what to do, cannot act, or need support that no system records.
We built Action Network around one question:
How do we know whether an early warning became early action?
The answer is a two-way feedback loop. Officers send targeted alerts, focal points respond through simple SMS codes, and the system records whether action was taken, not taken, or support is needed.
What We Learned
We learned that humanitarian technology must be designed for real operating conditions:
- Low-bandwidth communication is essential.
- Prediction and verified community feedback must remain separate.
- Explainable AI is more useful than a mysterious score when decisions affect communities.
- A map alone is not enough; officers need delivery, response, escalation, and accountability in one workflow.
- A working simulation can demonstrate the full operational loop safely before connecting real SMS providers.
How We Built It
The frontend is a responsive React and TypeScript operations dashboard using Tailwind CSS, Leaflet maps, Recharts, React Query, and WebSockets.
The backend is built with FastAPI, SQLAlchemy, PostgreSQL, signed JWT authentication, Pydantic validation, and REST/WebSocket APIs. Neon PostgreSQL stores districts, alerts, feedback, users, trigger rules, and audit records. Render hosts the deployed frontend and API.
The impact-scoring service combines:
- Hazard magnitude
- Rate of change
- Population exposure
- Livelihood sensitivity
- Prior food-security conditions
It returns an explainable score from 0 to 100, a severity level, confidence, and weighted risk drivers. A scikit-learn training pipeline is included for future field-data retraining.
The deployed prototype runs SMS in simulation mode. This allows judges to trigger an alert, send a message, reply from the focal-point view, and immediately see the response update the dashboard.
Challenges
The biggest challenge was connecting forecast information to measurable action without pretending that a predicted risk is the same as a community outcome.
We also had to design for both regional operations officers using dashboards and field focal points using basic phones. That led to the central workflow:
- Detect risk.
- Calculate impact.
- Send an actionable warning.
- Receive a simple reply.
- Escalate support requests.
- Learn from verified outcomes.
Another challenge was making the prototype affordable and deployable using free and open-source tools. We used simulation mode, seeded regional data, open map tiles, PostgreSQL, and a documented path to connect official ICPAC or CHIRPS feeds.
Action Network turns early warning into a measurable, accountable cycle of early action.
Built With
- api
- css
- docker
- fastapi
- geospatial
- jwt
- leaflet.js
- neon
- openstreetmap
- postgresql
- pydantic
- python
- react
- recharts
- render
- rest
- scikit-learn
- sms
- sqlalchemy
- sqlite
- tailwind
- typescript
- vite
- websockets

Log in or sign up for Devpost to join the conversation.