-
-
Slide 5
-
Slide 2
-
Slide 8
-
Slide 10
-
Slide 7
-

Slide 9
-
Slide 3
-
Slide 6
-
Slide 4
-
Slide 1


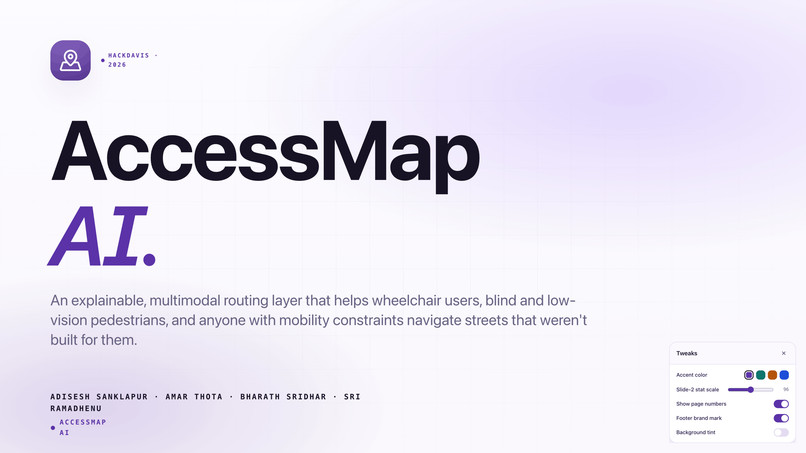
AccessMap AI
AI-Powered Accessibility Intelligence Platform
HackDavis 2026
Profile-aware, hazard-aware, explainable navigation for accessible urban mobility.
Inspiration
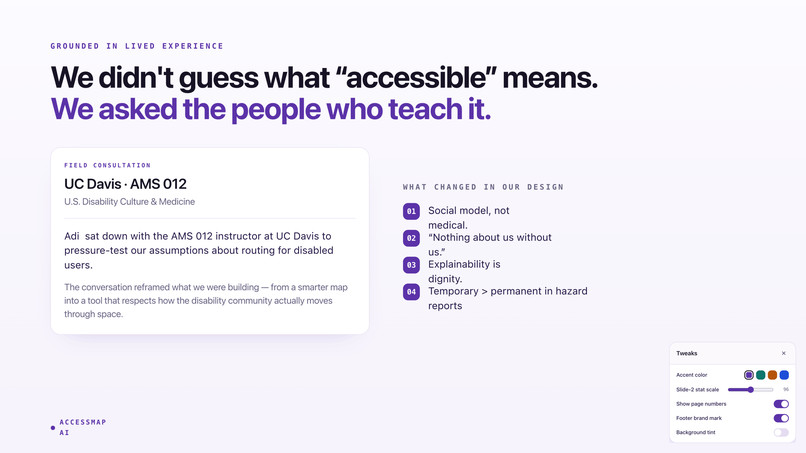
It started during a Tuesday afternoon lecture in AMS 012 — US Disability and Culture.
Adi was introduced to the social model of disability, a framework built around one powerful idea:
A person is not disabled by their body. They are disabled by an environment that was never designed for them.
After that lecture, everyday infrastructure failures suddenly became impossible to ignore:
- stairs without ramps
- crosswalks without audible signals
- sidewalks that abruptly end
- inaccessible entrances hidden behind “main” entrances
Within days, we began cataloging accessibility barriers across the UC Davis campus — places we walked through every day that others physically could not.
Then we looked at the tools people actually use.
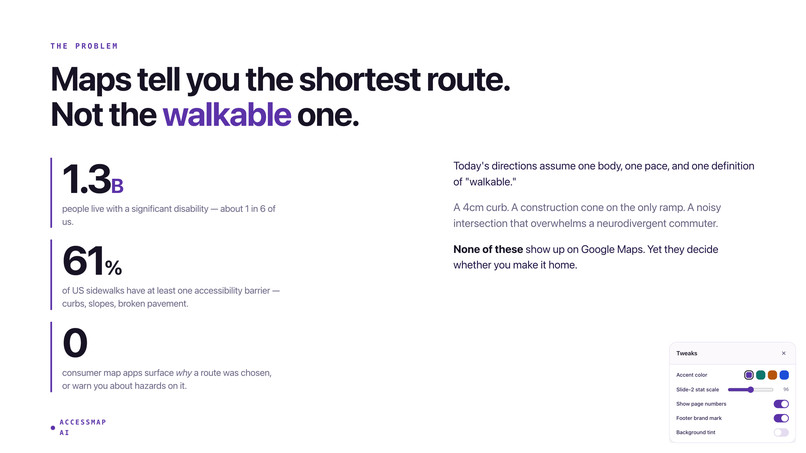
Google Maps can reroute around traffic.
It cannot reroute around a missing curb ramp.
Apple Maps exposes a single wheelchair=yes tag and stops there.
Meanwhile, OpenStreetMap already contains rich accessibility metadata:
- slope
- sidewalk surface
- kerb quality
- tactile paving
- crossing signals
- lighting coverage
Yet almost none of this information is meaningfully used by mainstream navigation systems.
1 in 4 adults in the United States lives with a disability.
That is over 70 million people navigating environments designed primarily for everyone else.
The disconnect between accessibility research and real-world navigation technology became the foundation for AccessMap AI.
“Most navigation apps optimize for speed — not accessibility.
A missing curb ramp can make an entire route impossible.”
That became the project’s north star.
What AccessMap AI Does
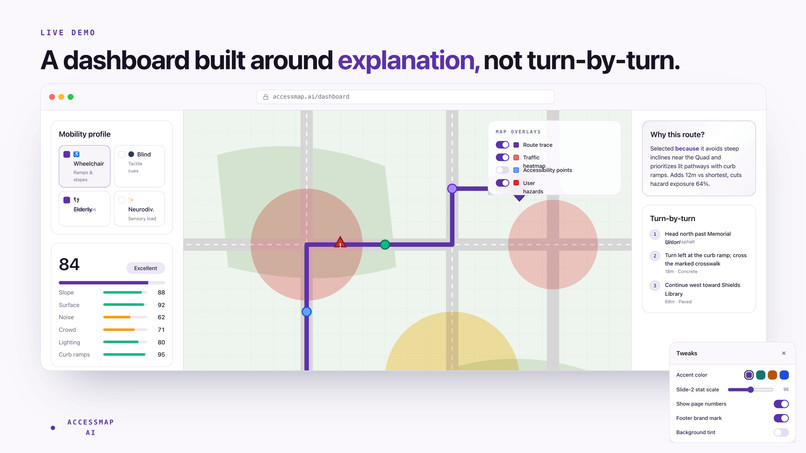
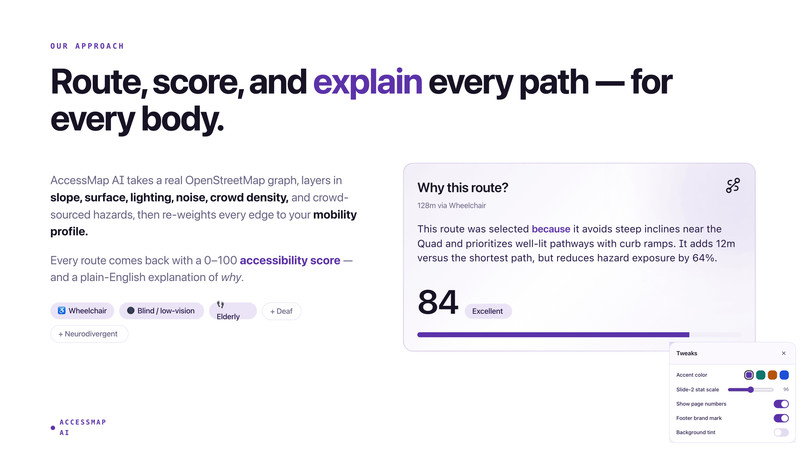
AccessMap AI is a profile-aware, hazard-aware, explainable accessibility map.
Users can:
Select accessibility profiles
- wheelchair users
- blind / low-vision users
- elderly users
- neurodivergent users
- temporary injury accommodations
Generate accessibility-optimized routes
Instead of simply finding the shortest route, AccessMap AI prioritizes the most passable and accessible path for the user’s needs.
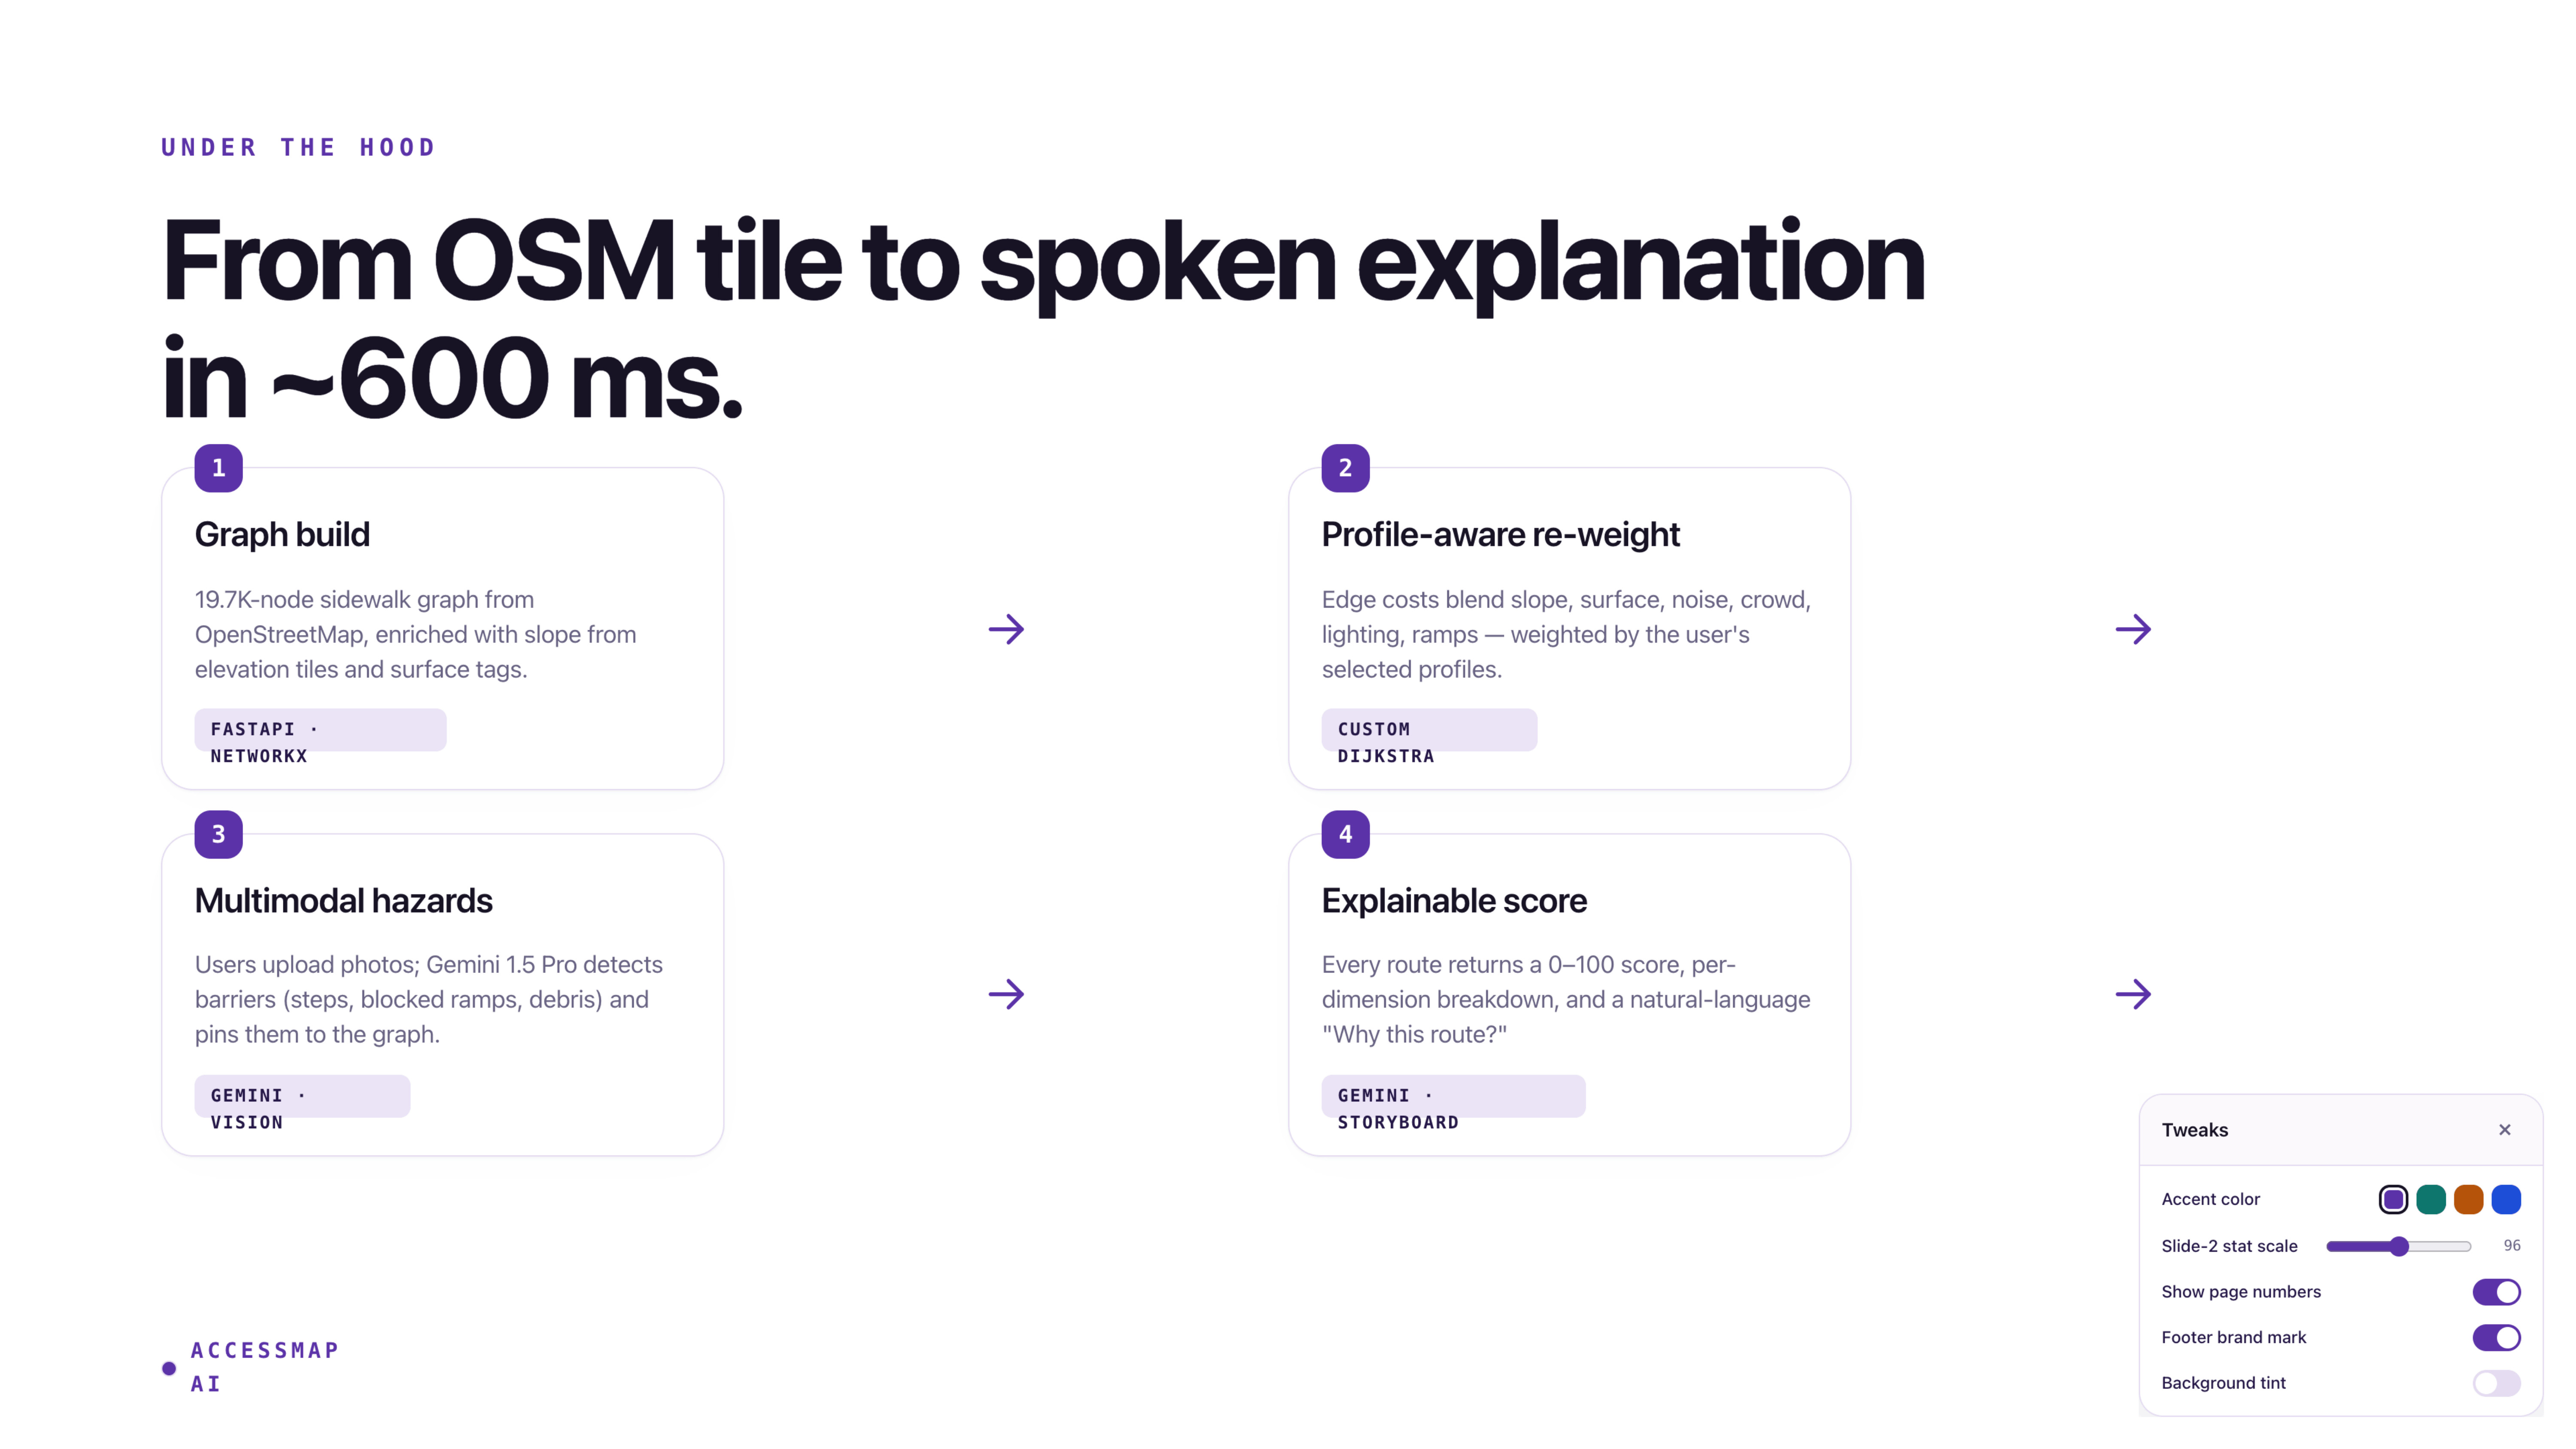
View detailed route scoring
Each route includes explainable score breakdowns for:
- slope
- surface quality
- lighting
- hazards
- crossing accessibility
Read natural-language explanations
The system explains why a route was selected and what tradeoffs influenced the result.
Report live hazards
Users can submit hazards such as:
- blocked sidewalks
- broken curb ramps
- construction zones
Routes dynamically adapt around reported hazards in real time.
Analyze sidewalks using AI
Users can upload sidewalk photos for accessibility analysis powered by Gemini.
Use spoken navigation
Turn-by-turn directions can be read aloud through Web Speech integration for blind and low-vision users.
System Architecture
Data Foundation
The routing graph is constructed entirely from open-source geospatial data.
| Source | Usage |
|---|---|
| OpenStreetMap (Overpass) | Sidewalks, crossings, kerbs, tactile paving, lighting, roads, buildings |
| Open-Meteo Elevation API | Slope estimation using elevation gradients |
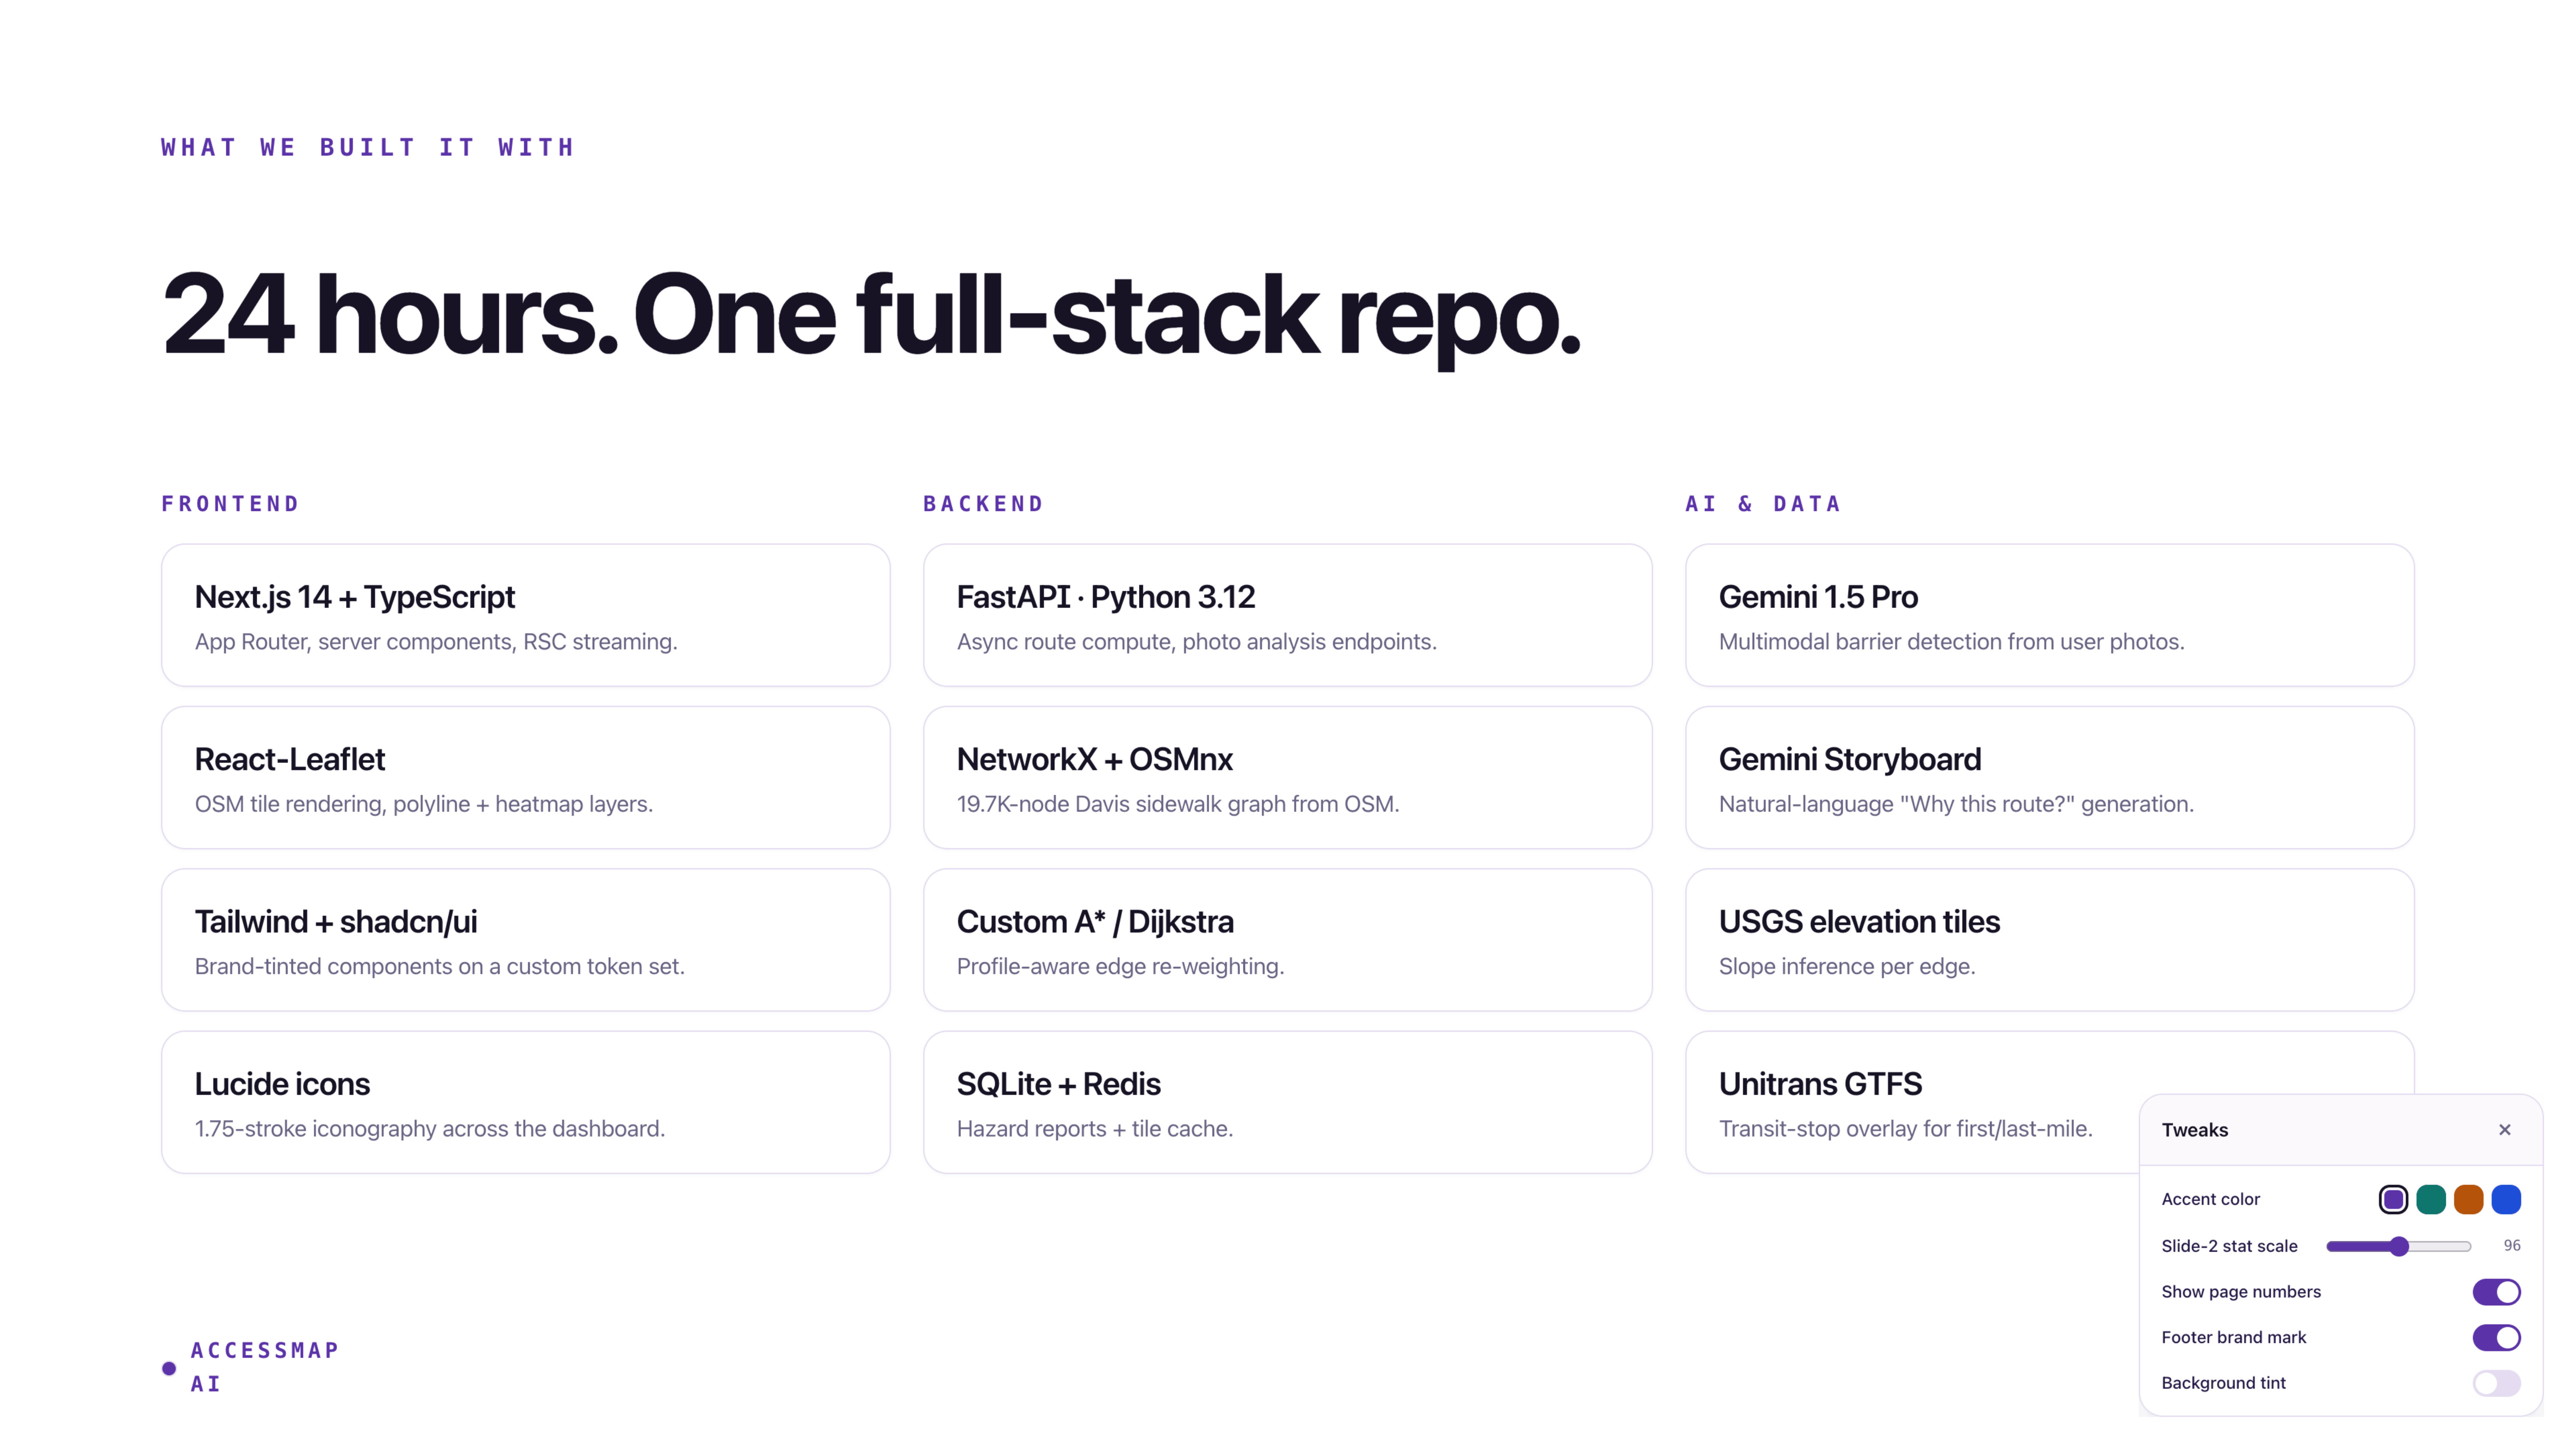
| Unitrans GTFS | UC Davis bus routes and stops |
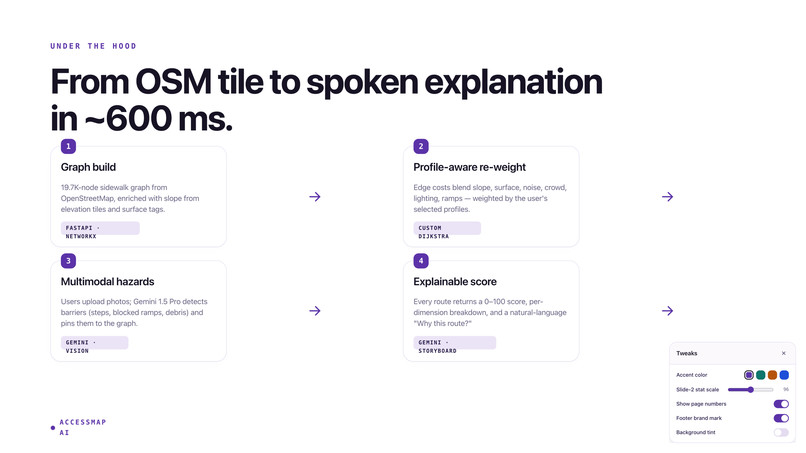
The preprocessing pipeline generates an enriched NetworkX graph containing approximately:
- 19,700 nodes
- 20,700 edges
Each edge stores derived accessibility features such as:
- surface roughness
- slope severity
- kerb quality
- tactile coverage
- lighting density
- crossing signal availability
Routing Engine
Each accessibility profile defines a weighted sensitivity vector representing how important different accessibility factors are for that user.
The routing engine evaluates:
- distance
- slope
- surface quality
- hazards
- crowd density
- noise
- accessibility constraints
The route cost is calculated by combining edge distance with weighted accessibility penalties. Each environmental factor (such as slope or surface roughness) contributes to the total path cost depending on how important that factor is for the selected accessibility profile.
Hard accessibility constraints such as:
- avoiding stairs
- slope limits
- minimum width requirements
- avoiding unpaved paths
are encoded as large penalties, allowing Dijkstra’s algorithm to naturally avoid inaccessible routes.
For combined accessibility profiles, the system uses the most restrictive constraints and highest factor sensitivities from each selected profile to ensure accessibility needs are preserved.
Hazard-Aware Scoring
User-reported hazards are stored dynamically in Supabase and integrated directly into route scoring.
For each hazard, the system computes the minimum geographic distance between the hazard and the route. Accessibility penalties are then assigned based on proximity:
- hazards within 15 meters produce severe penalties
- hazards within 30 meters produce moderate penalties
- hazards within 60 meters produce minor penalties
These penalties are aggregated into the overall accessibility score while preventing a single area from completely invalidating the route.
This creates:
- real-time rerouting
- transparent hazard scoring
- explainable accessibility penalties
Users can clearly see:
- which hazards affected the route
- how close they are
- how much they lowered the score
Crowd and Noise Modeling
Real cities rarely provide live accessibility-aware crowd data.
To estimate accessibility-relevant congestion, AccessMap AI models:
- time-of-day activity
- building density
- proximity to campus hotspots
The crowd model combines these signals into a single accessibility-aware congestion score.
Noise levels are estimated using road classification and distance-based attenuation models inspired by FHWA traffic-noise research.
--
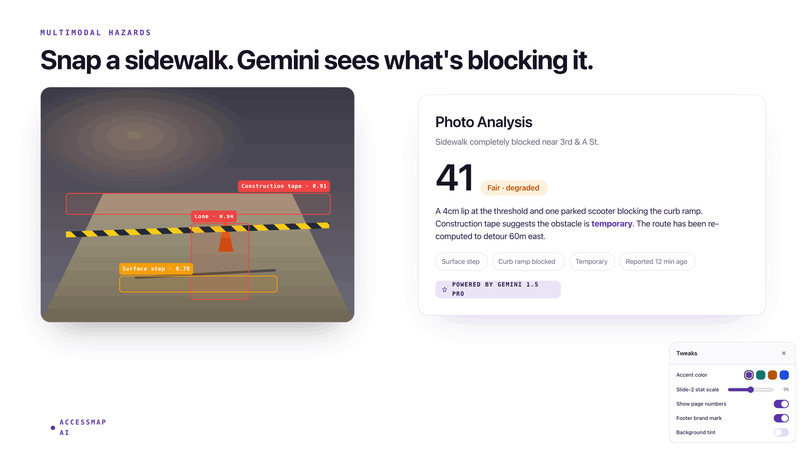
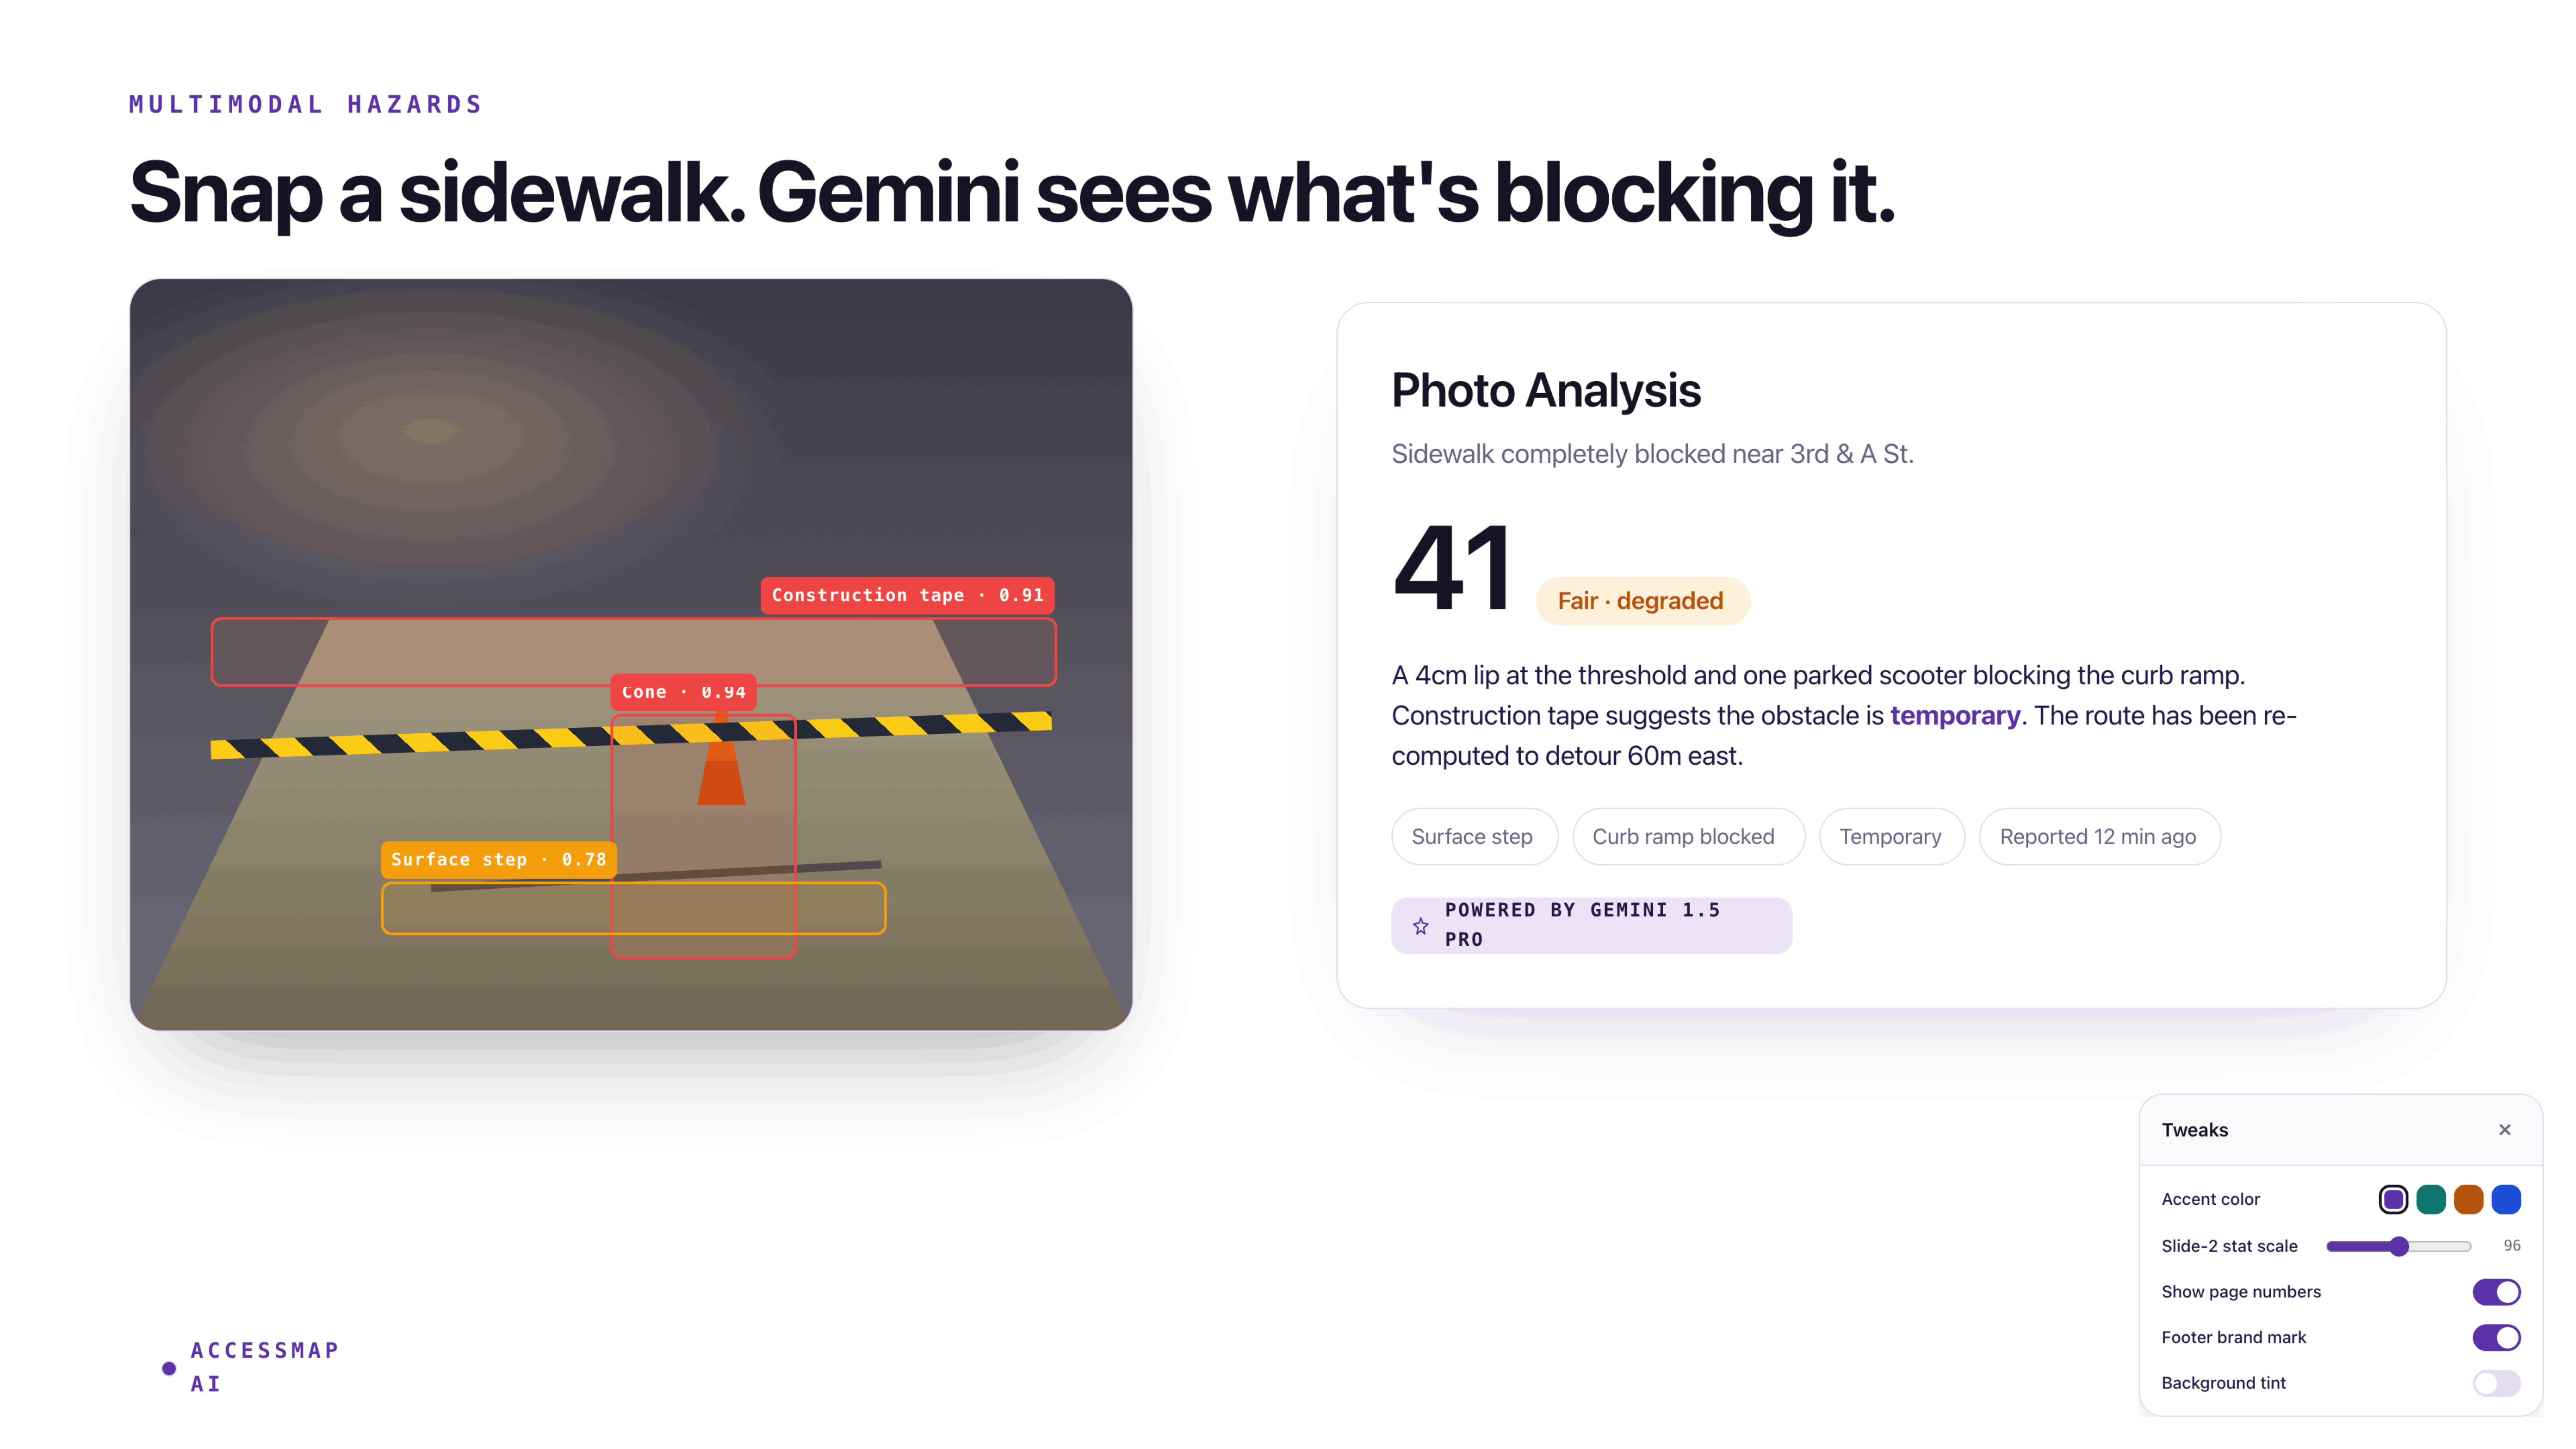
Gemini Sidewalk Analysis
Users can upload sidewalk photos for AI-powered accessibility analysis.
Gemini evaluates:
- obstruction severity
- surface quality
- slope
- wheelchair accessibility
The backend applies additional normalization logic to correct inconsistent scoring behavior and improve reliability.
A mock mode allows offline demos without consuming API quota.
Frontend Stack
- Next.js 15 App Router
- TypeScript
- Tailwind CSS v4
- shadcn/ui
- Mapbox GL JS
- Supabase Authentication
- Web Speech API
The UI emphasizes:
- explainability
- accessibility-first interaction
- persistent route visibility
- real-time hazard awareness
Major Challenges
Combined Profile Hazard Logic
Hazard filtering originally failed for multi-profile users because hazards were matched against a combined profile string rather than intersecting profile sets.
The fix required propagating original profile vectors directly into the routing cost layer.
Invisible Hazard Penalties
Routes near hazards still produced unrealistically high scores because static edge scoring ignored live hazards entirely.
We solved this using post-route hazard distance scanning and live penalty aggregation.
Gemini Score Inversion
Gemini occasionally interpreted accessibility scores as “problem severity” rather than “quality.”
A stricter rubric and post-processing sanity checks corrected the issue.
Mapbox Styling Conflicts
Mapbox popup styling conflicted with shadcn dark mode theming due to stylesheet specificity issues.
Custom Tailwind selectors and explicit popup overrides resolved the problem.
What We Learned
Accessibility is Deeply Multidimensional
Accessibility cannot be reduced to a single boolean tag.
True accessibility involves:
- slope
- surface material
- kerb geometry
- lighting
- noise
- crossing safety
- environmental predictability
Static Maps Are Not Enough
Accessibility changes dynamically.
Construction, flooding, broken ramps, and temporary obstructions require real-time community feedback systems.
Explainability Creates Trust
Users need to understand:
- why a route was selected
- which constraints mattered
- which hazards affected the score
Transparency is essential for accessibility-critical systems.
The Social Model Becomes Software Architecture
Once disability is understood as a mismatch between person and environment, the routing system naturally becomes an environmental reasoning engine.
The mathematics simply operationalizes the social model into infrastructure-aware optimization.
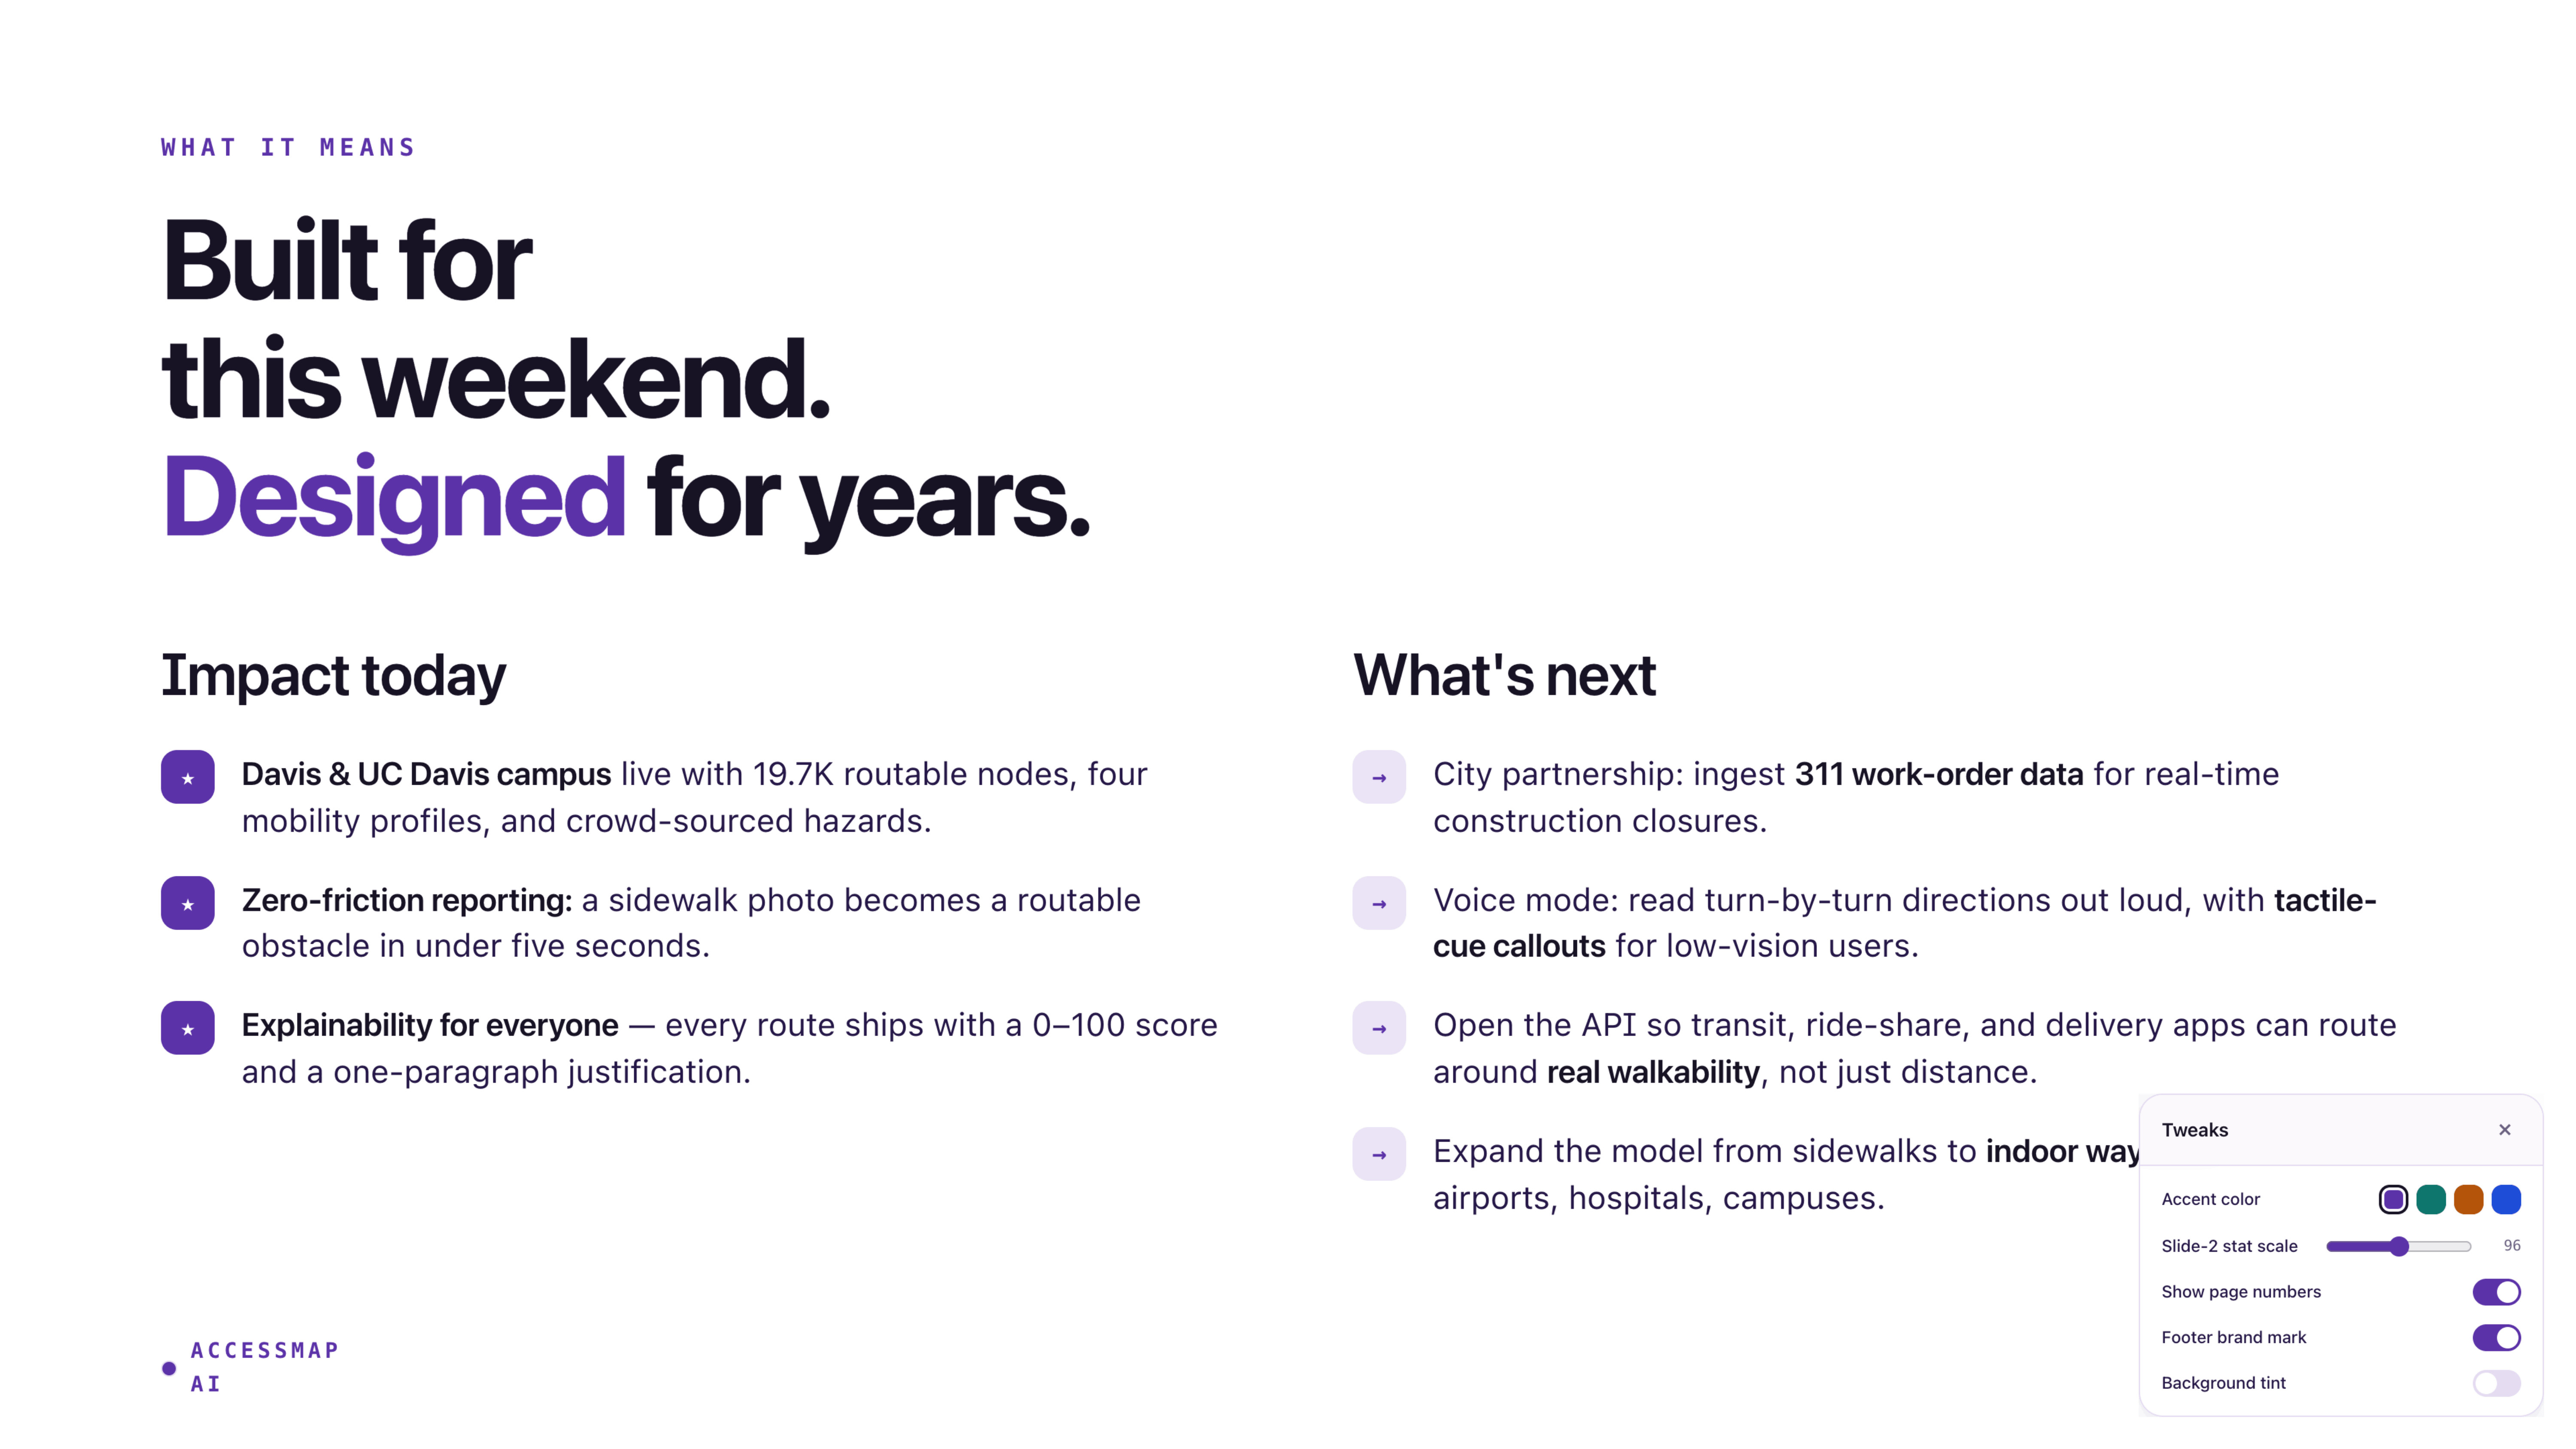
Future Work
- Hazard expiration and community verification
- Multi-city onboarding pipelines
- Indoor accessibility routing using
indoor=* - Accessibility infrastructure heatmaps for city planners
- Sign-language route explanation videos
Closing
The world was not built equally for everyone.
AccessMap AI aims to make it more understandable, navigable, and accessible — one route at a time.
Built With
- fastapi
- gemini
- mapbox
- openstreetmap
- supabase

Log in or sign up for Devpost to join the conversation.