What it does GridLock automatically surfaces transmission coordination opportunities between electric utilities — project pairs close enough in geography and schedule that the utilities could share trenches, access roads, permits, and contractor mobilization instead of paying for everything twice.
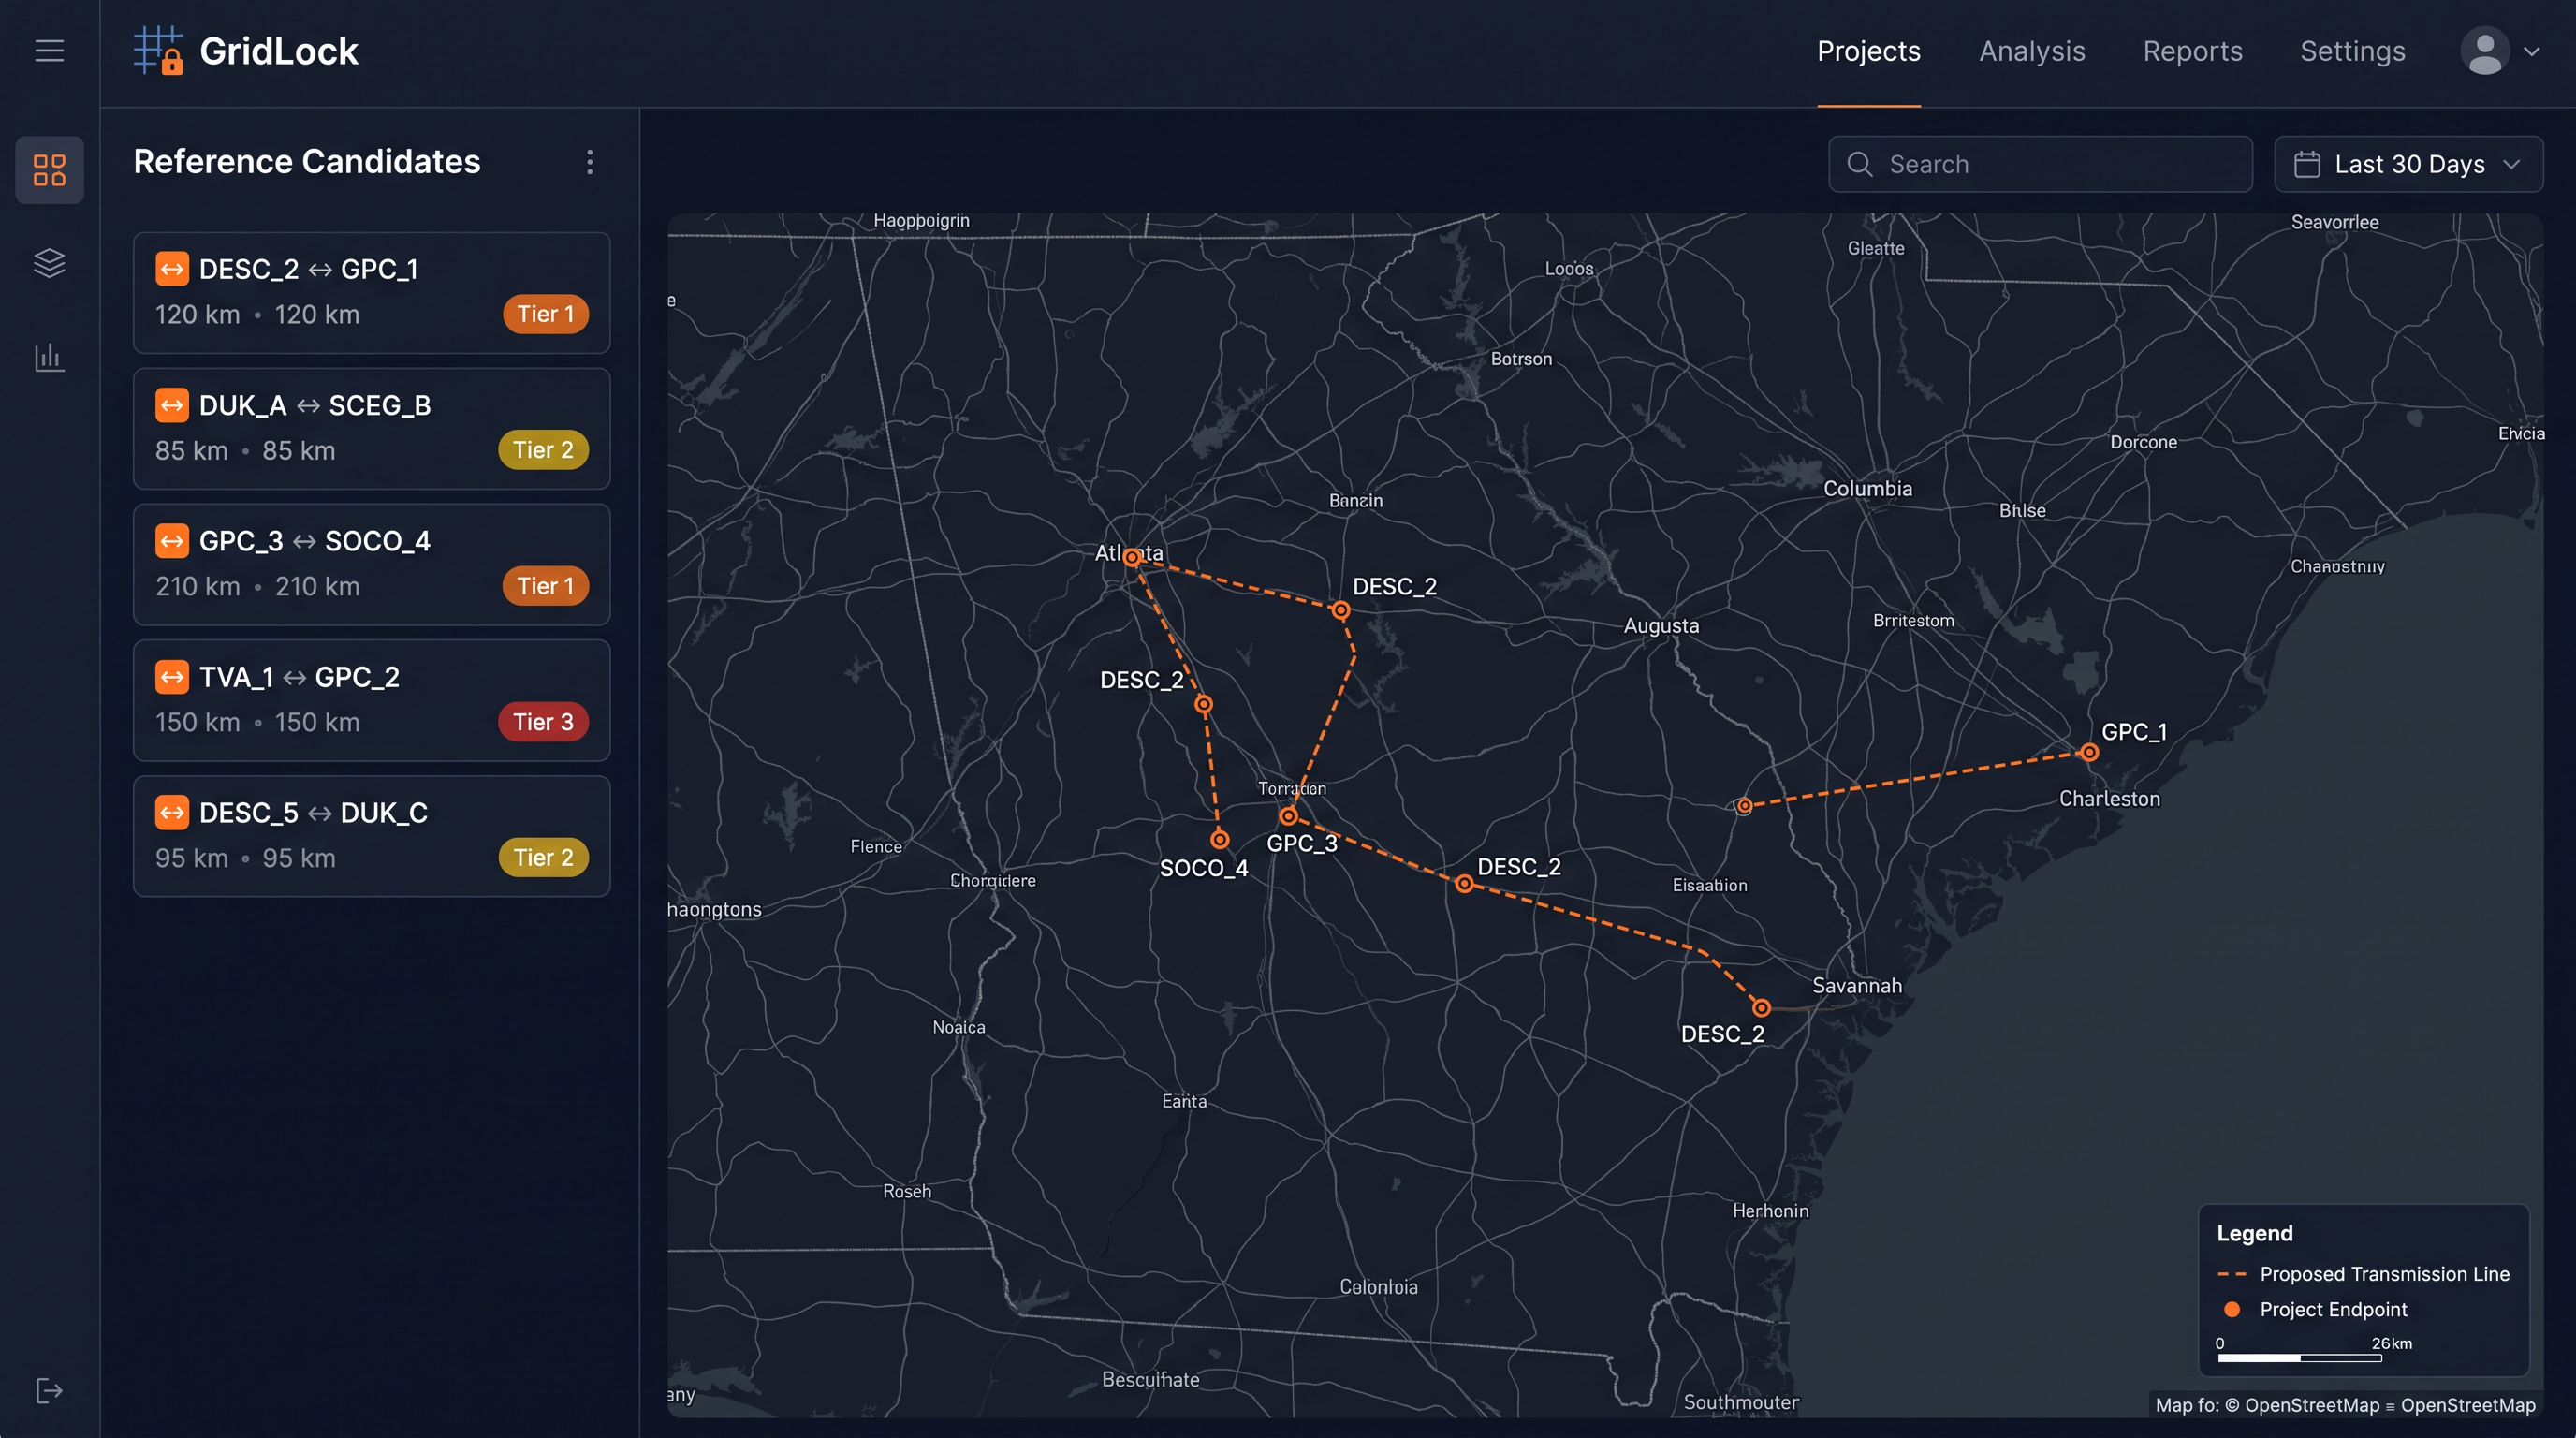
You give it publicly available planning documents. It finds the pairs. A live interactive map shows each candidate with the closest-point connector line, distance, and coordination tier. No AI makes the scoring decision — that stays deterministic and auditable.
Inspiration Electric utilities file transmission plans publicly, but no tool cross-references them. Two utilities can be planning lines within a kilometre of each other on overlapping schedules, and neither knows. Industry estimates put wasted coordination costs in the tens of millions of dollars per avoided duplication. The data to find these opportunities is public. The gap is a tool that actually does the geometry.
How we built it The stack is intentionally boring and auditable:
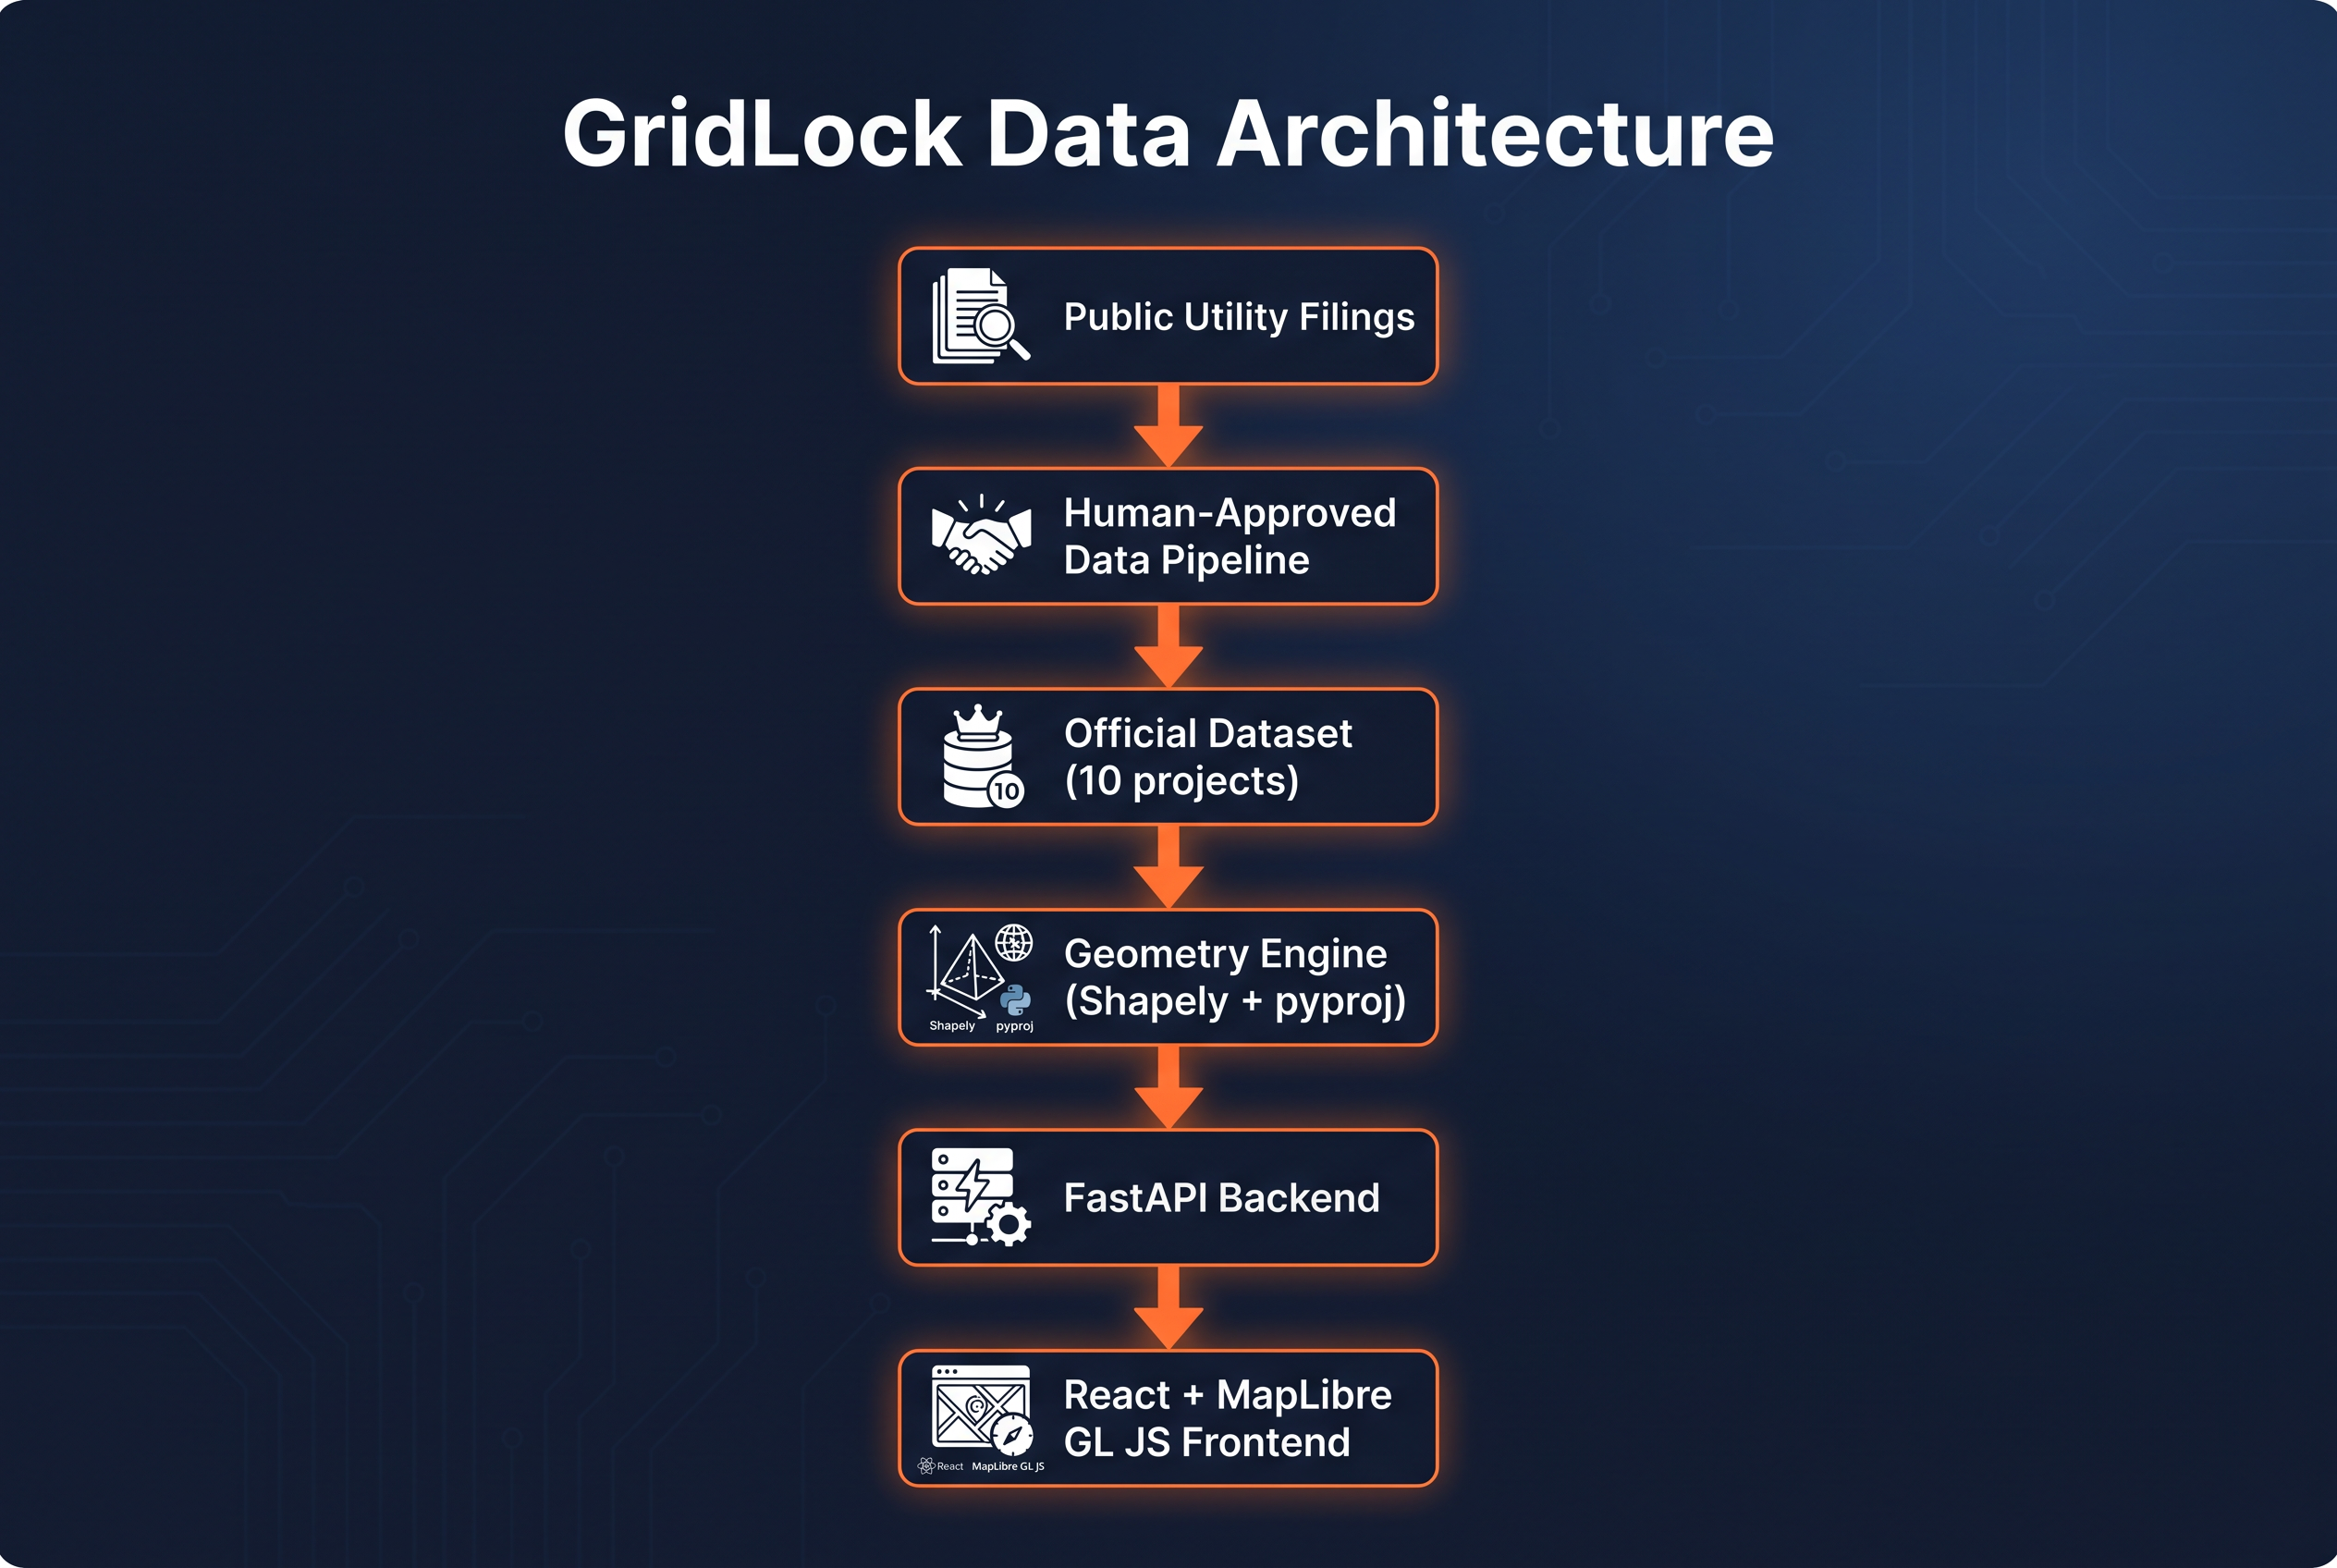
Data pipeline — public filings (SCRTP, DESC IRP, Georgia Power portal) → human-approved CSV → projects_official.json. No CEII data. No invented coordinates. Every row cites a public URL, publisher, and date.
Geometry engine — Shapely + pyproj compute minimum geometry distance in UTM 17N, then convert back to WGS 84 geodesic via pyproj.Geod. PostGIS ST_Distance handles the same calculation in the database-backed mode.
Distance model — closest points between two geometries found in EPSG:32617, reported as the WGS 84 geodesic distance between those points. The inclusion gate is a strict (d_{\text{closest}} < 40.0 \text{ km}). Pairs at exactly 40.0 km are excluded.
Coordination tiers — four bands based on closest distance: touching/crossing, under 1.6 km, under 8 km, under 40 km. Boundary values fall into the next-larger tier (strict <).
API — FastAPI serving /projects (10 official projects, {data, meta} envelope) and /reference/opportunities (ranked reference candidates).
Frontend — React + MapLibre GL JS on an OpenFreeMap basemap. The sidebar lists reference candidates ranked by closest distance. The map draws the closest-point connector as an orange dashed line for each pair. Vite proxies /api to the backend so there is no CORS configuration in development.
Tests — 82 backend tests + 11 frontend tests (Vitest + Testing Library). All green.
Challenges we faced Honest geometry. Most proposed transmission projects have no public route geometry — only substation names. We geocoded endpoints from EIA-860 and OpenStreetMap, but only two of 34 proposed records had defensible public coordinates. Rather than invent geometry, those 32 records stay in the pipeline as unresolved. The engine reports what the data actually supports.
The honest negative. The two geocoded proxies (GPC-004 and DESC-003) are 116.993 km apart — outside the 40 km gate. That is a real result, not a failure. We kept it, documented it, and let the reference candidate layer show it clearly so judges can see the distance model is working correctly rather than hiding an inconvenient answer.
Rounding. Floating-point round() in Python uses banker's rounding. The contract requires ROUND_HALF_UP throughout. Every serialized distance uses decimal.Decimal.quantize(ROUND_HALF_UP) — Python's built-in round() is banned from the serialization path.
Multi-agent coordination. The project was built by two AI systems (Perplexity writing to GitHub via MCP, Kiro running and testing locally) with a human making every data approval decision. Keeping the agents from writing contradictory contracts across 19 branches required explicit ruling documents and a strict no-guessing policy when source text was unavailable.
What we learned Public utility data is richer than it looks — and much harder to use than it looks. The gap between "this PDF mentions a substation" and "here is a defensible WGS 84 coordinate with a public source" is where most coordination tools fail. Building the pipeline to be honest about that gap — labeling unresolved records as unresolved, not filling them in — turned out to be the core design decision the whole project rests on.
What's next Promote the first approved project pair once a human reviews the geocoded endpoints against the source filings.
Expand to the full SCRTP planning footprint (currently 10 official projects across DESC and Georgia Power).
Add schedule overlap scoring: if two projects are geographically close but one finishes before the other starts, the coordination window is narrower.
Publish the data pipeline as a reusable open-source tool for any two-utility planning region.iration
What it does
How we built it
Challenges we ran into
Accomplishments that we're proud of
What we learned
What's next for Abhiram Bhogi
Built With
- api
- fastapi
- geojson
- geospatial
- maplibre
- openfreemap
- postgis
- postgresql
- pyproj
- python
- react
- rest
- shapely
- uvicorn
- vite
- vitest

Log in or sign up for Devpost to join the conversation.