
A2 Pulse
Your Ann Arbor, briefed and mapped.
A2 Pulse pulls Ann Arbor’s scattered local information into one graph — U-M events, downtown venues, road closures, transit detours, and City Council items — then turns that graph into a one-minute spoken brief for your week, plus an interactive map and a graph explorer.
Inspiration
Ann Arbor doesn't lack information. It lacks one place to find it. A U-M student who bikes to campus down Plymouth Road has to check Happening @ Michigan, venue calendars, Eventbrite, the city's road-closure notices, TheRide's detour alerts and City Council agendas to learn that her route has a lane closure Wednesday, that there's a free jazz night Friday, and that Council votes on housing near her on Monday. Nobody checks all of those. In Inside Higher Ed's 2023 Student Voice survey, 31% of students named lack of knowledge about activities or events as a barrier to getting involved.
We wanted something you could open on Monday morning and just listen to.
What it does
A2 Pulse turns Ann Arbor into one knowledge graph and briefs you on the parts of it that touch your week.
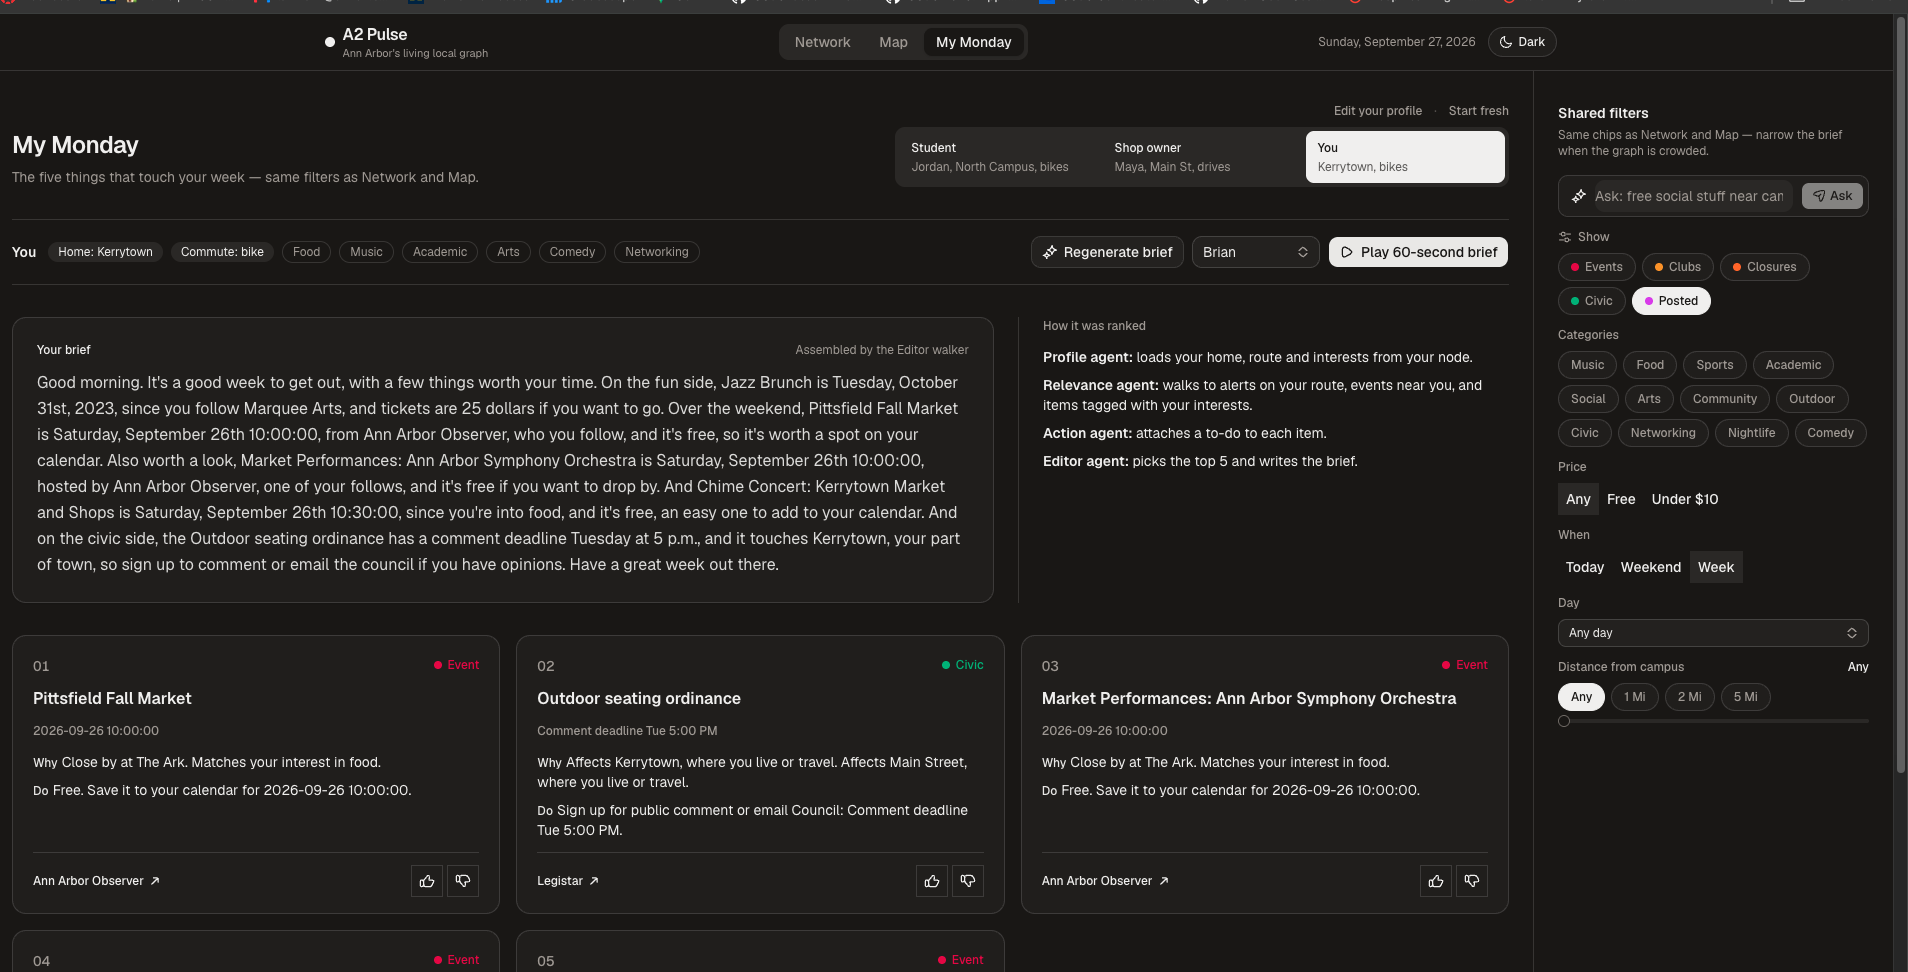
- My Monday (voice brief). The five items that matter most this week, each with a short “why” and “what to do,” written as a spoken brief and read aloud by ElevenLabs. Switch between demo personas (Student, Shop owner) or You. Thumbs up/down adjusts that profile’s interest weights for the next brief.
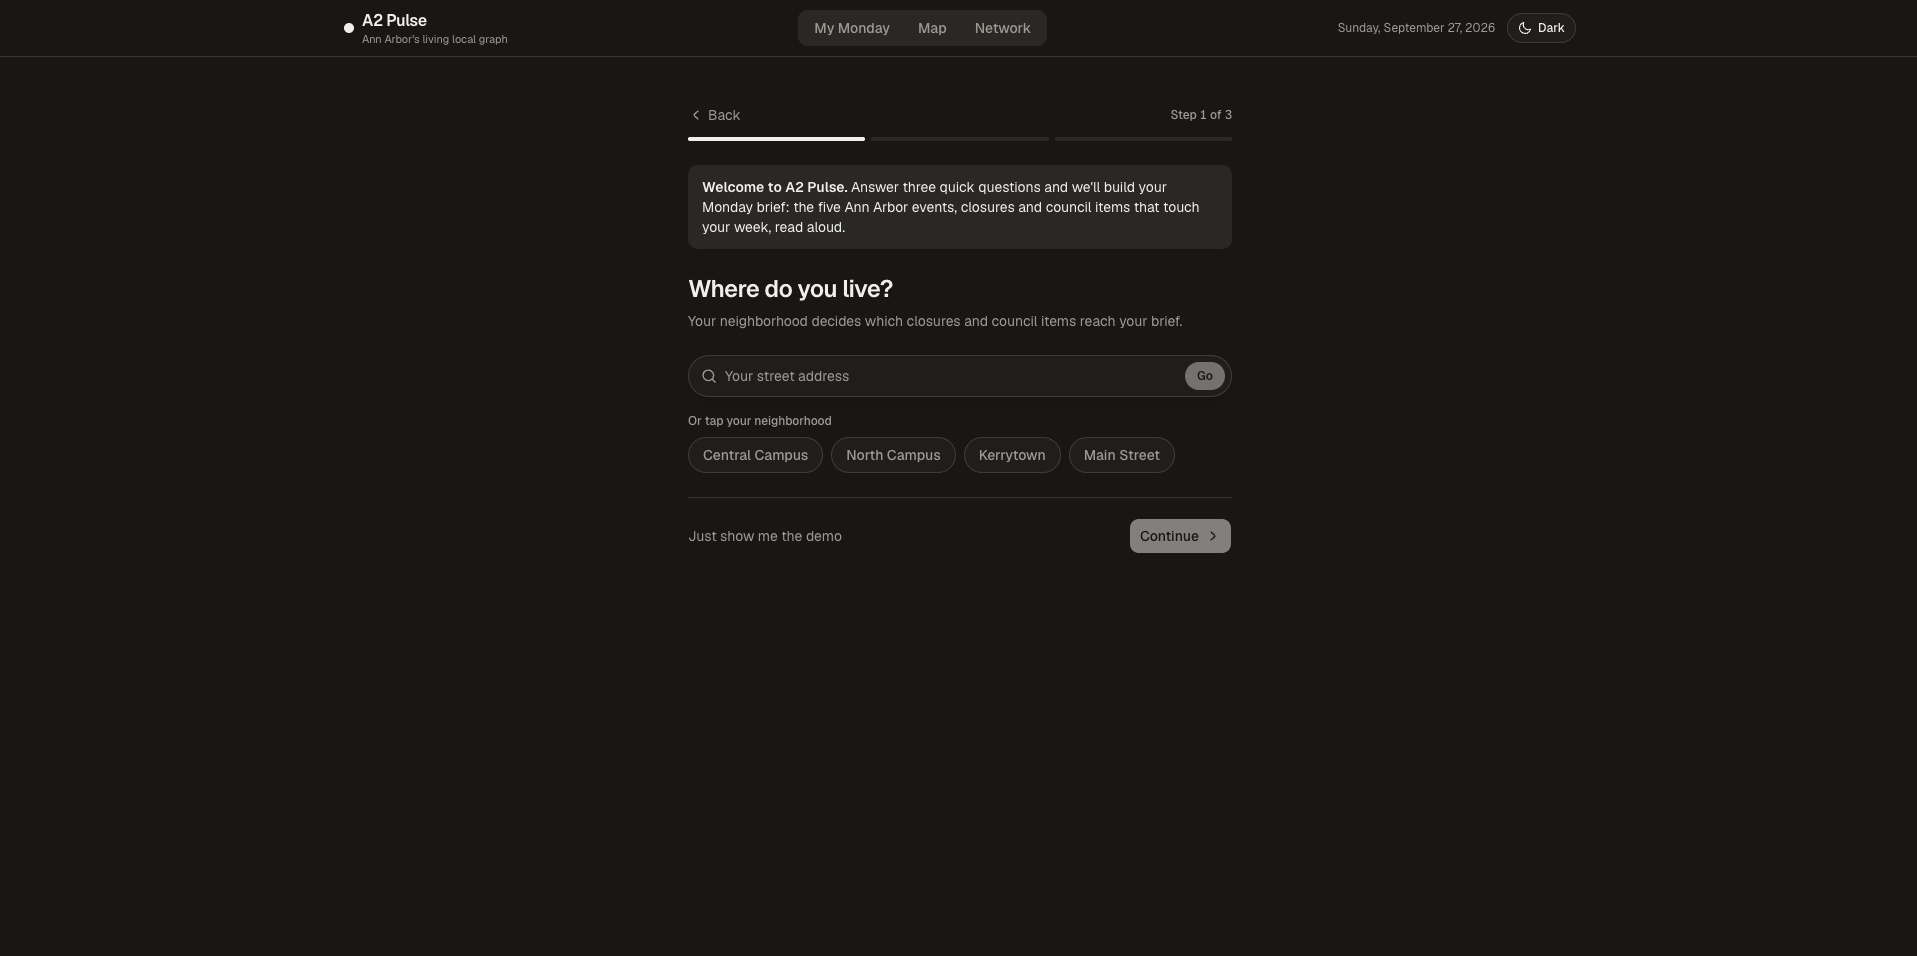
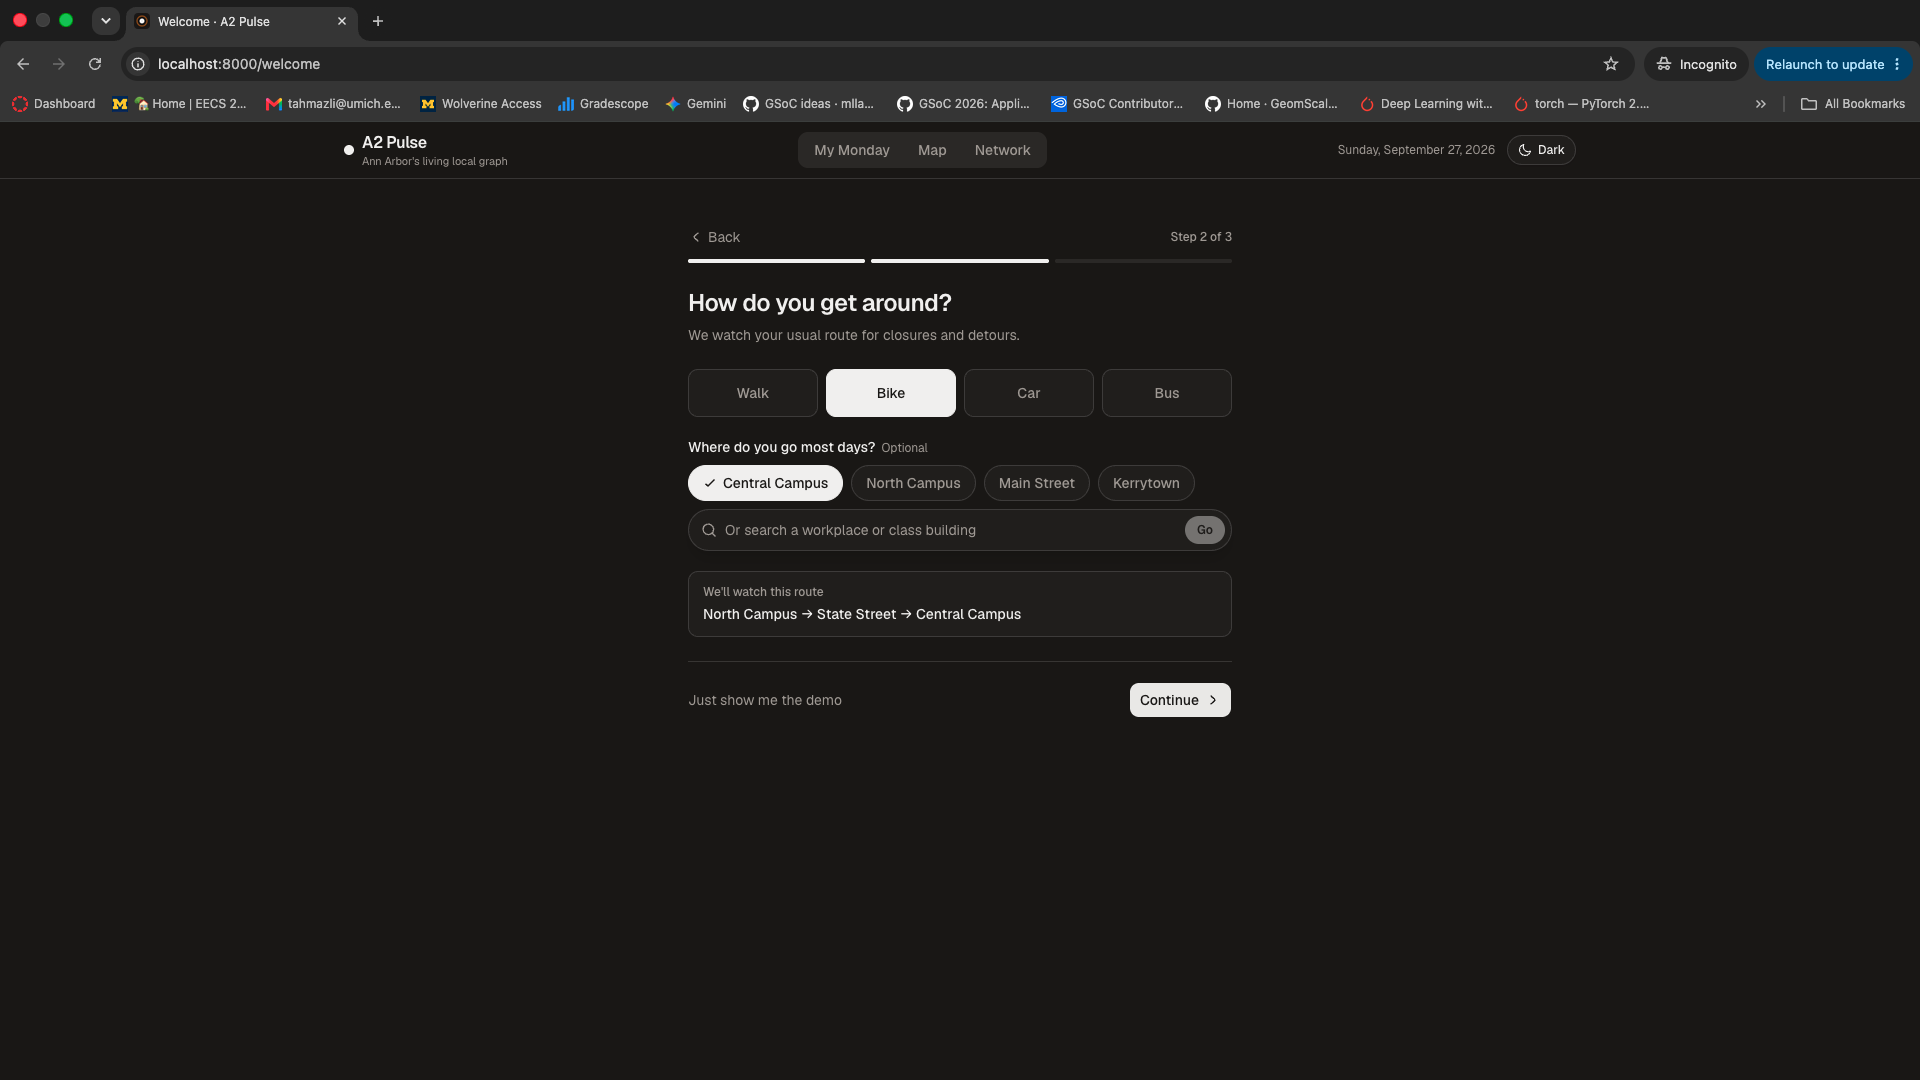
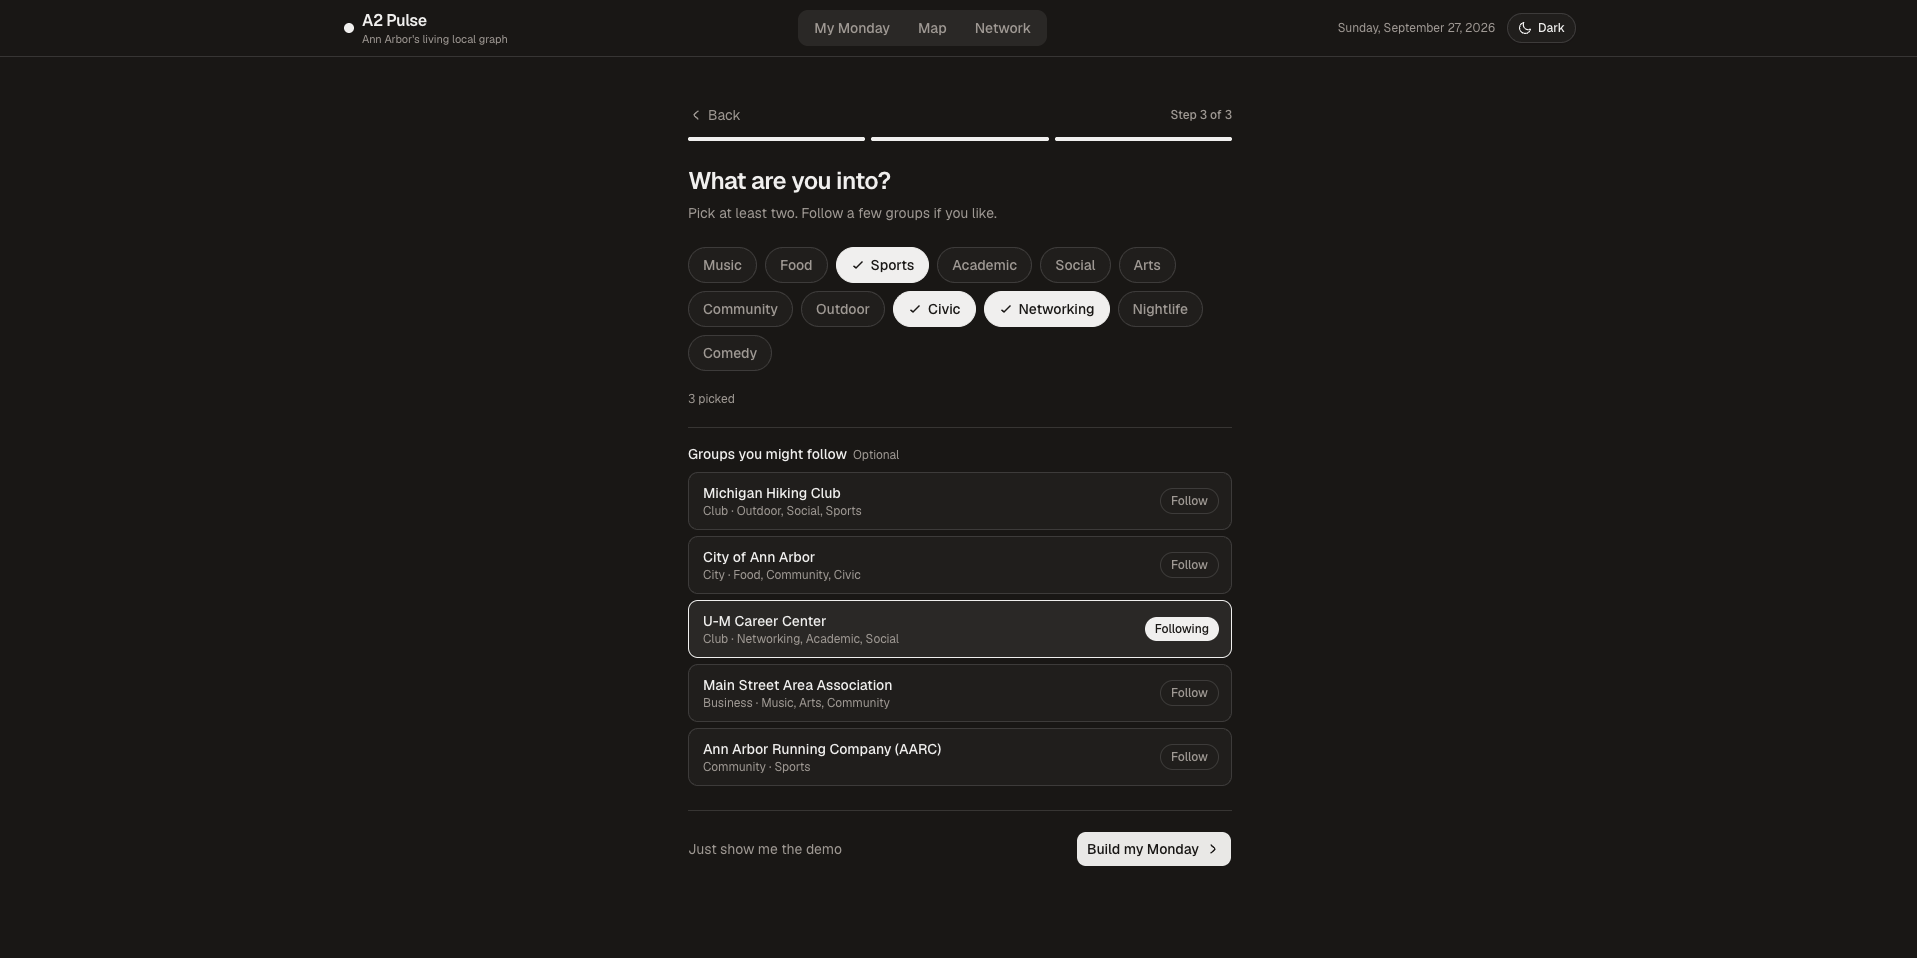
- Onboarding. Three quick steps (home, commute, interests, who to follow) that turn this browser’s “You” profile into a real node in the graph, then land on My Monday.
- Map. Events, clubs, closures, and council items on Google Maps. Closures and detours are snapped onto the road network. Filter by category, price, day, and distance, or ask in plain English (“free music near campus”).
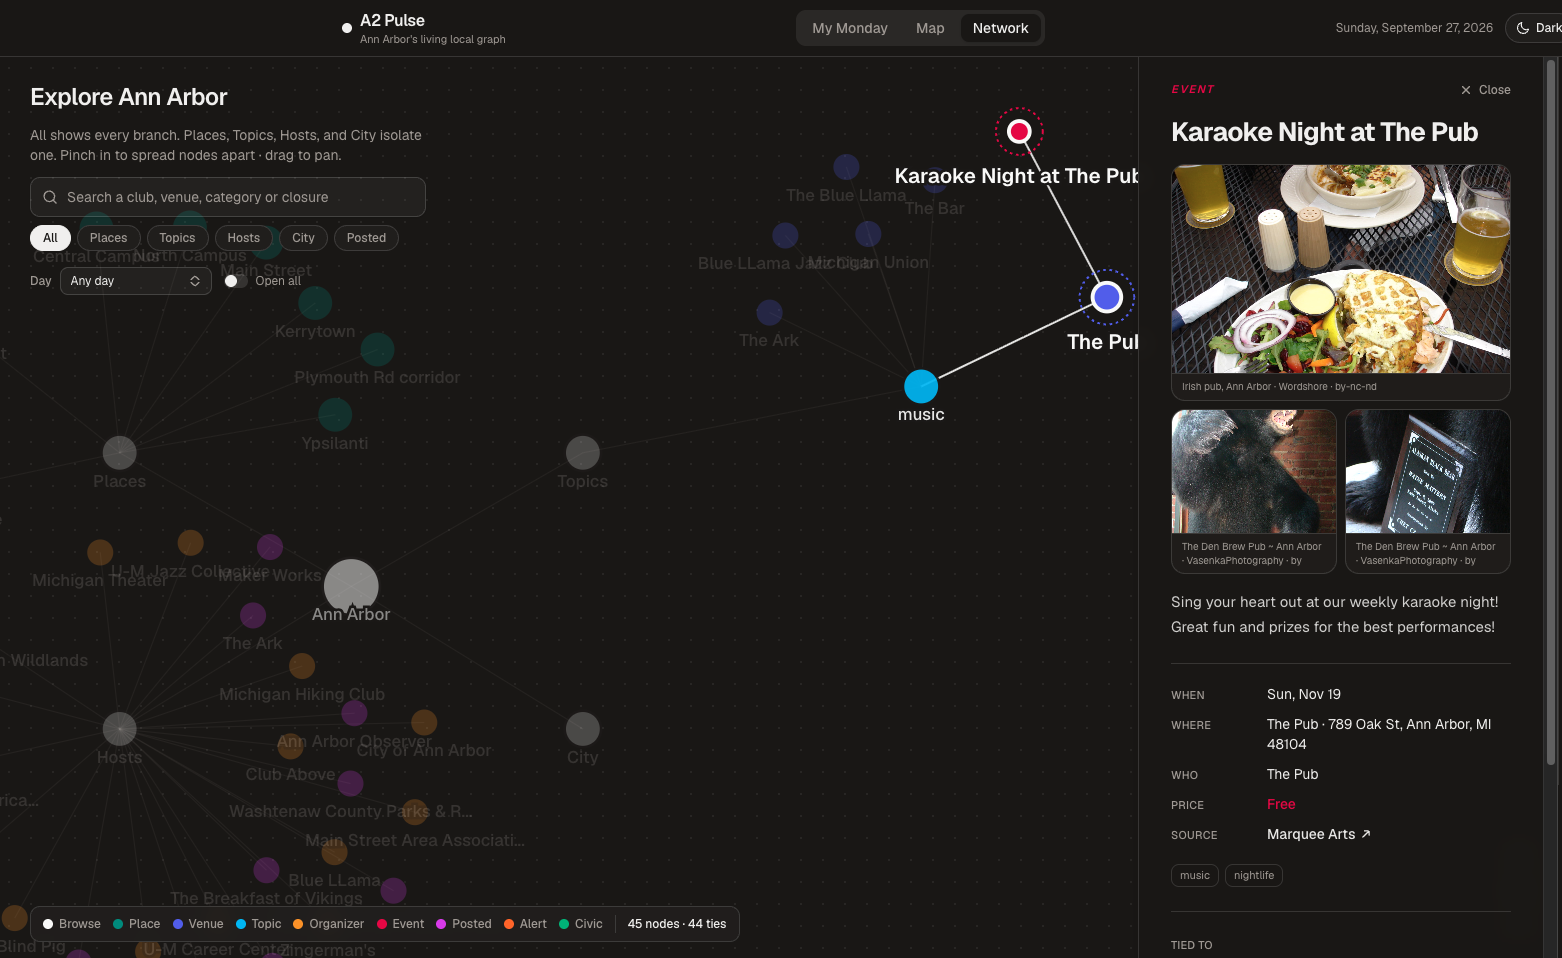
- Network. Browse the knowledge graph by places, topics, and hosts; open a dossier (with photos) for any node. A single sidebar switches between Here (where you are in the graph) and Detail (the selected node). Hover starts prefetching the dossier so clicks feel instant. Filters stay in sync with the Map.
- Live sync (manual). Use Sync live events on the Network page to pull public calendars into the graph (Happening @ Michigan, The Ark, the Ann Arbor Observer, UMS, Eventbrite, and related sources). The server skips repeat syncs within a few minutes and never runs two at once. Road closures, transit detours, and council items are still demo data for now. Each sync geocodes at most ~60 new buildings (Nominatim ~1 req/s).
Special feature: Post your own events - (under Posts category in Network)
Anyone can add a neighbor-made event from the Network page. Your post becomes a real event node on the shared graph — tagged by topic, filterable with everything else, and visible on the Map and in briefs when community posts are included — so local happenings don’t have to wait for a calendar scraper.
How we built it
A2 Pulse is built on Jac, and the large majority of our code is Jac.
- The city is a graph. People, places, venues, events, organizers, categories, road alerts and council items are nodes, linked by typed edges: lives at, commutes via, interested in, follows, hosted at, affects route.
- Walkers do the reasoning.
GenerateBriefstarts at a person and walks outward, scoring everything it reaches: alerts near your home or on your commute route, groups you follow, your interests and events close by, with a boost for things coming up soon. Every item keeps the reason it was picked, so the brief can tell you why.MapSnapshotandNetworkBrowseturn the same graph into the map and the explorer. by llm()for the language. Jac's byLLM functions write the brief from the top five items, turn typed requests into map filters, and summarize map pins. Any LiteLLM model works. With no model configured, the brief comes from a conversational template and requests are matched by keywords, so the app never depends on an LLM to work.- Speech-ready text. Before the brief goes to ElevenLabs, a cleanup pass expands abbreviations and reads times and dates the way a person would say them.
- Live ingestion. Per-source parsers pull each calendar into the graph: The Ark and the Ann Arbor Observer through their calendar APIs, UMS and Eventbrite from their pages, and Happening @ Michigan from its JSON feed, with every building geocoded through OpenStreetMap so events land where they actually happen.
- The UI is Jac too, built with Jac's client-side components, jac-shadcn and Tailwind.
Challenges we ran into
- Everything stacked on one pin. Our first Happening @ Michigan import put every event at the same campus coordinates. We geocode each building now, but the feed fought back: "Off Campus Location" as a building name, addresses prefixed with a venue name, online events and away games in other states. Events we can't place stay off the map instead of getting a fake pin.
- Substring matching is a trap. Matching venue names by substring put Olson Park at The Ark ("P*ark*"). Geocoded venues now only reuse a known venue that's actually nearby.
- Cloudflare. Happening @ Michigan blocks most server requests, so ingestion keeps the last good response and falls back to it. During the hackathon, that meant saving the feed from a browser and letting the app ingest the saved copy.
- Rate limits. OpenStreetMap's geocoder allows about one request per second. Overlapping syncs got us rate-limited, so syncs now refuse to overlap, cache every building, and back off when told to.
- Closures through buildings. Our first closure lines were a few hand-placed points that cut across city blocks. We now snap them onto the road network so they follow the actual street.
- "Free" isn't a default. Listings with no price were being read aloud as free. Now price is unknown unless the source states it.
- Two Jac versions, one repo. Our team ended up on different Jac releases with different syntax, which meant a lot of merge-conflict archaeology at 3 AM. Lesson learned: pin the toolchain on day one.
Accomplishments that we're proud of
- A brief that explains itself: every item says why it's there.
- One graph powering three views: voice, map and explorer.
- Live data from real local sources, not just a mockup.
- It works with or without an LLM.
What we learned
Graphs are a natural fit for "what's relevant to me": relevance is just a walk from you outward. We also learned that most of the work in local data is cleaning it: addresses, placeholders, prices and dates that each source formats differently.
What's next for A2 Pulse
- Live civic and transit feeds (council agendas, TheRide alerts, road closures) to replace our demo data.
- Stronger calendar coverage and parsers where sources are still brittle.
- A morning brief that arrives on its own, not only on demand.
- A pilot with a residence hall or student org for real daily use.
Built With
- byllm
- elevenlabs
- geminiapi
- github
- google-maps
- google-roads-api
- jac
- jachammer
- jaseci
- litellm
- nominatim
- openstreetmap
- osrm
- python
- shadcn
- tailwindcss


Log in or sign up for Devpost to join the conversation.