-
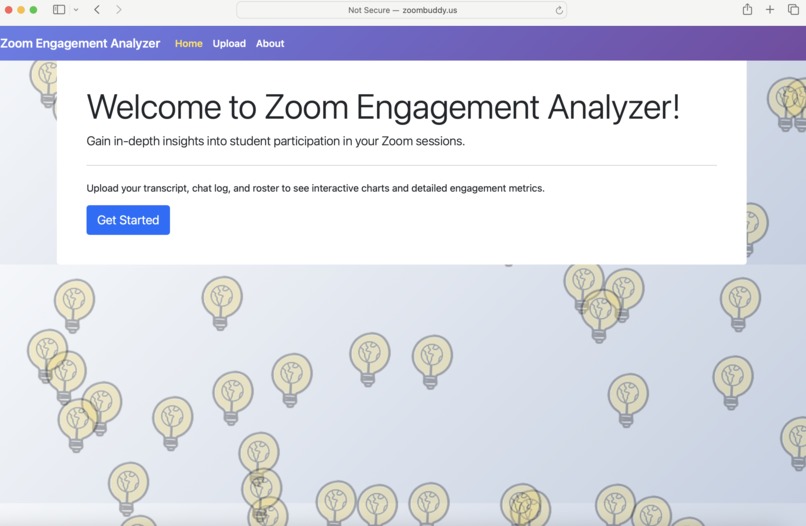
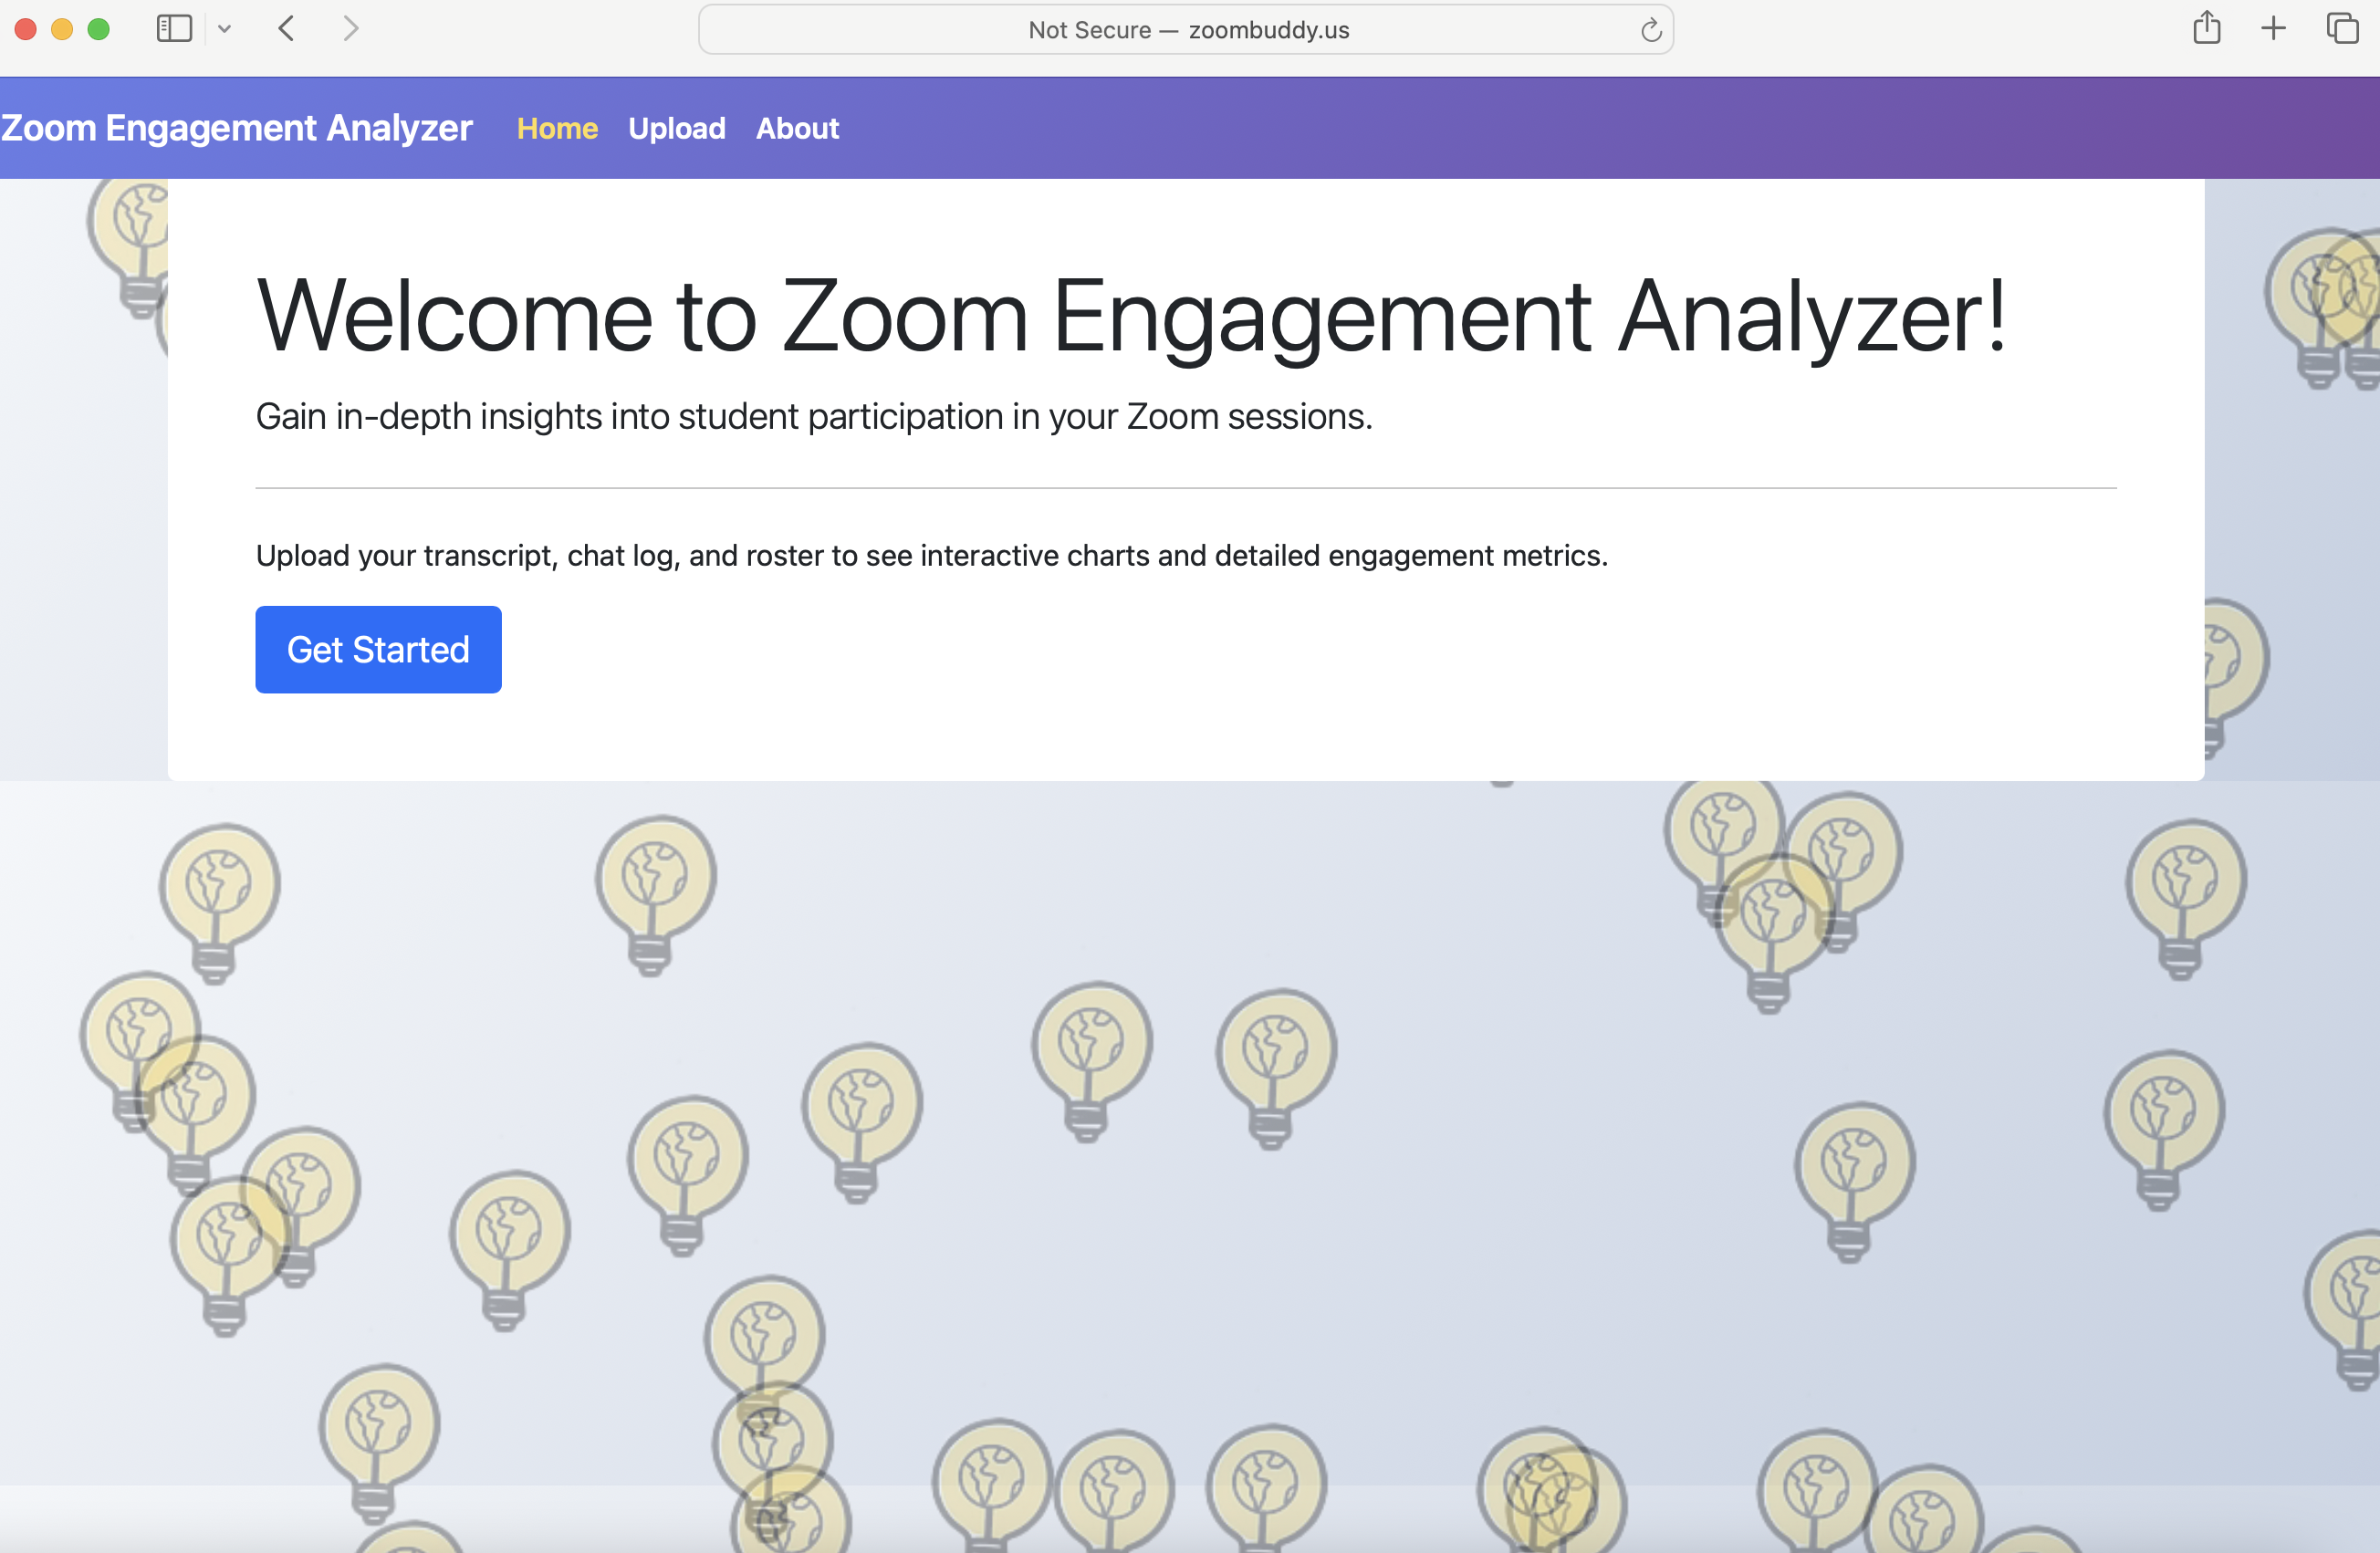
website
-

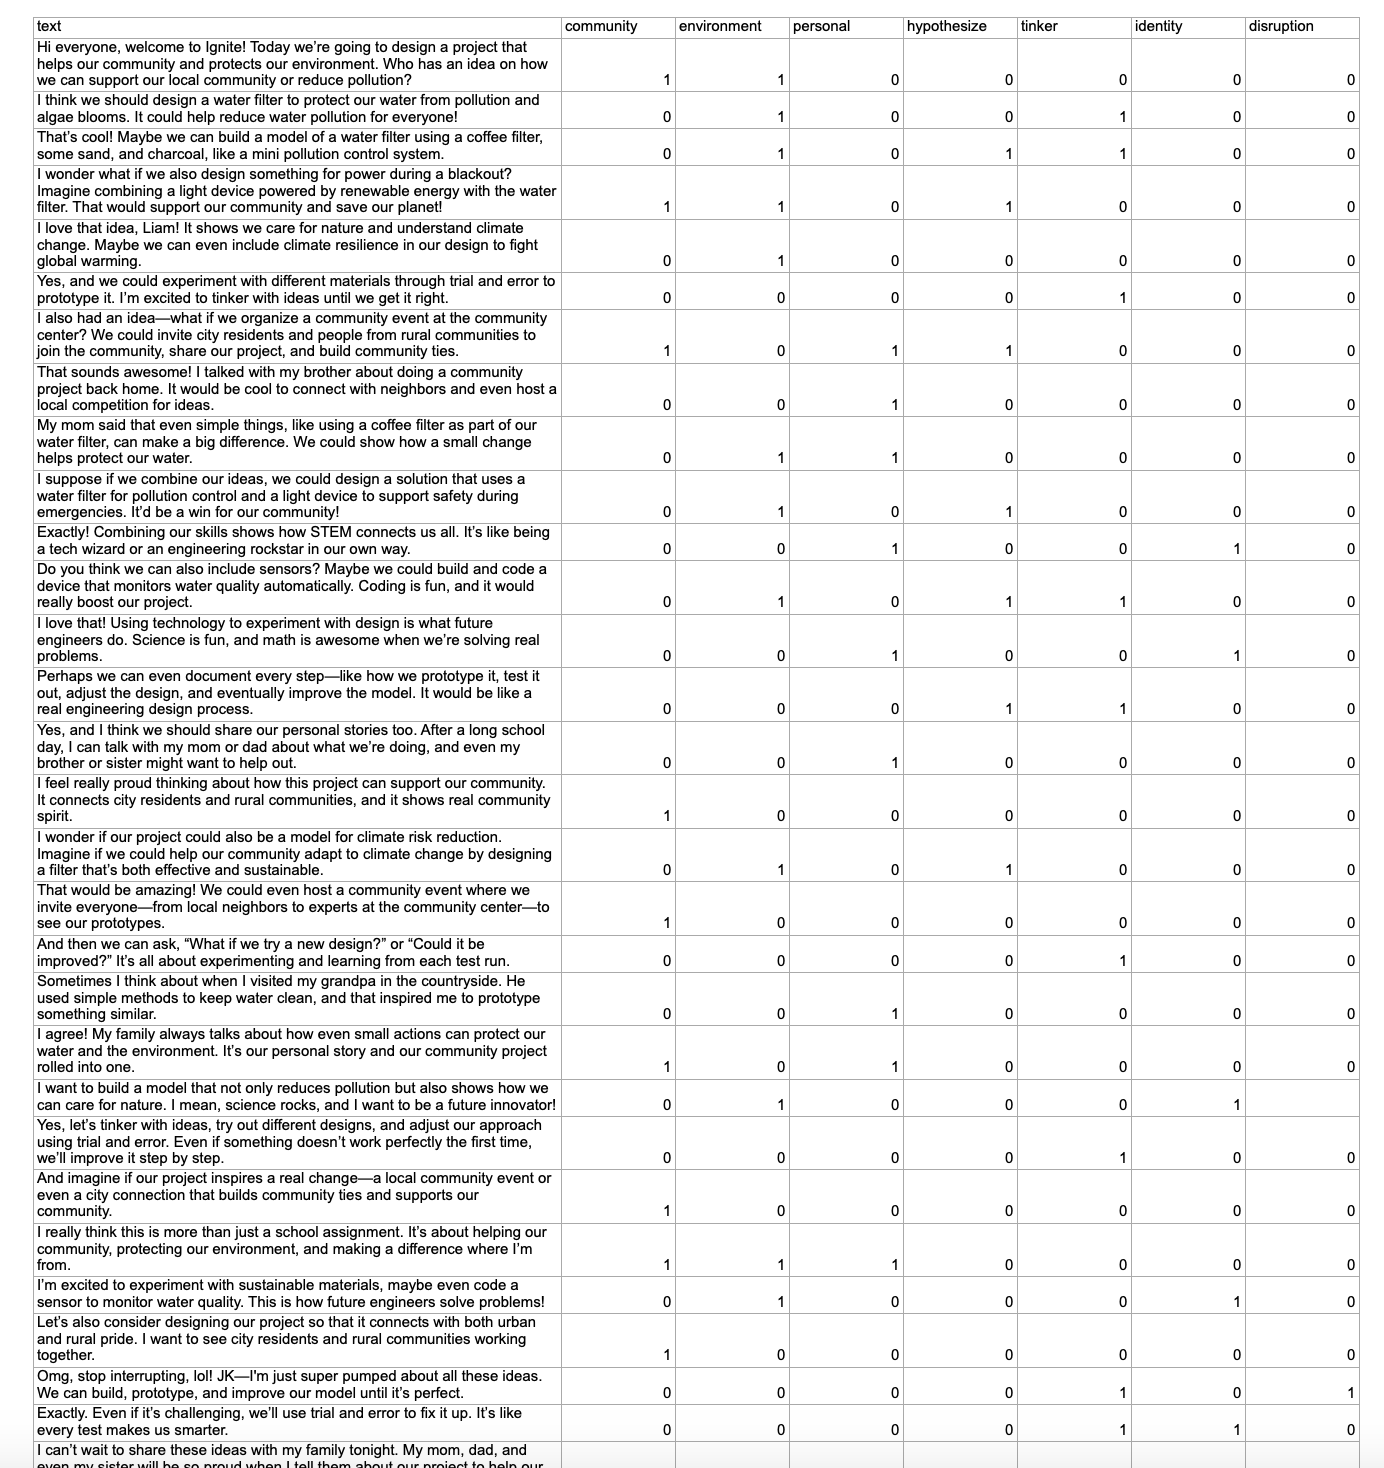
training data
-

training transcript

NOTE: The website www.zoombuddy.us doesn't work in Chrome, but does in Safari and Edge.
Inspiration
We wanted to free up teachers and researchers from endless note-taking during class. At Durham Ignite—a program that sparks middle schoolers’ interest in STEM through hands-on tinkering and engaging sessions—we saw a real need for a tool that could quickly show how engaged each student was during lessons. That’s where ZoomBuddy comes in, turning Zoom transcripts and chat logs into an easy-to-read engagement chart.
What it does
ZoomBuddy takes the text from Zoom transcripts and chat logs and turns it into a simple chart that gives each student an engagement score. It uses cosine similarity to compare what students say to the key topics in the lesson plan. If a student’s contributions match up well with the lesson, they get a higher score. This lets teachers and researchers instantly see who’s really connecting with the material and who might need a little extra help.
How we built it
We built ZoomBuddy using Python Flask, a lightweight web framework that makes it easy to handle both the backend data processing and the front-end display. Here’s the rundown:
- Data Input: The app takes in Zoom transcripts and chat logs.
- Processing: We convert the text into numerical vectors using natural language processing techniques.
- Cosine Similarity: By calculating the cosine similarity between these vectors and the vectors from the lesson plan, we get a score that shows how relevant each student’s contribution is.
- Output: The final engagement scores are compiled into a visual chart that’s easy to read and understand.
Challenges we ran into
- Data Processing: Zoom transcripts and chat logs can be messy, so cleaning and tokenizing the data was a challenge.
- Accuracy: Making sure our cosine similarity calculations accurately reflected student engagement required a lot of fine-tuning.
- Integration: Combining real-time data processing with Python Flask to deliver a smooth user experience was tricky but ultimately rewarding.
Accomplishments that we're proud of
- Automation: We managed to automate a task that used to take up a lot of teachers’ and researchers’ time.
- Real Impact: By showing who’s engaged in real-time, ZoomBuddy helps educators focus their attention where it’s needed most.
- Technical Achievement: Successfully using cosine similarity and Python Flask to turn raw text data into meaningful insights is something we’re really proud of.
What we learned
- Natural Language Processing: We deepened our understanding of how to convert text into numerical data and analyze it.
- Flask Integration: We learned a lot about building efficient, real-time applications with Python Flask.
- Iterative Development: Each challenge pushed us to improve our code and processes, teaching us the value of continuous improvement in a project.
What's next for ZoomBuddy
- Enhanced Models: We plan to explore multilabel classification models to make our engagement scoring even more accurate.
- Data Expansion: We’ll aggregate data from multiple classes to build a richer, more comprehensive database.
- Better Visuals: More advanced visualization tools are in the works to help educators see engagement trends over time.
- Feedback Loop: We’re looking forward to gathering more feedback from teachers and researchers to tailor ZoomBuddy even more closely to their needs.
With these next steps, we’re set to make ZoomBuddy an even more powerful tool for boosting student engagement in STEM education.


Log in or sign up for Devpost to join the conversation.