Inspiration
Many instructors have found it challenging to gauge student attention and confusion through online lectures. With the ability to turn cameras off, watch recorded lectures, or even watch in the comfort of your own bed, students have become much less engaged than they would be in a normal lecture setting. Our project aims to help professors see key points of engagement or confusion during a lecture, by visualizing the chat activity with graphs.
How we built it
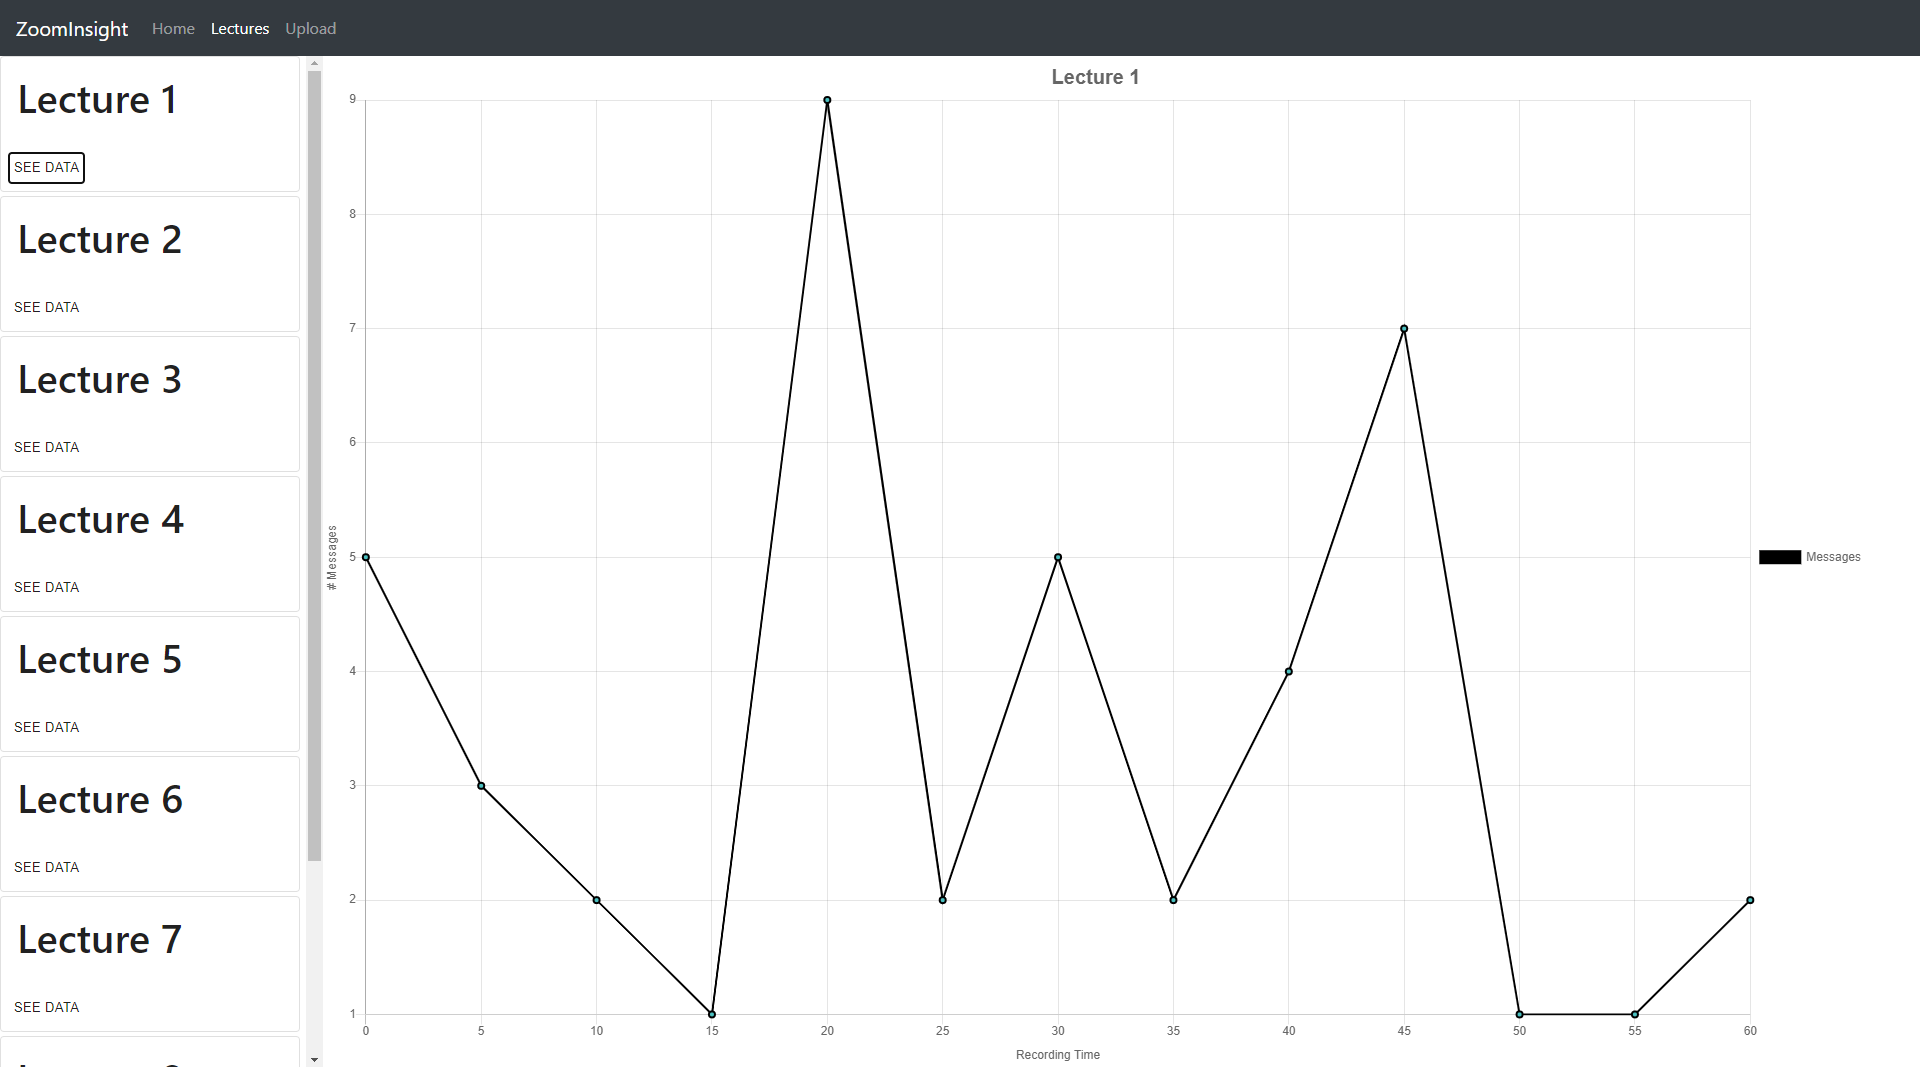
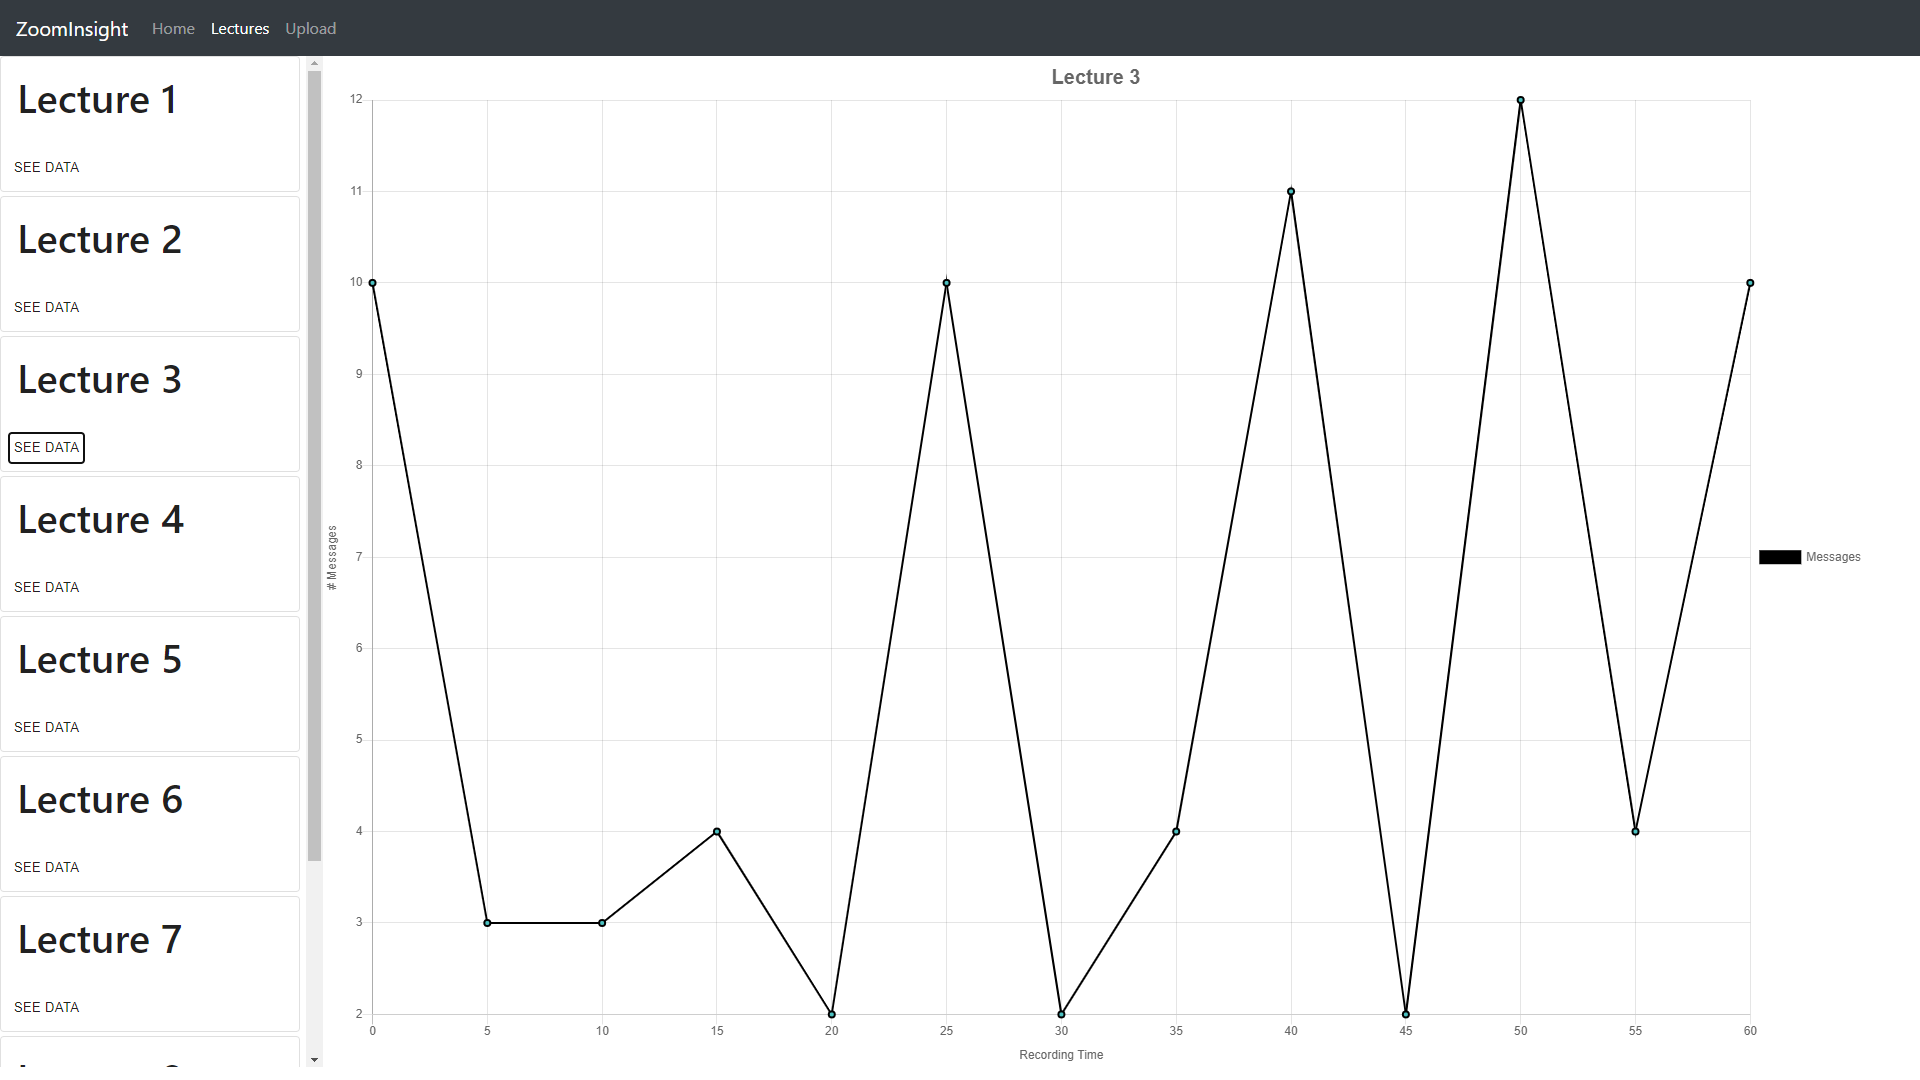
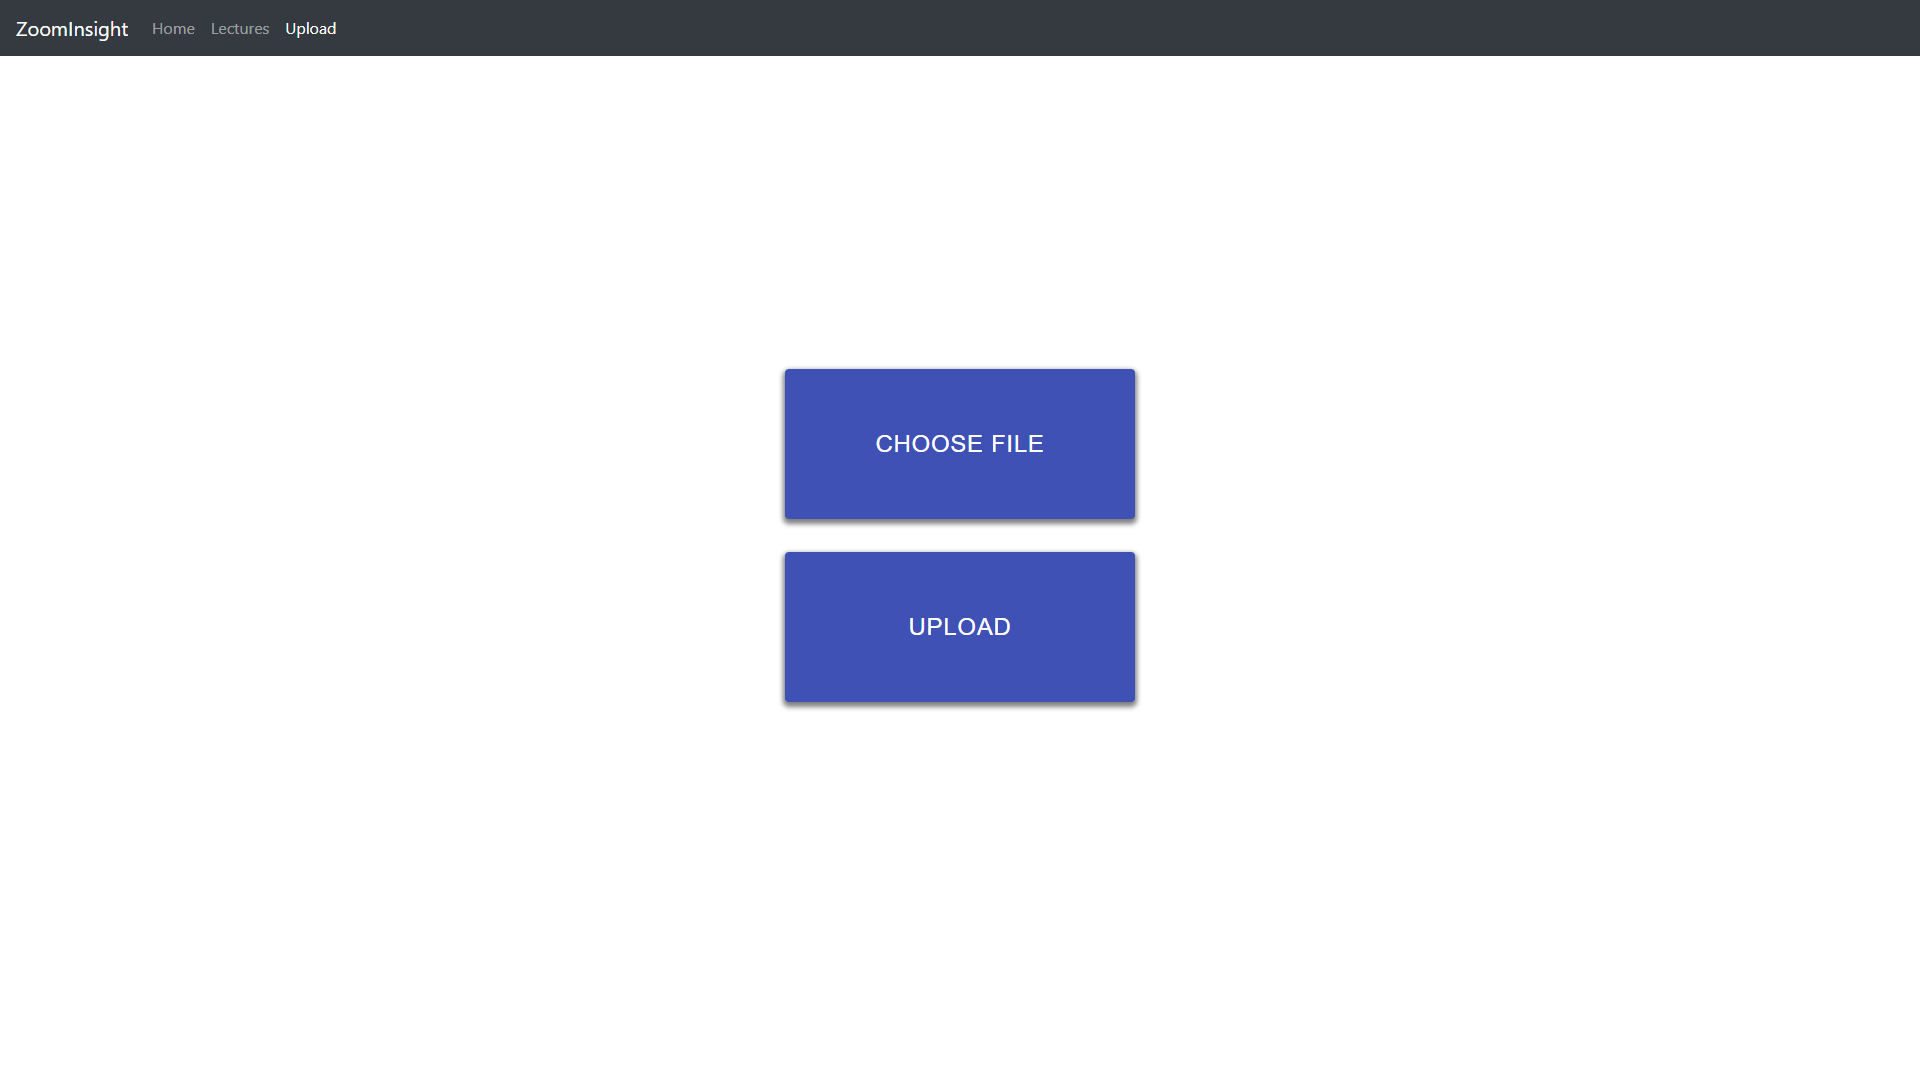
We utilized React.js (with Material-UI) to implement a frontend and used Firebase as well as node.js for the backend. On the front end, professors can submit their Cloud Recording .txt files into our website, and it will be visualized as a graph, with the x-axis representing the current time of the lecture and the y-axis representing the number of messages in that current time period. Professors will be able to see the different concentrations of messages during each section of the lecture.
Challenges we ran into
Our main challenge was accessing Zoom’s API. Countless hours were spent trying to correctly make HTTP requests in order to grant permissions through OAuth 2.0. Another thing we were stuck on was reading in uploaded files on our Firebase storage and processing them through a backend function.
Accomplishments that we’re proud of
We are happy to have been able to learn new technologies (OAuth 2.0, HTTP requests, node.js, Firebase) during this hackathon. Although we were unable to implement all the features we wanted to, we are still content with the experience we gained and the new skills we have developed.
What we learned
We learned that thoroughly reading documentation can be extremely useful when working with unfamiliar libraries and concepts. We also learned the difficulties of authenticating with OAuth 2.0 and the difficulty with connecting frontend requests to backend actions and responses.
What's next for ZoomInsight
Ideally, we would like to fully implement the features we wanted to for this hackathon. This includes OAuth 2.0 (to access the Zoom API) and text file processing to allow the user to add and view more lectures. We would also want to add a feature that allows users to click on a specific point on the graph, and view the messages at that point of the lecture.
Built With
- firebase
- javascript
- material-ui
- node.js
- postman
- react
- zoom

Log in or sign up for Devpost to join the conversation.