nspiration Match prediction is one of the most classic problems in sports analytics, but most public demos stop at "here's our accuracy." We wanted to hold ourselves to a tougher standard: bookmaker closing odds already price in injuries, team news, and market wisdom, so instead of just reporting an accuracy number, we built a model that's benchmarked directly against Bet365's implied probabilities. That gave us an honest answer to the question every sports bettor and analyst actually cares about — does this model know something the market doesn't?
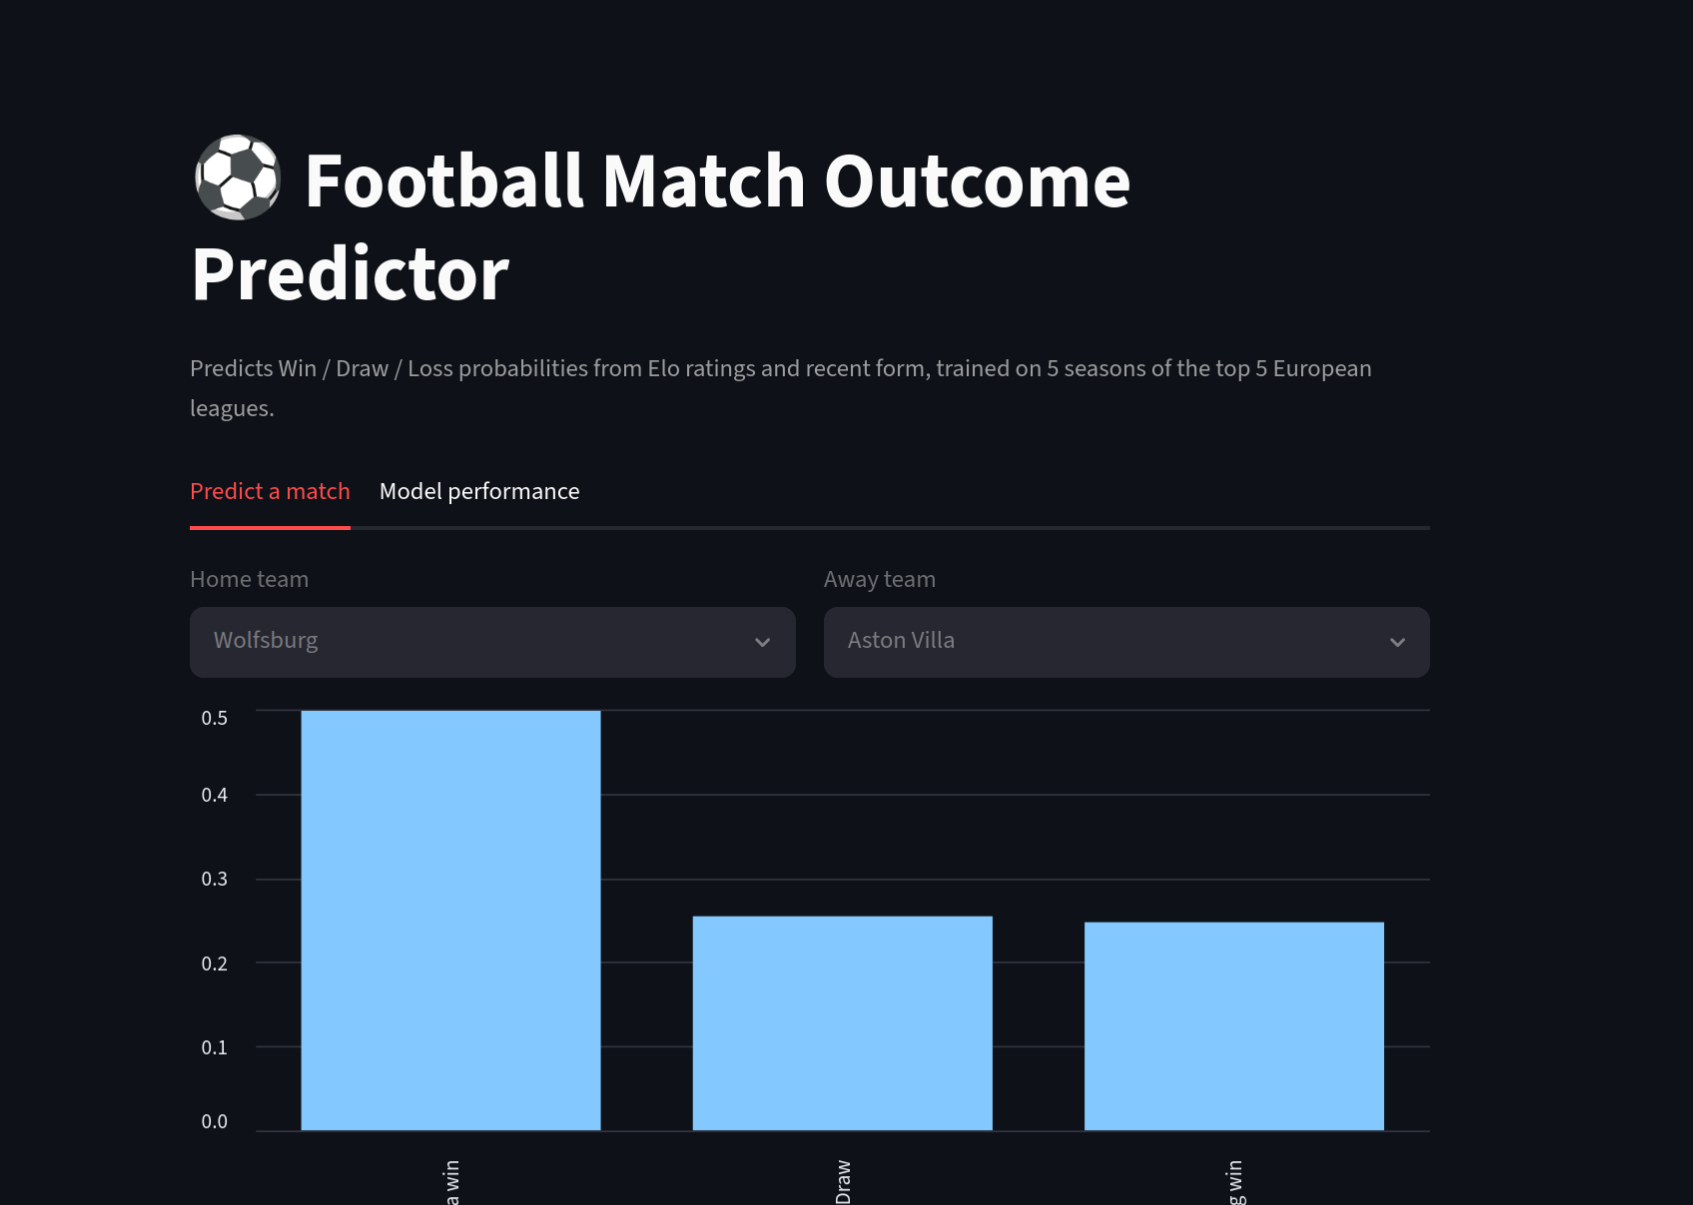
What it does ZML predicts Win / Draw / Loss probabilities for any matchup between two teams from the top 5 European football leagues (Premier League, La Liga, Serie A, Bundesliga, Ligue 1). Pick a home and away team in the app, and it shows:
Win/Draw/Loss probabilities as a single outcome bar Each team's current Elo rating and recent form (points/game, goal difference, shots on target over their last 5 matches) A "Model performance" tab comparing our model's log-loss/accuracy against the Bet365 bookmaker-odds benchmark, so the app's honesty about its own limits is part of the demo. How we built it Data: ~18,000 matches (2016/17–2025/26 seasons) pulled from football-data.co.uk — free, no API key, includes results, shot/card stats, and Bet365 closing odds. Feature engineering: built match-by-match, in chronological order, using only information available before kickoff — Elo ratings (updated after every result, with a home-advantage bonus), rolling points/game and goal-difference over the last 5 games, rolling shots/shots-on-target, and home/away-specific form splits. Modeling: Logistic Regression and Histogram Gradient Boosting, evaluated on a strictly chronological train/test split (train: 2016/17–2023/24, test: 2024/25–2025/26) so the model is always scored on matches it has never seen. Interface: a Streamlit app with Plotly visualizations — a diverging home/away color scheme, a stacked probability bar, small-multiple "tale of the tape" comparisons, and a bookmaker-benchmark reference line on the performance chart. Challenges we ran into Avoiding data leakage: every feature (Elo, form, rolling stats) had to be computed strictly from prior matches only, which meant processing the whole dataset sequentially rather than with simple vectorized rolling windows. Missing data across leagues/seasons: shot and shots-on-target columns aren't populated consistently across every league-season combination, so we had to build sane fallbacks instead of dropping matches. Beating a genuinely hard benchmark: bookmaker odds are extremely well-calibrated. Getting our model even close (log-loss 0.990 vs. 0.972 for the market) took real iteration on the feature set. Readable charts inside Streamlit's constraints: getting Plotly bar labels to not clip off-axis (especially for negative goal-difference values) took a few rounds of actually screenshotting the running app to catch rendering bugs that unit tests wouldn't have caught. Accomplishments that we're proud of A complete, end-to-end pipeline — ingestion → leak-free feature engineering → model training → live app — built and verified running in a single hackathon session. Choosing to benchmark against bookmaker odds instead of just reporting accuracy, which makes the result far more credible and interpretable. A visually clean, accessible UI (colorblind-safe diverging palette, direct labels, no dual-axis charts) instead of default boilerplate charts. What we learned How much signal Elo + simple rolling form actually captures — enough to land within ~2% log-loss of the betting market using only public match data, no lineups or injury reports. Why chronological validation is non-negotiable for forecasting problems, and how easy it is to accidentally leak future information into "current form" features if you're not careful with row ordering. Practical Streamlit + Plotly integration details (theming, avoiding label clipping, keeping small multiples on independent axes instead of dual-axis charts). What's next for ZML Add player-level data (lineups, injuries, suspensions) to close the remaining gap with bookmaker odds. Expand beyond the top 5 leagues and add promotion/relegation-aware Elo carry-over between seasons. Add live in-season "what if" scenarios (e.g., title-race or relegation-race probability simulations over the rest of a season). Calibrate probabilities (isotonic/Platt scaling) and add a backtested betting-value indicator (where the model disagrees with the market, and by how much).


Log in or sign up for Devpost to join the conversation.