-
-
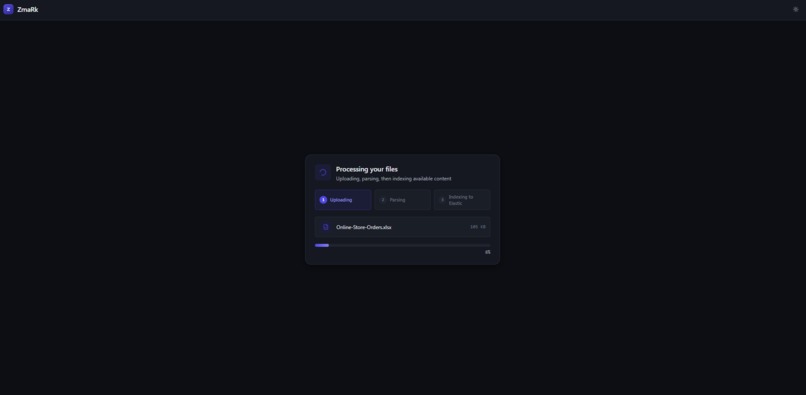
processing screen
-
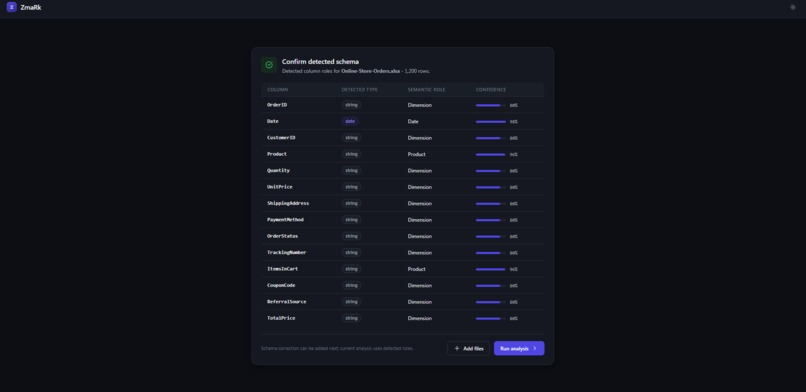
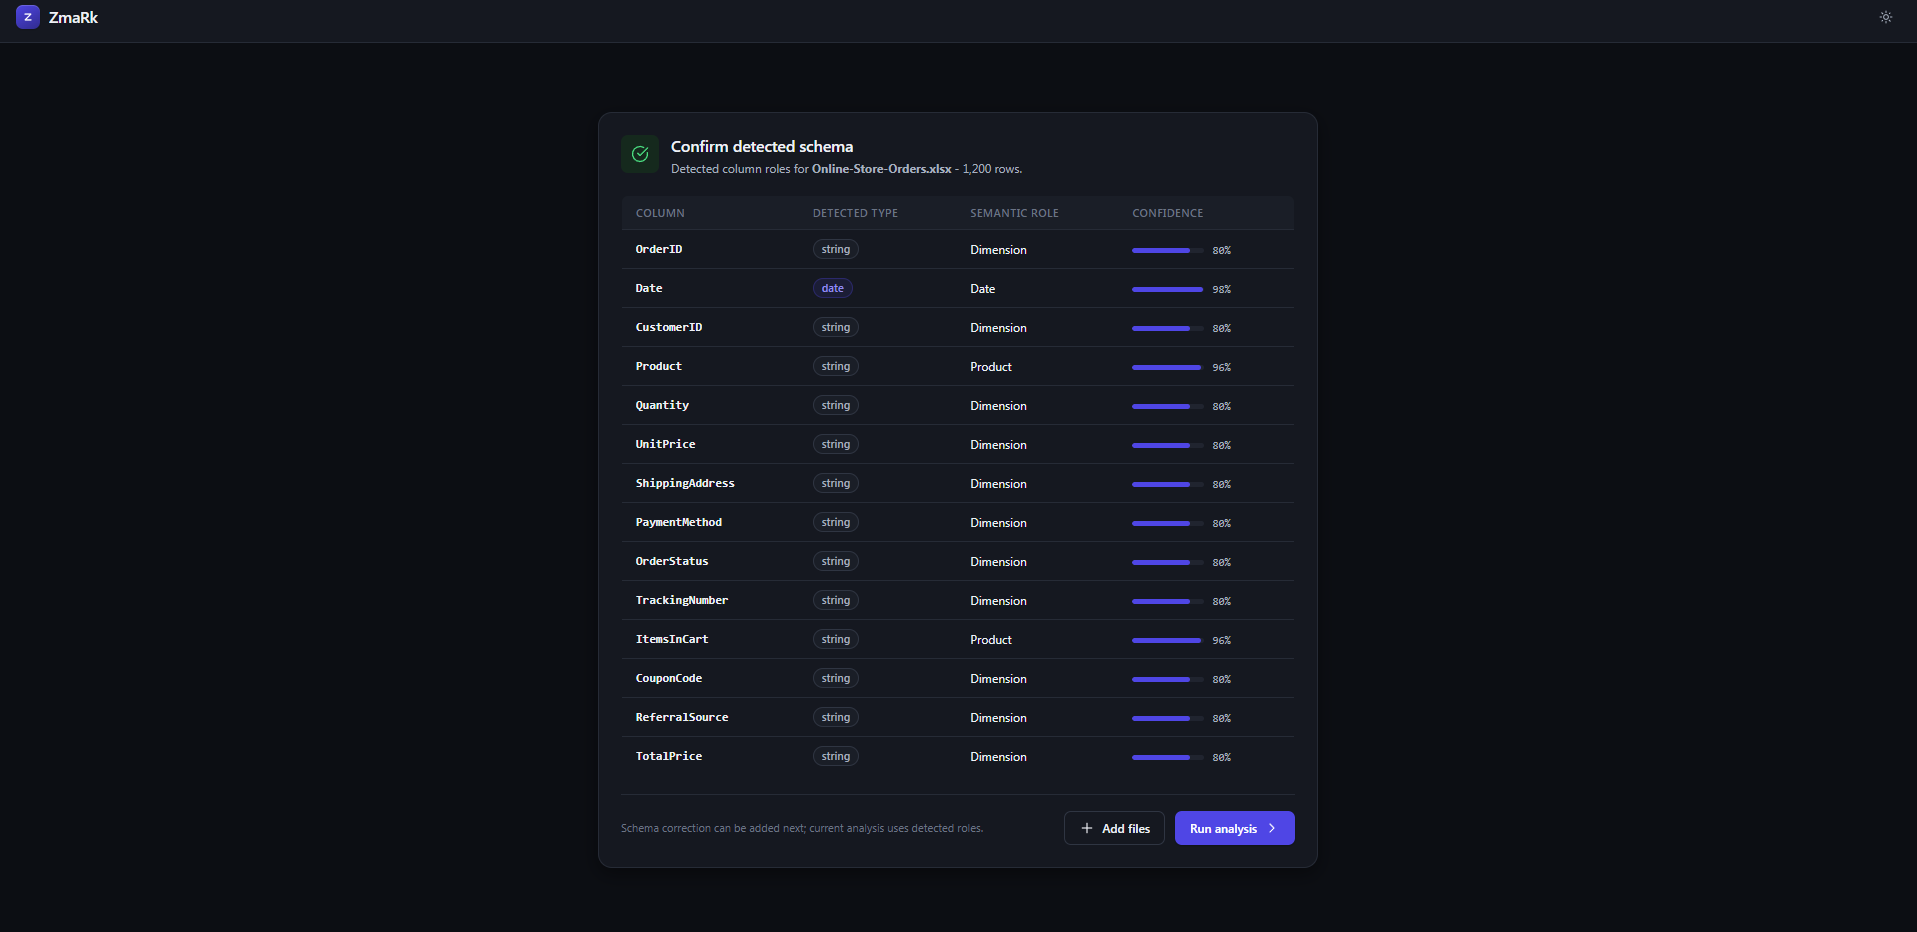
data description
-
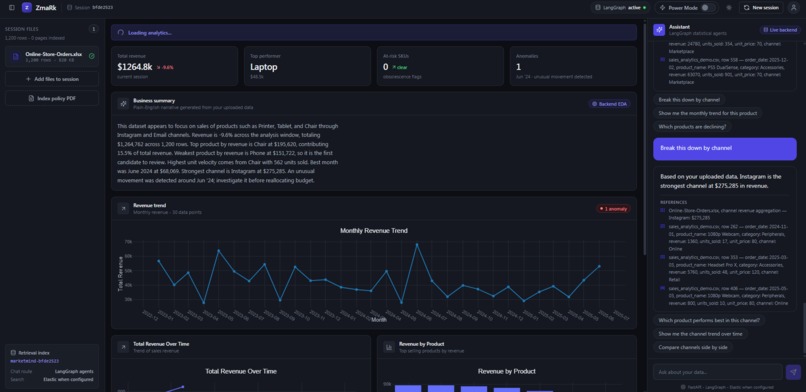
analysis and chatbot integration

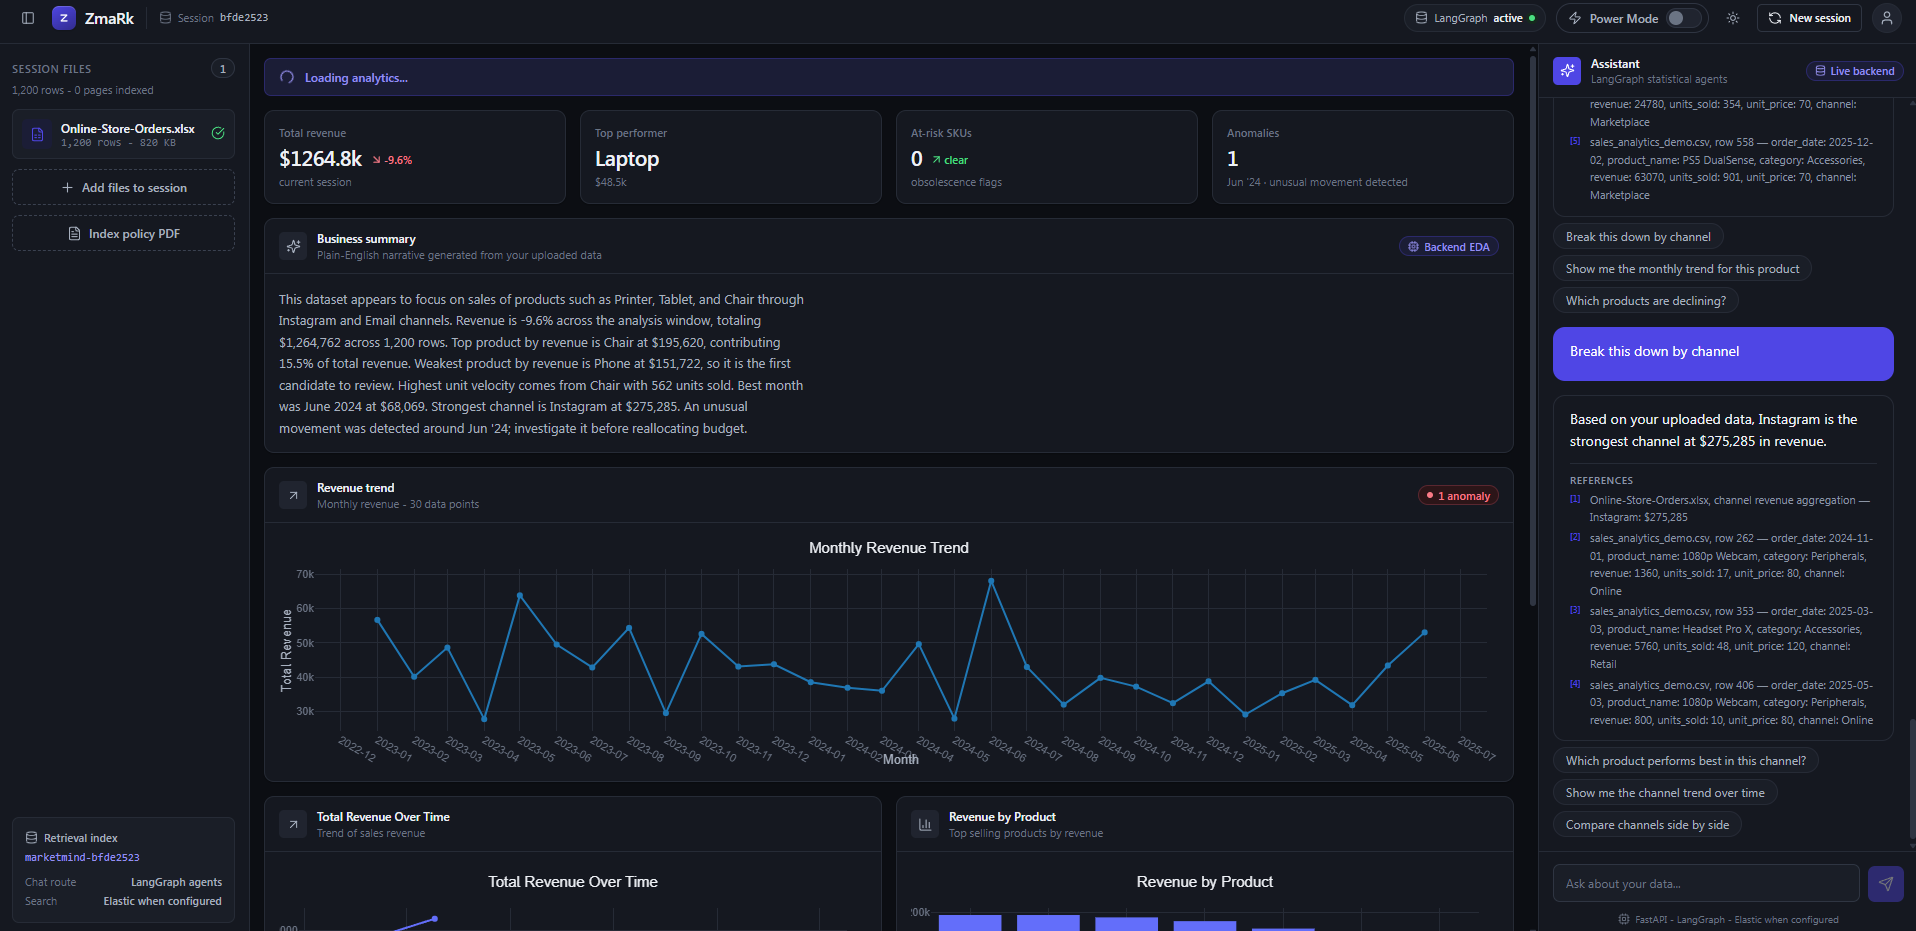
ZmaRk MarketMind: Intelligent BI & Agentic Analytics Canvas
Tagline: The agentic business intelligence canvas that turns raw marketing data and policy PDFs into sandbox-secure, statistically validated, and interactive visual insights.
💡 Inspiration
In modern marketing, managers and business owners are drowning in data but starving for insights. Every day, teams handle thousands of rows of sales data, product catalogs, and advertising budgets. Yet, extracting actionable insights usually requires a data science team or mastering complex BI tools like Tableau or PowerBI.
We saw three major gaps in existing solutions:
- Spreadsheet Fatigue vs. BI Jargon: Business users want direct, plain-English answers to their questions, not to write SQL queries or DAX formulas.
- Disconnected Compliance & Policies: Companies operate under complex rules (e.g., "Exclude May month profit from calculations due to standard audits" or "Do not invest in category X if its decline velocity exceeds $15\%$"). Traditional BI dashboards cannot read a policy PDF and dynamically filter structured spreadsheets based on those rules.
- Security in LLM Code Generation: Letting an LLM generate visualization code on-the-fly is highly desirable, but running raw generated Python code on server environments is a security nightmare.
ZmaRk MarketMind was inspired by the vision of an Agentic BI Canvas: a platform that merges tabular data analysis, natural language RAG over policy documents, a restricted Python execution sandbox, and specialized statistical forecasting models into a single, cohesive, dark-mode workspace.
🛠 How We Built It
We built ZmaRk MarketMind from the ground up using a modern, distributed architecture:
graph TD
    User([User Interface]) -->|1. Upload File CSV/Excel| API[FastAPI Ingestion Route]
    User -->|1b. Upload Policy PDF| Rules[Business Rules Engine]
    Rules -->|Parsed exclusions| Cache[(Rules Cache)]
    API -->|Index| ES[(Elasticsearch)]
    API -->|EDA Summary| Pandas[Pandas Analysis Engine]
    Cache -->|Filter DataFrames| Pandas
    User -->|2. Natural Language Chat| Graph[LangGraph Agentic Flow]
    Graph -->|Load & filter data| LoadNode[load_data_node]
    Cache -->|Apply rules| LoadNode
    LoadNode -->|Classify Route| Branch{Router}
    Branch -->|Text Q&A / Search| StatsNode[Statistics & Retrieval Nodes]
    Branch -->|Chart Request| VizNode[Visualization Node]
    Branch -->|Hypothesis Test| HypNode[Hypothesis Testing Nodes]
    VizNode -->|Safe Python Code| Sandbox[Sandbox Safe Executor]
    HypNode -->|Safe SciPy Stats| Sandbox
    Sandbox -->|Plotly JSON + Summary| Store[(In-Memory Scratchpad Store)]
    Store -->|Link: /scratchpad/:id| ScratchpadPage[Interactive Plotly Canvas]
    StatsNode -->|policy_context| Gemini[Gemini Synthesis]
    Gemini -->|Answer with policy notice| User
1. The Technology Stack
- Frontend: Built with React (Vite), React Router DOM, and styled with custom glassmorphism CSS (
zmark.css). We integrated React-Plotly.js for high-fidelity interactive charts. - Backend: Powered by FastAPI for high-throughput async processing and routing.
- AI Orchestration: Orchestrated via LangGraph, utilizing Gemini models via the Google Generative AI SDK as the primary brain.
- Retrieval & Search: Documents and datasets are indexed in Elasticsearch (Elastic Cloud), enabling a hybrid retrieval pipeline combining keyword (BM25) and dense vector embeddings.
- Mathematical & Statistical Engines: Run using Pandas, NumPy, and SciPy for precise calculations, simulations, and statistical verification.
2. Core Modules & Features
🔹 Ingestion & Automated EDA
Upon drag-and-drop file upload, the backend automatically detects the schema, infers data types, and triggers a Pandas/NumPy-driven EDA pipeline. It auto-generates charts (revenue over time, category breakdowns, anomalies) and prompts Gemini to produce a plain-English executive summary of the dataset.
🔹 LangGraph Agentic Graph
We built a state-machine using LangGraph to route natural language queries to specialized agent nodes:
- Classify Node: Evaluates the user's intent using keyword pattern matching and semantic classification.
- Statistics Node: Translates natural queries into quick mathematical operations on Pandas DataFrames.
- Retrieval Node: Queries Elasticsearch for relevant context from uploaded policy PDFs or documents.
- Visualization Node: Instructs Gemini to write clean Plotly visualization code targeting the dataset columns, executes it in the sandbox, and generates a link to the canvas.
- Hypothesis Testing Node: Routes statistical test inquiries through an interactive intake form and executes SciPy computations.
🔹 The Business Rules Engine
This module parses uploaded company policy PDFs (e.g., "Exclude May month profit from calculations") using natural language heuristics.
- It extracts rules into a structured rule cache: $$\text{Active Exclusions} = { \text{months}: [5], \text{columns}: [\text{"profit"}, \text{"revenue"}] }$$
- The system dynamically filters all DataFrames before any analysis, dashboard updates, or graphing code runs.
- It attaches a policy notice footer to calculations and injects the rules as the highest-priority system context for Gemini chat synthesis, ensuring the conversational assistant always respects and flags these policy constraints.
🔹 Safe Execution Sandbox
To prevent remote code execution (RCE), we created a restricted Python environment (sandbox.py) that:
- Disables dangerous builtins like
open,exec,eval,compile, and__import__. - Whitelists only safe data science libraries:
pandas,numpy,plotly,scipy,math, andstatistics. - Executes LLM-generated code in this isolated namespace and serializes the resulting Plotly figures into standard JSON dictionaries for React-Plotly.js rendering.
🔹 ZScratchpad Canvas
To avoid cluttering the chat with large charts and extensive summaries, we implemented ZScratchpad (/scratchpad/:sessionId/:reportId). When a chart is generated, the chat assistant outputs a clean, markdown-free prose response alongside a card linking to ZScratchpad. The scratchpad displays the full-screen interactive chart and the associated narrative analysis side-by-side.
🔹 Power Mode Capabilities
For power users and analysts, toggling Power Mode unlocks three deep-dive modules:
- Monte Carlo Investment Simulator: Simulates $N=10,000$ trials based on historical daily revenue growth and standard deviation, modeling the probability of future growth under a specified budget change.
- Obsolescence & Depreciation Radar: Flags products showing declining sales velocity or category demand. It computes a custom risk score and maps them to actions (Liquidate, Discontinue, Discount, Monitor).
- Budget Reallocation Recommender: Employs ROI signals and LLM reasoning over Elasticsearch documents to rank which products or channels should have budgets increased, maintained, or reduced.
📐 Mathematical Framework & LaTeX Support
To ensure ZmaRk MarketMind remains mathematically precise, we offload statistical tests and risk scoring to SciPy and deterministic formulas, referencing them in our reports:
1. Hypothesis Testing (Independent Two-Sample $T$-Test)
To test whether the difference in means between two groups (e.g., Sales in Region A vs. Region B) is statistically significant, we compute the $t$-statistic and $p$-value using SciPy:
$$t = \frac{\bar{X}_1 - \bar{X}_2}{\sqrt{\frac{s_1^2}{n_1} + \frac{s_2^2}{n_2}}}$$
Where:
- $\bar{X}_1, \bar{X}_2$ are the sample means of the two groups.
- $s_1^2, s_2^2$ are the sample variances.
- $n_1, n_2$ are the sample sizes.
- The degrees of freedom ($\nu$) are calculated via Welch–Satterthwaite equation: $$\nu \approx \frac{\left(\frac{s_1^2}{n_1} + \frac{s_2^2}{n_2}\right)^2}{\frac{\left(s_1^2/n_1\right)^2}{n_1 - 1} + \frac{\left(s_2^2/n_2\right)^2}{n_2 - 1}}$$
We reject the null hypothesis $H_0$ if the $p$-value is less than the chosen significance level $\alpha$: $$\text{Reject } H_0 \iff p < \alpha$$
2. Obsolescence Risk Scoring Formula
The obsolescence radar scores products on a scale of $0$ to $100$ using a weighted linear combination of decline velocity, category decline, and product depreciation (age factor):
$$\text{Risk Score} = w_v \cdot S_v + w_c \cdot S_c + w_d \cdot S_d$$
Where:
- $S_v \in [0, 100]$ is the sales velocity decline sub-score (based on velocity decline percentage).
- $S_c \in [0, 100]$ is the category-level demand trend sub-score.
- $S_d \in [0, 100]$ is the age-based depreciation sub-score (calibrated to the product lifecycle, e.g., $18$ months for electronics).
- The weights are configured as: $$w_v = 0.40, \quad w_c = 0.30, \quad w_d = 0.30$$ Ensuring that: $$\sum w_i = w_v + w_c + w_d = 1.0$$
3. Monte Carlo Forecasting Simulation
The simulator projects the revenue multiple over a time horizon $t \in {30, 60, 90, 180}$ days. The daily revenue multiple is modeled as:
$$R_t = R_0 \prod_{i=1}^{t} (1 + X_i + \Delta_b)$$
Where:
- $R_0$ is the initial revenue multiple ($1.0$).
- $X_i \sim \mathcal{N}(\mu, \sigma^2)$ represents a random draw from a normal distribution constructed from the historical daily growth rate mean ($\mu$) and variance ($\sigma^2$) computed from the uploaded dataset.
- $\Delta_b$ is the scale adjustment factor derived from the user's budget adjustment input: $$\Delta_b = \text{Budget Change \%} \times \text{Historical ROI Coefficient}$$
By running this calculation $10,000$ times, we extract the confidence intervals:
- Worst Case (5th percentile): $P(R_t < \text{Worst Case}) = 0.05$
- Best Case (95th percentile): $P(R_t < \text{Best Case}) = 0.95$
- Expected Value: Median of the simulated runs.
🚧 Challenges We Faced
- Enforcing Policies Dynamically: It is easy for an LLM to state a rule (e.g., "We must exclude May month"), but making the charting agent, the dashboard engine, and the statistical tests actually filter out the rows in real-time was incredibly difficult. We resolved this by building a unified DataFrame filter layer in
business_rules_service.pythat intercepts all pandas data loads inside the LangGraph execution path. - Plotly Code Sanitization: Letting Gemini write Python code often leads to syntax errors, unauthorized libraries, or dangerous commands. We solved this by designing a robust regex-based sanitizer and a strict sandbox. If code fails to compile, the system catches the exception and falls back to a deterministic, pre-templated Plotly script.
- Chat UI Clutter: Rendering charts, statistical reports, and footnotes in the middle of a chat log ruined the user experience. Implementing the ZScratchpad canvas was our solution. It split the interface into a focused, conversation-based chat panel on the left and a detailed visual analysis board on the right.
- Minimizing LLM Hallucinations in Calculations: Asking an LLM to compute statistics directly is highly unreliable. We restricted Gemini to writing Python code or generating parameters, and forced the actual mathematical calculations to occur inside NumPy, SciPy, and Pandas runtimes.
📈 What We Learned
- Stateful Agent Workflows: Designing conditional routing via LangGraph taught us how to construct robust, non-linear agent graphs. Breaking down analytics queries into classification, database lookup, code generation, and synthesis nodes dramatically improved response accuracy.
- The Power of Hybrid RAG: Combining structured spreadsheet querying (via Pandas) with unstructured document retrieval (via Elasticsearch vector/keyword search) unlocked a new level of BI capabilities where data and policies are analyzed together.
- Secure Coding for AI: Building the python execution sandbox emphasized the critical importance of whitelists over blacklists when running code written by LLMs.
- UX for Complex AI Outputs: We learned that user delight is heavily tied to visual layout. Standard chat bubbles are great for quick summaries, but dedicated interactive workspaces (like ZScratchpad and Power Mode panels) are necessary for complex data exploration.
Built With
- cloud
- elastic
- elser
- gcp
- gcs
- gemini
- javascript
- langgraph
- mcp
- plotly
- python
- react
- recharts

Log in or sign up for Devpost to join the conversation.