

Inspiration
The inspiration was to solve a real decision problem for housing developers: quickly finding which ZIP codes have the strongest current and future demand from high-income homebuying households, using a transparent, map-first tool instead of scattered and hard-to-explain analysis.
What it does
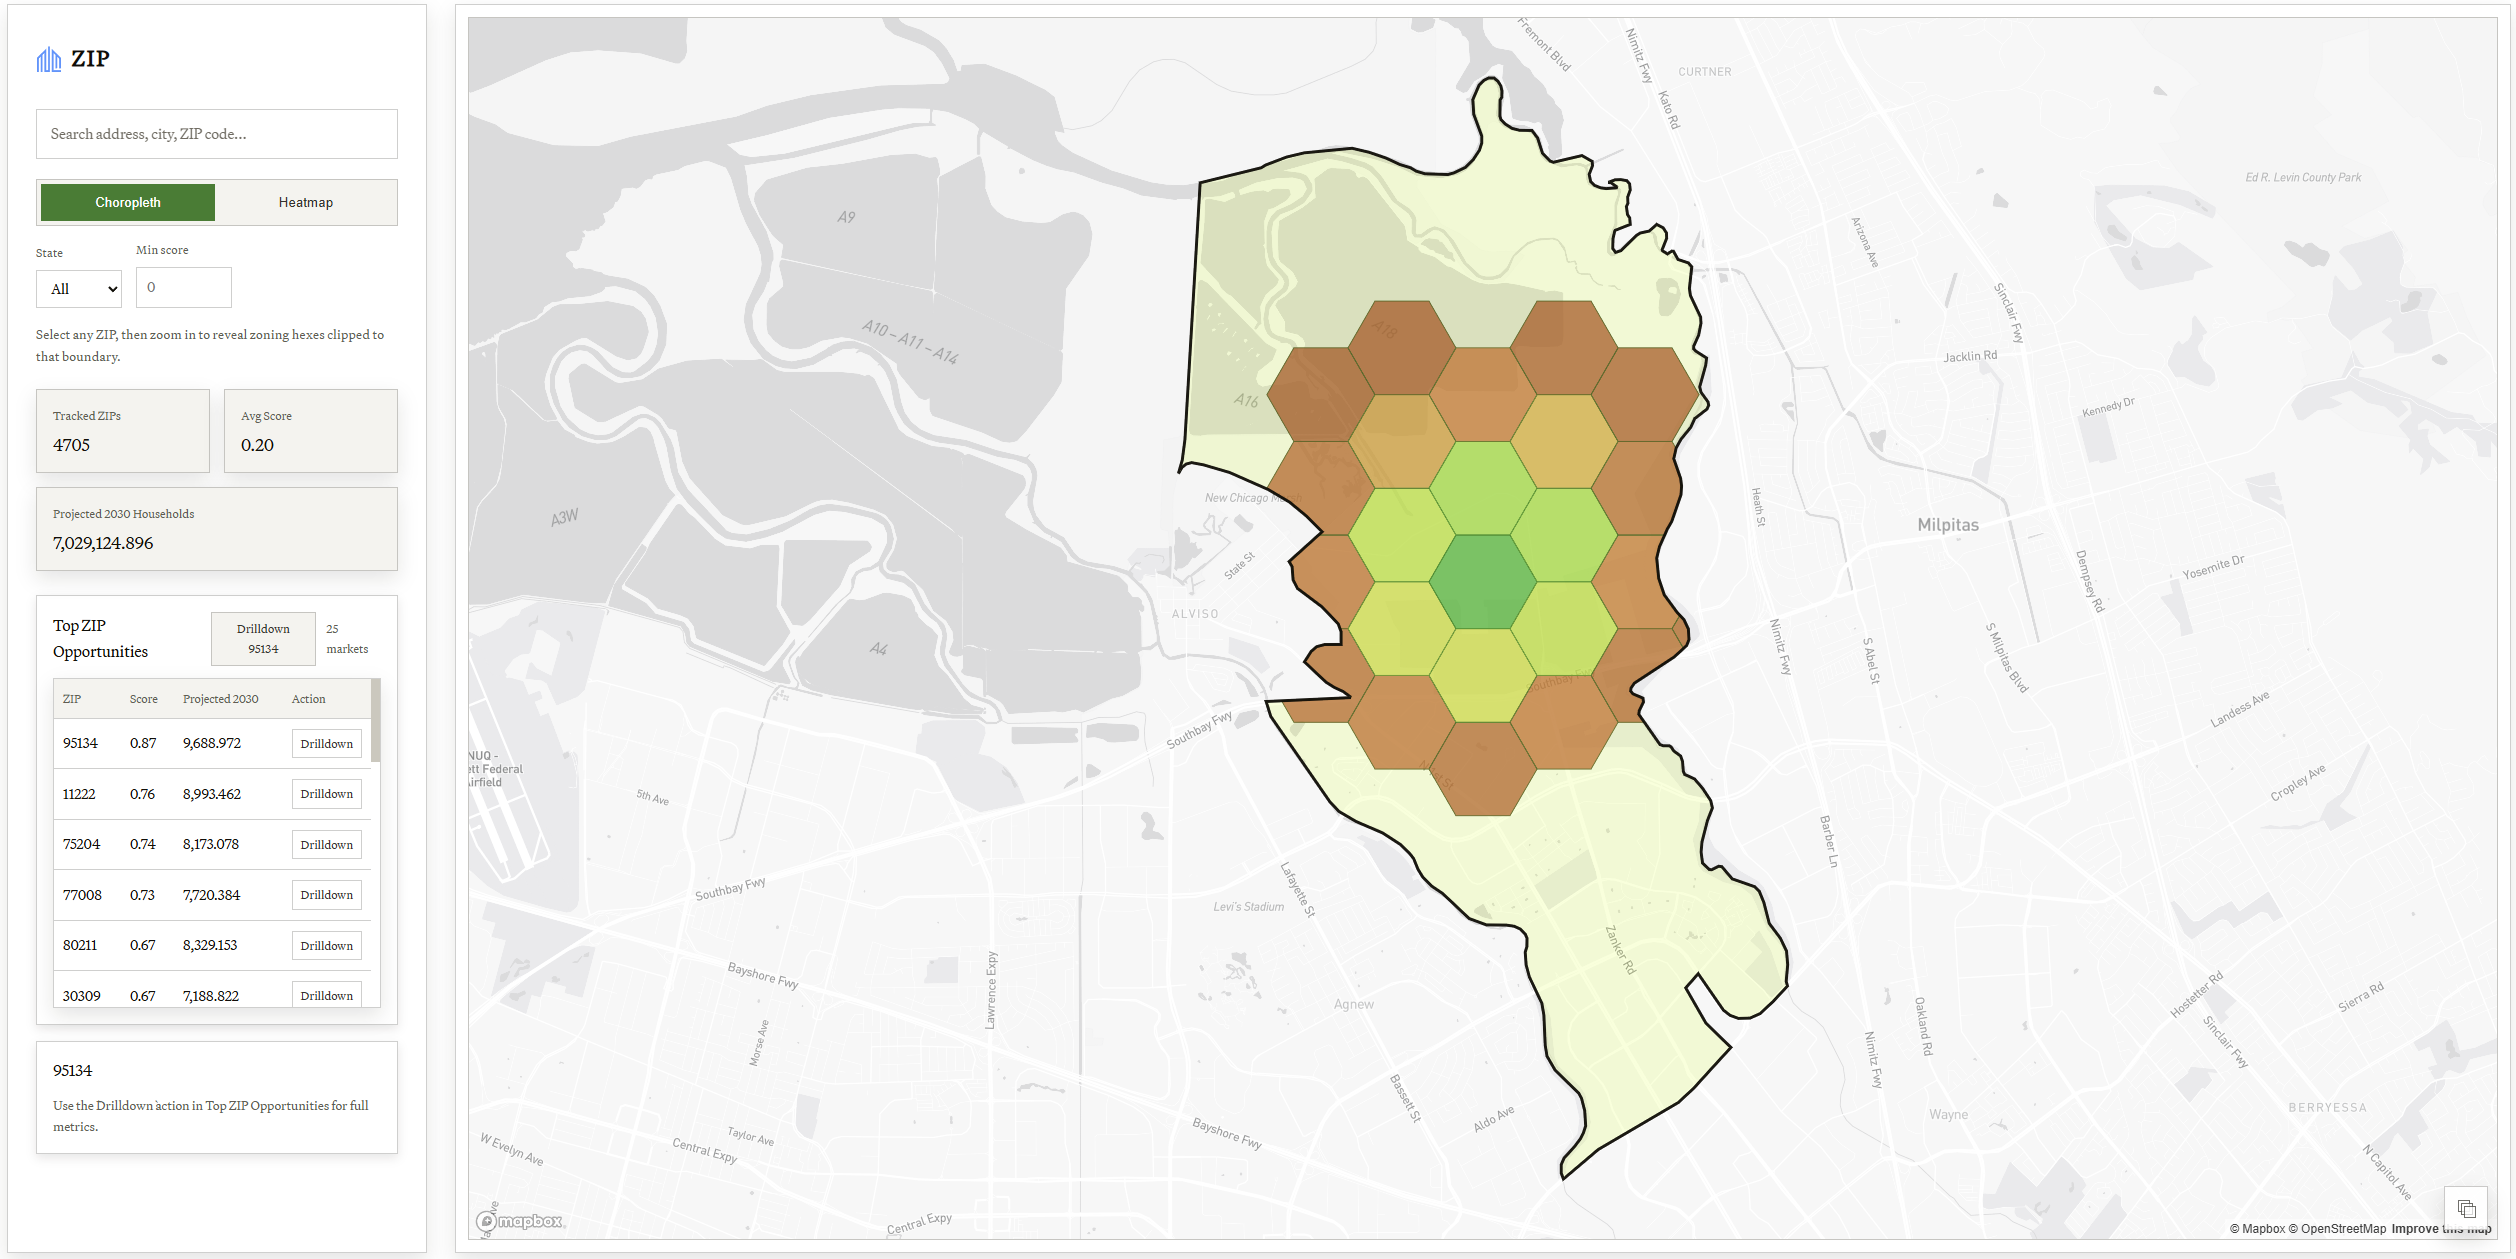
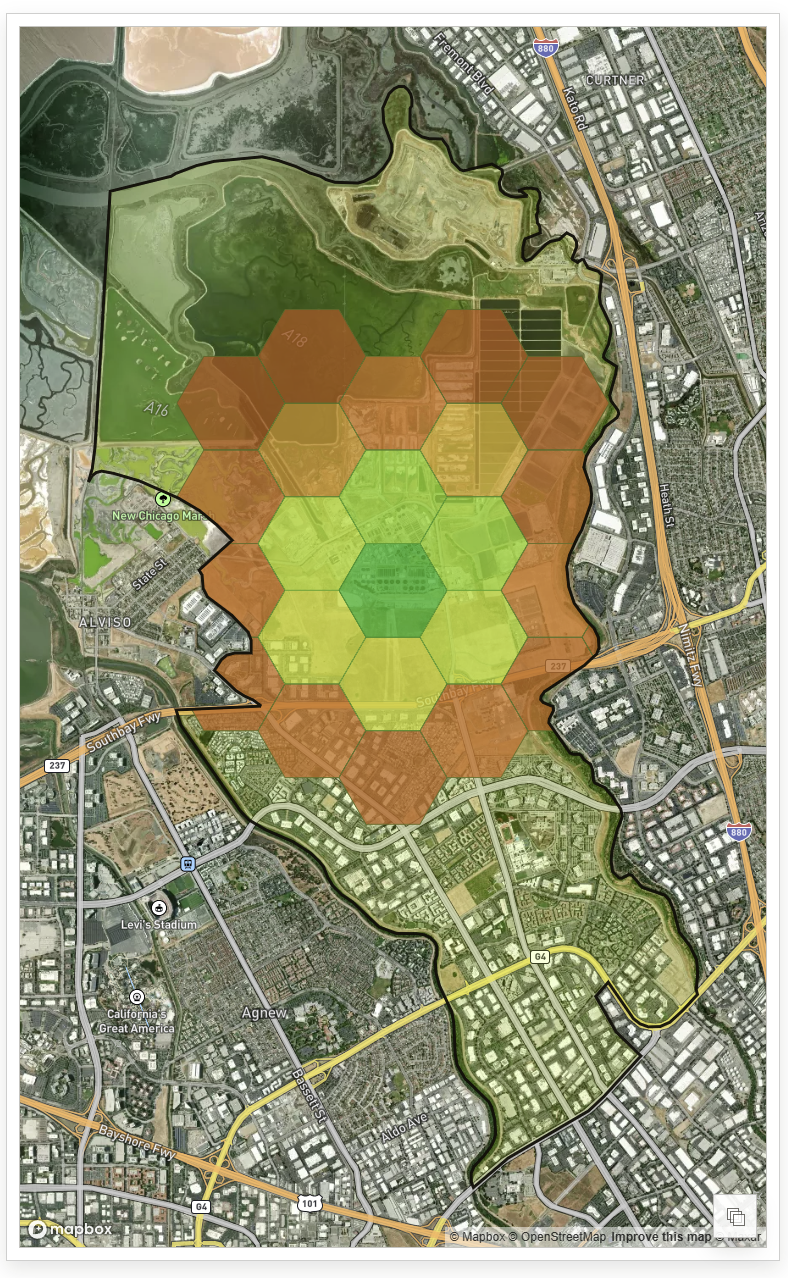
ZIP ranks zip-codes by housing investment potential, visualizes them on an interactive map, lets users search/filter markets, and provides ZIP-level drilldowns with key demand and growth metrics to support invest/watch/avoid decisions.
How we built it
We built it as a Next.js web app with React: a CSV ingestion/stitching pipeline feeds API routes, the frontend fetches and ranks ZIP data, Mapbox renders the interactive map, and drilldown views show key metrics/charts for each ZIP.
Challenges we ran into
A major challenge was model training accuracy. We started with low predictive performance (around an R value of 0.20), iterated on feature ranking/sorting approaches, improved to about 0.30, and after multiple tuning cycles reached our best result at roughly R = 0.70.
Accomplishments that we're proud of
- Built our first machine learning project end-to-end
- Designed and shipped a prediction model for ZIP-level opportunity ranking
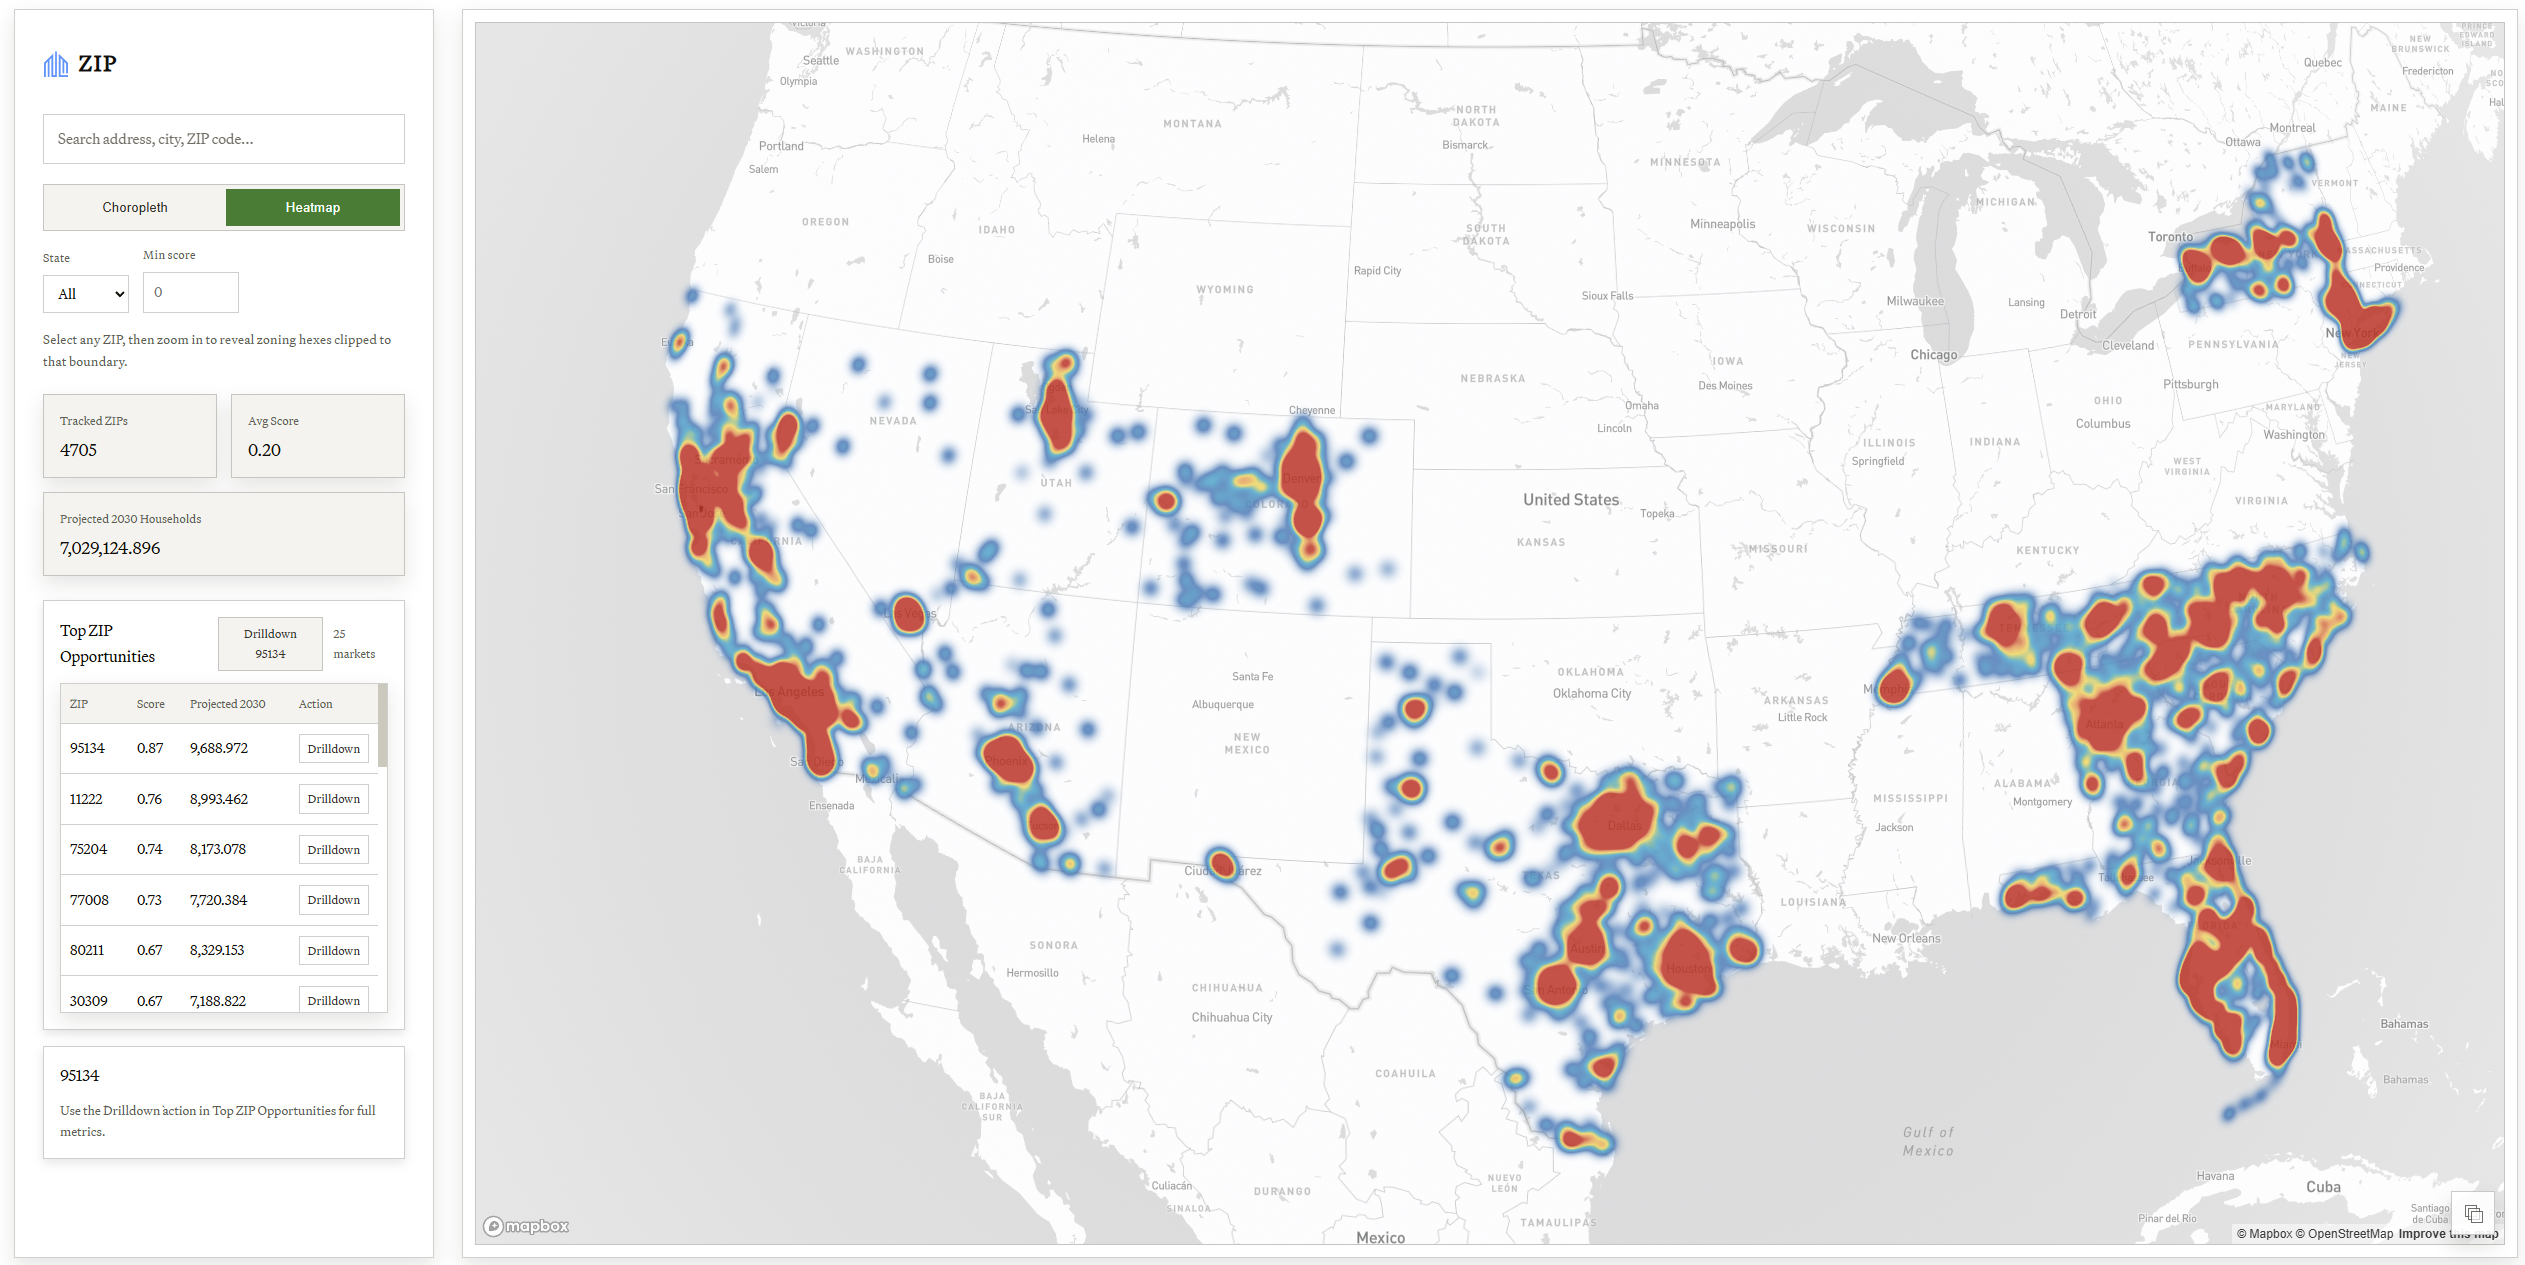
- Implemented both choropleth and heatmap map views
- Delivered a pure minimal product design with a strong dashboard experience
What we learned
- Learned to use Google Collab to train and iterate on a model
- Learned Mapbox and implemented geospatial visualization workflows
What's next for ZIP
Next for ZIP, we plan to improve prediction accuracy by adding more external factors, including environmental conditions and neighborhood convenience signals (schools, stores, freeway access), and extend the platform to the individual housing-unit level so users can estimate each property’s value based on location, renovations, and other home-specific attributes.
Built With
- codex
- csv
- cursor
- javascript
- mapbox
- node.js
- react


Log in or sign up for Devpost to join the conversation.