-
-
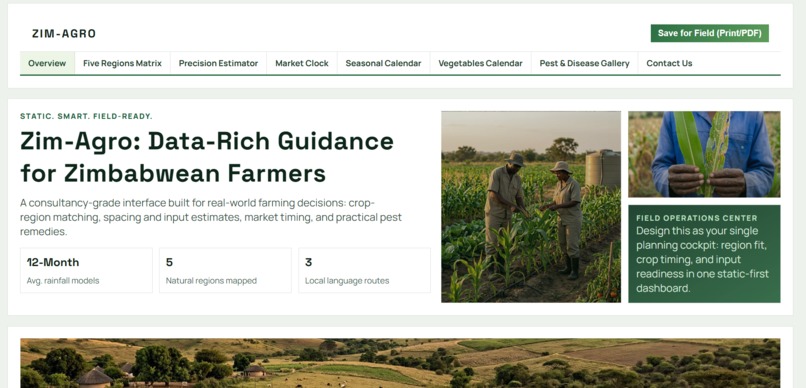
Dashboard
-
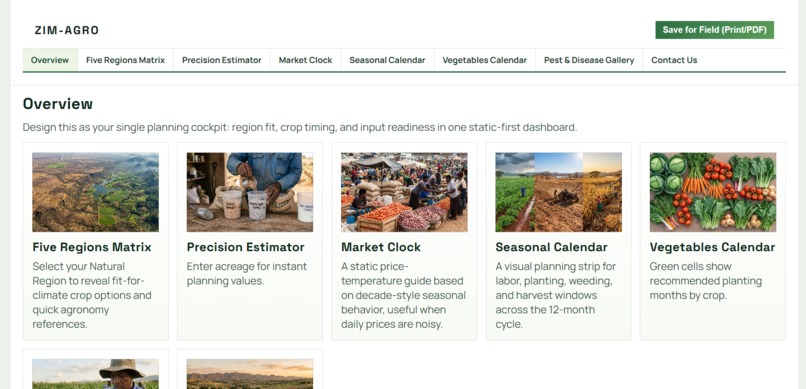
Overview
-
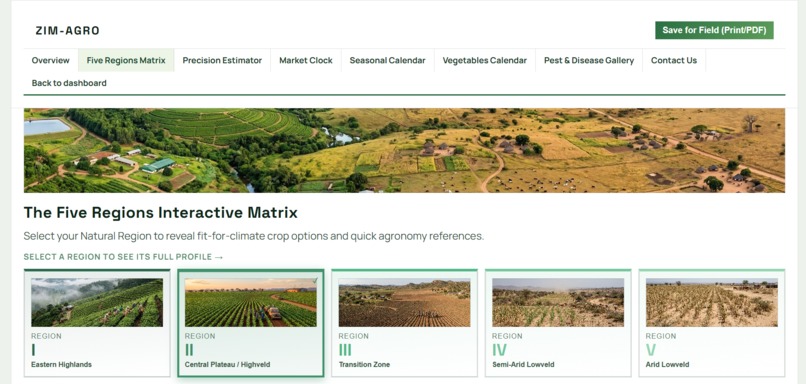
Five Regions Matrix
-
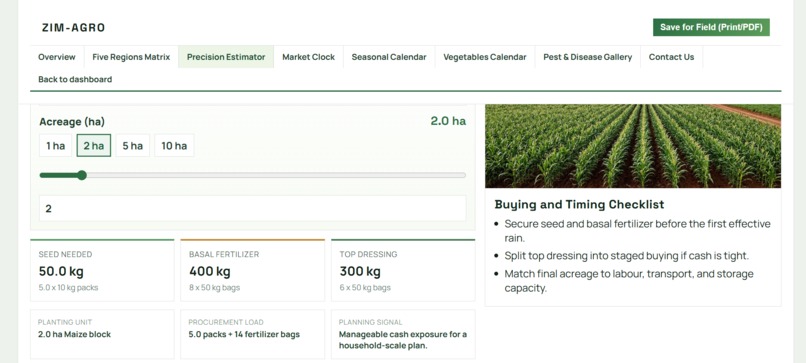
Precision Matrix
-
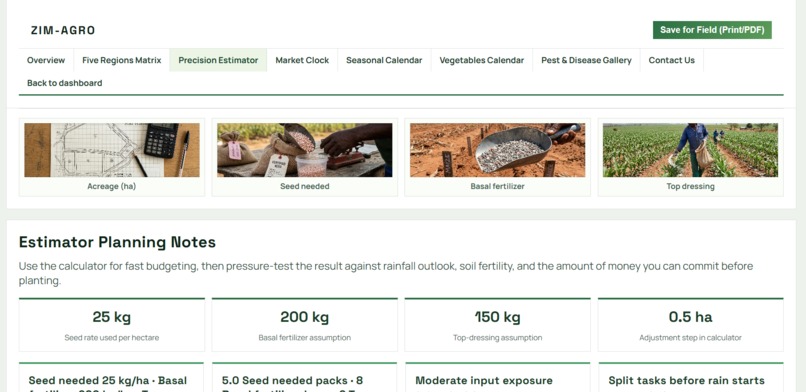
Planning Notes
-
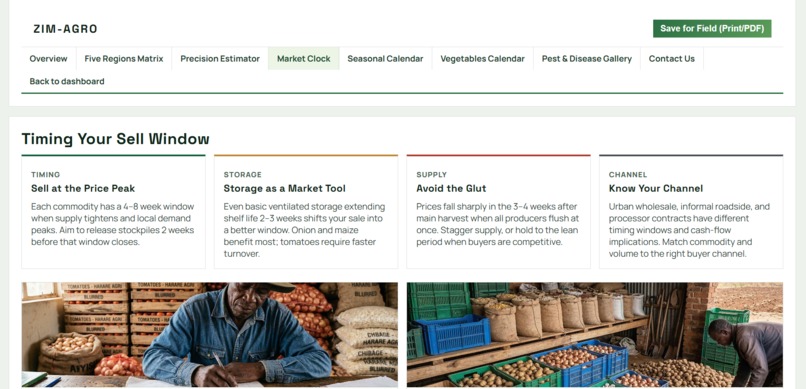
Market Clock
-
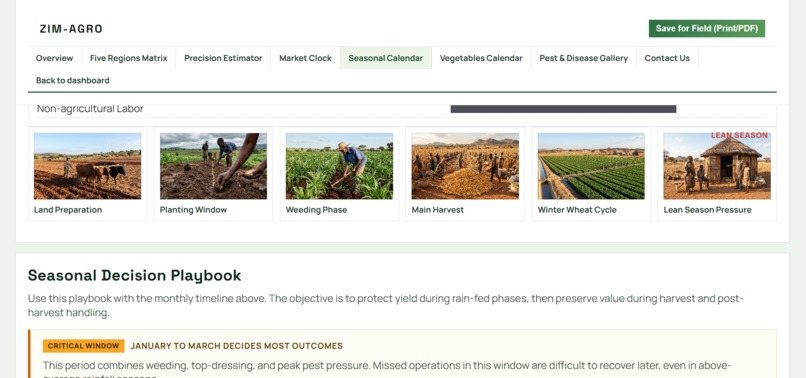
Seasonal Calendar
Inspiration
I grew up seeing how much guesswork goes into farming in Zimbabwe. A neighbour plants maize in a region better suited to sorghum. Someone sells their crop the week prices are lowest because they didn't know a better window was coming. None of this is because farmers aren't skilled. It's because the information that would help them decide (rainfall patterns, regional crop fit, market timing, pest remedies) is scattered across government reports, radio bulletins, and word of mouth, if it's available at all.
Zimbabwe has over 1.8 million smallholder households farming 2 to 6 hectares, mostly rain fed. When a bad season hits, like the 2024 El Niño drought that cut rainfall by 40 to 60 percent in the south, the gap between good information and no information becomes the gap between food security and a lean season shortfall. That's a real challenge hitting a specific local community, not an abstract one, and it's the problem I wanted to close with something free and accessible.
What it does
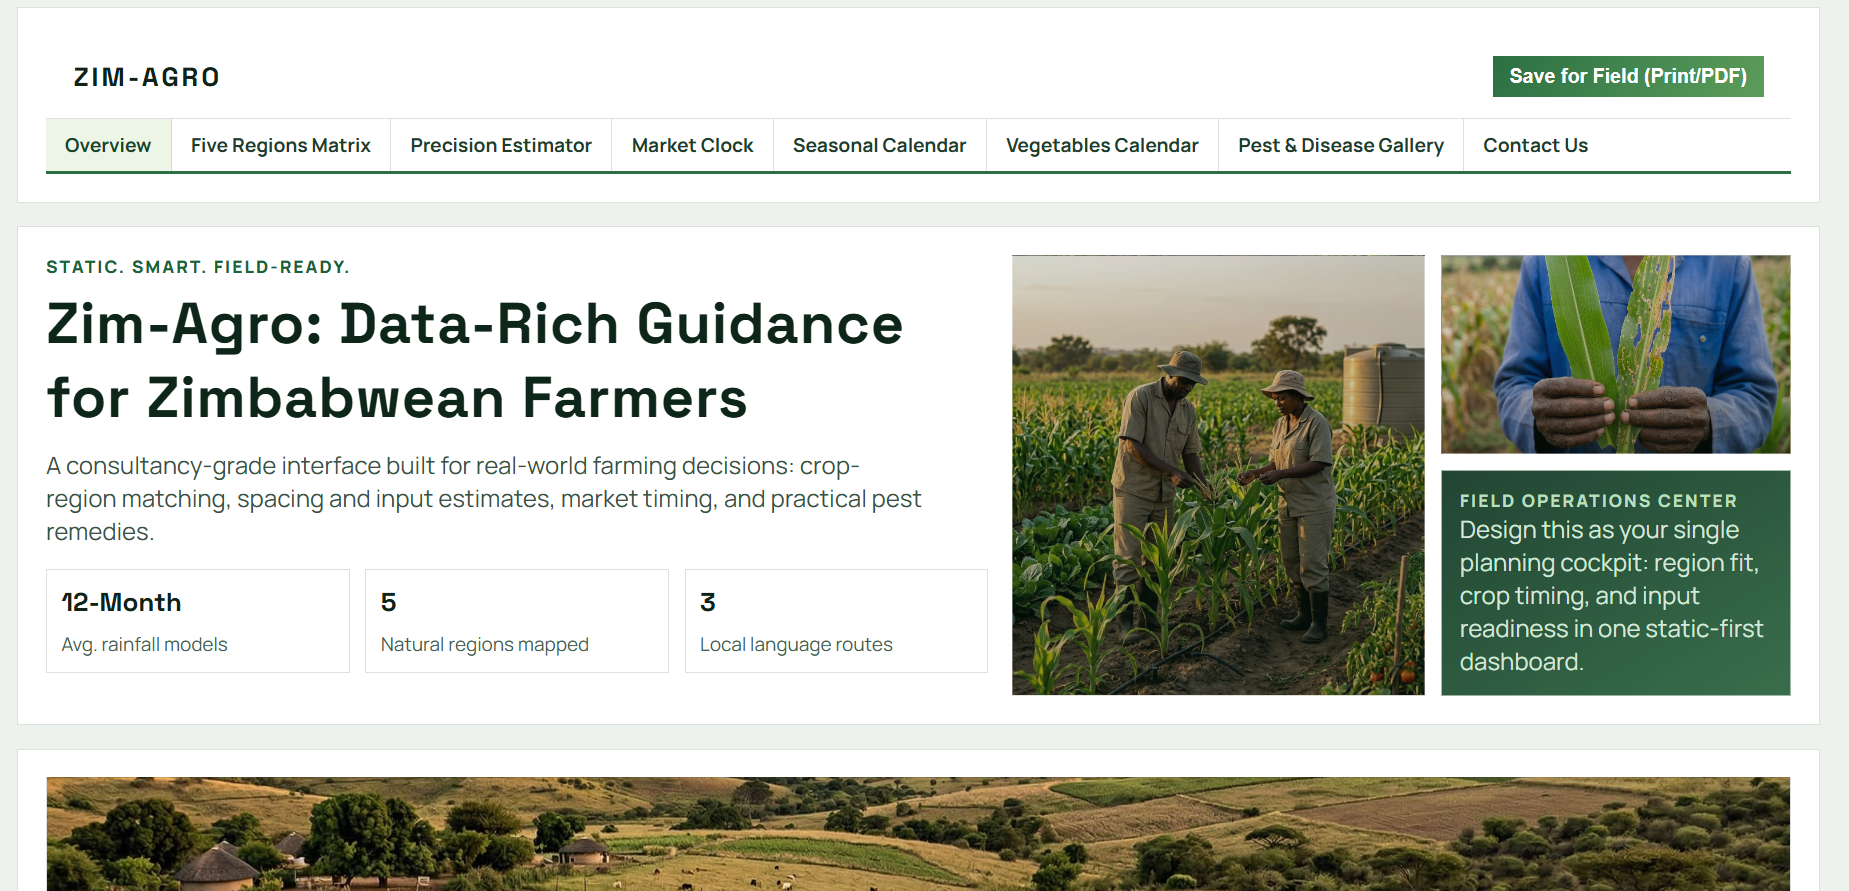
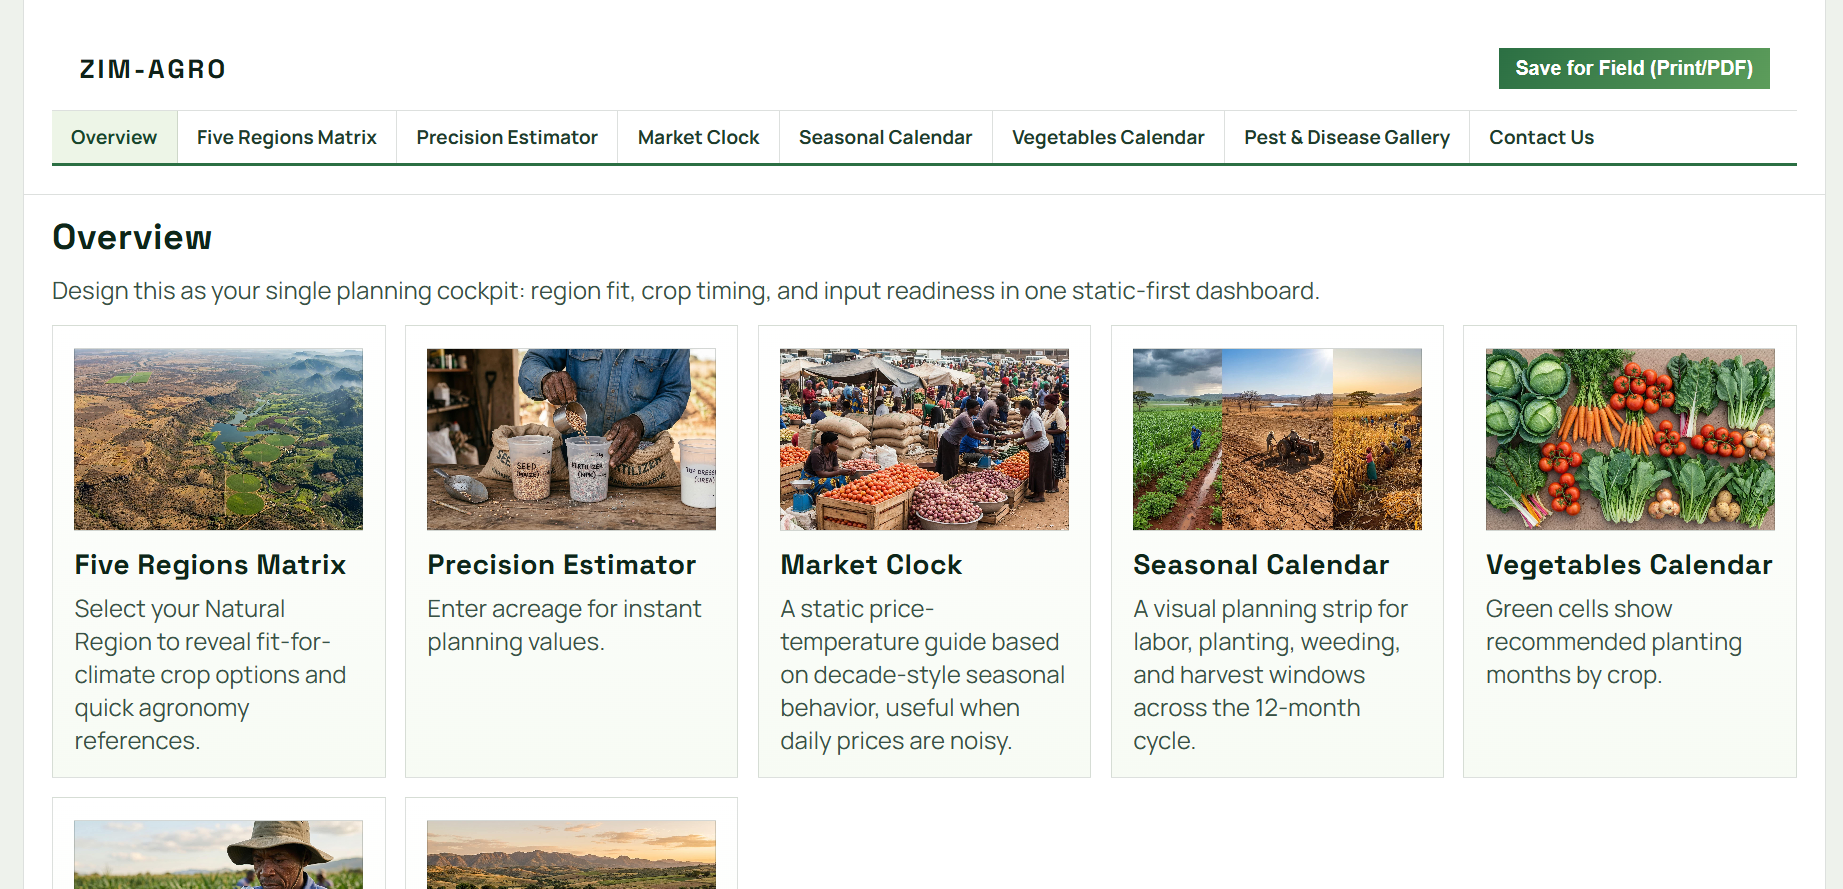
Zim-Agro is a farming dashboard built specifically around Zimbabwe's conditions, submitted under the Sustainability & Climate track. It pulls together:
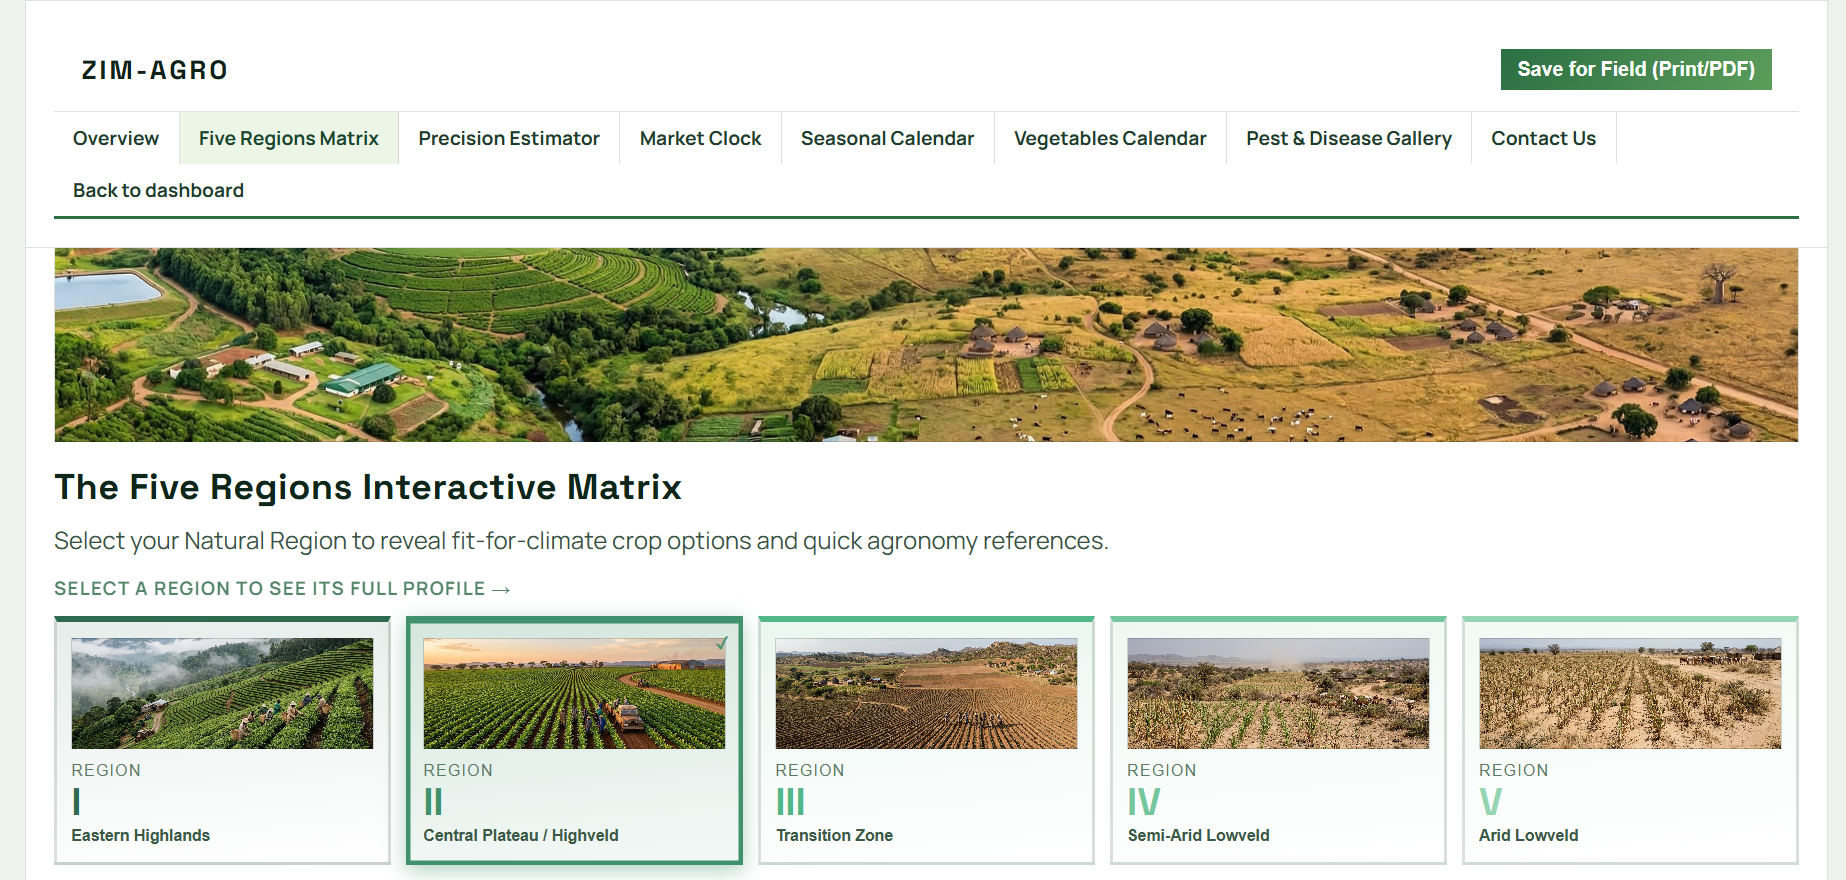
- A Five Regions Matrix that matches crops to Zimbabwe's five natural farming regions
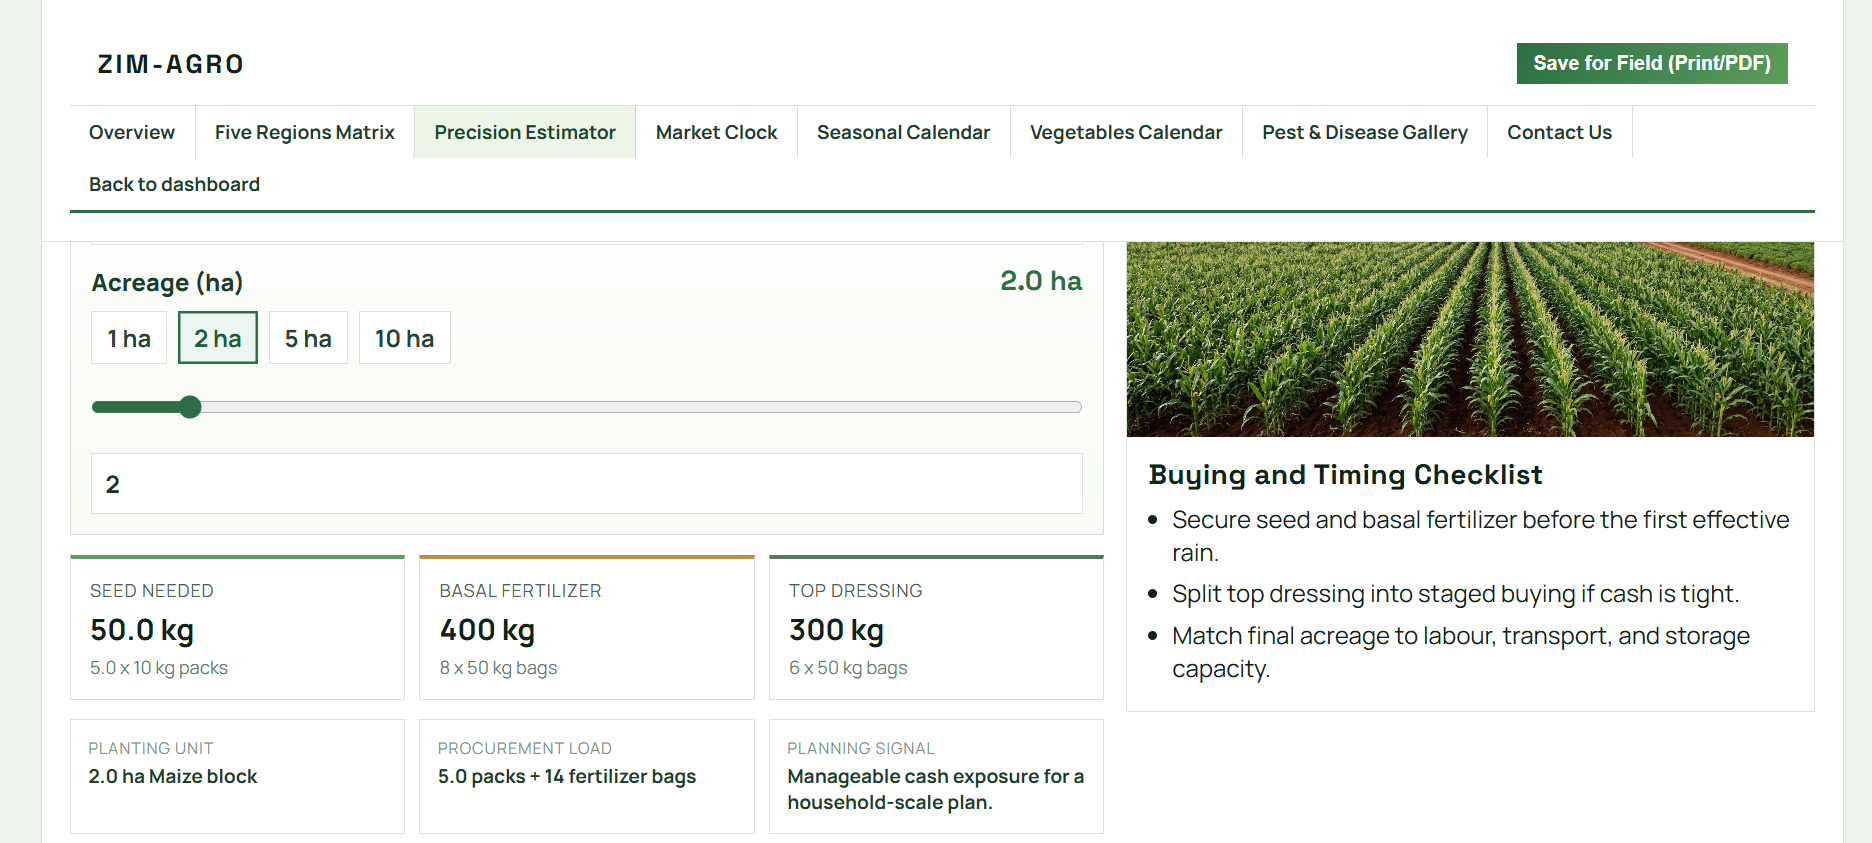
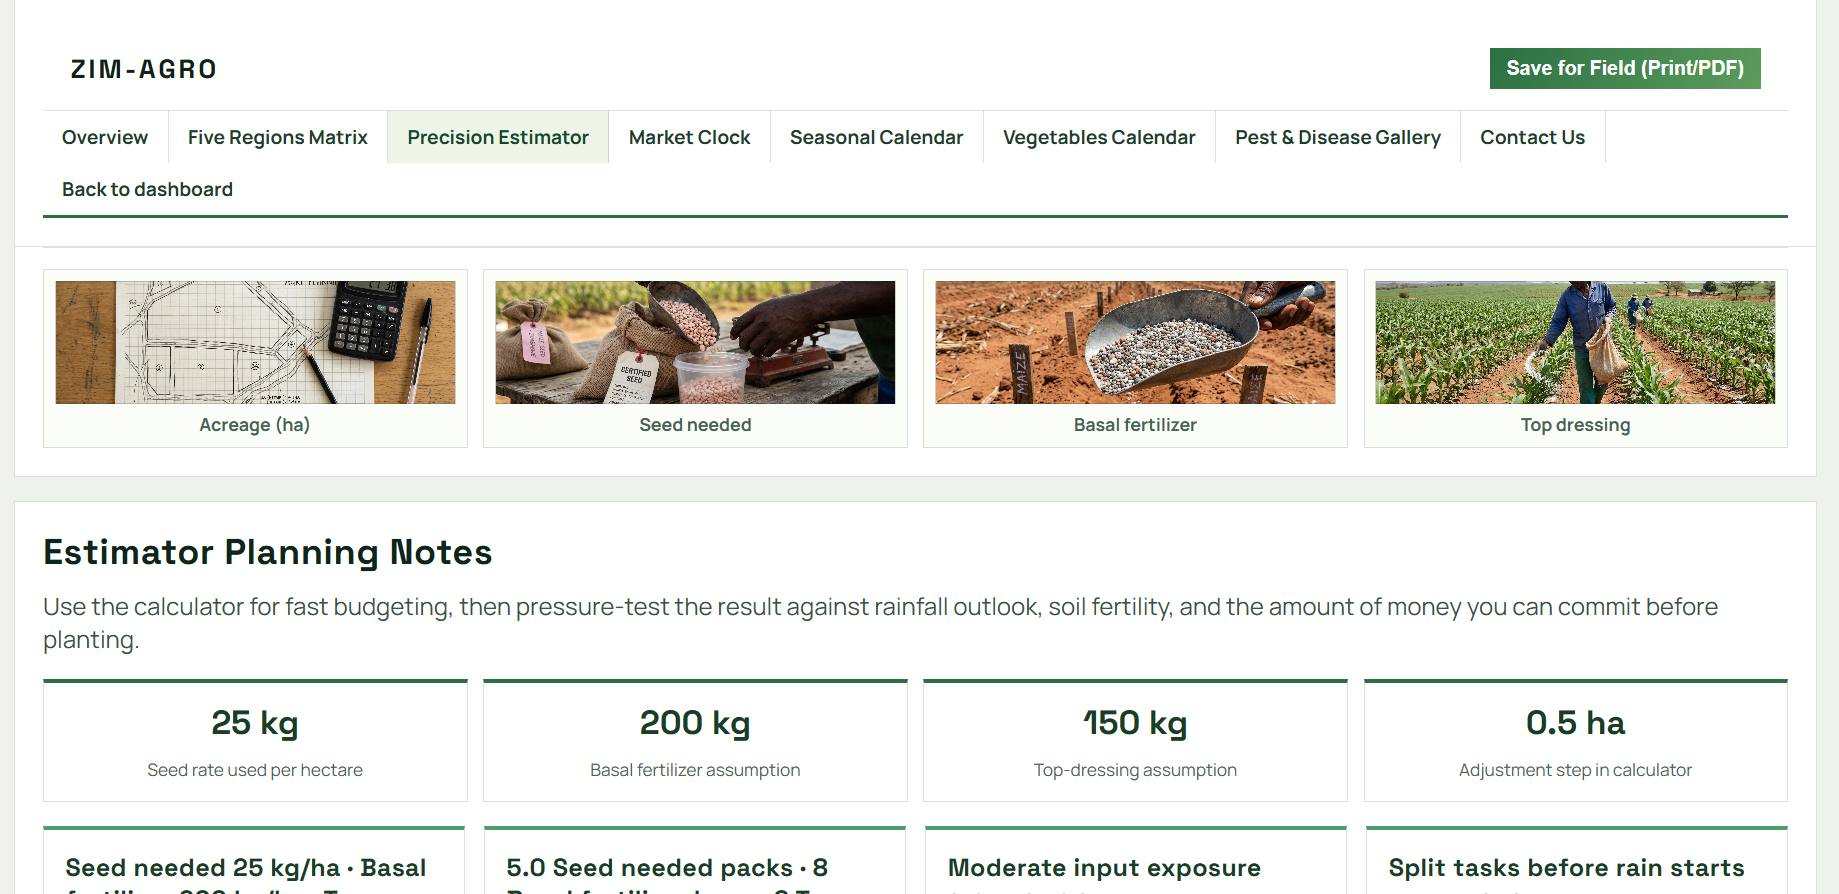
- A Precision Estimator that turns your acreage into planting and input numbers
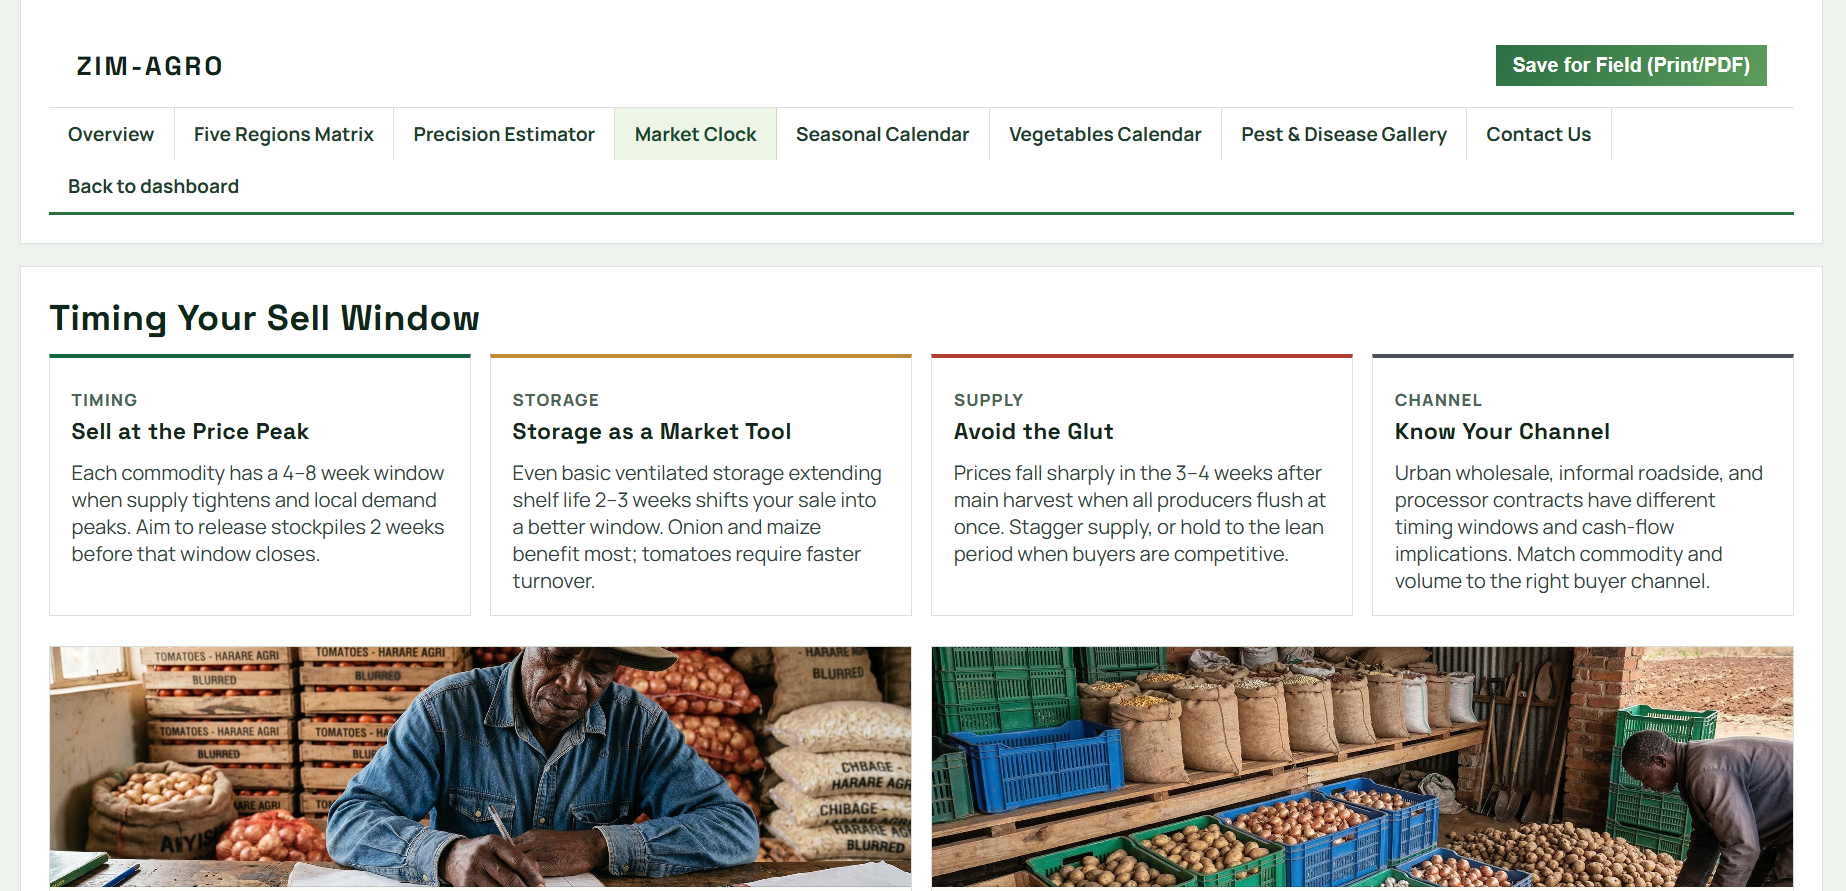
- A Market Clock that shows seasonal price patterns so farmers can time sales instead of guessing
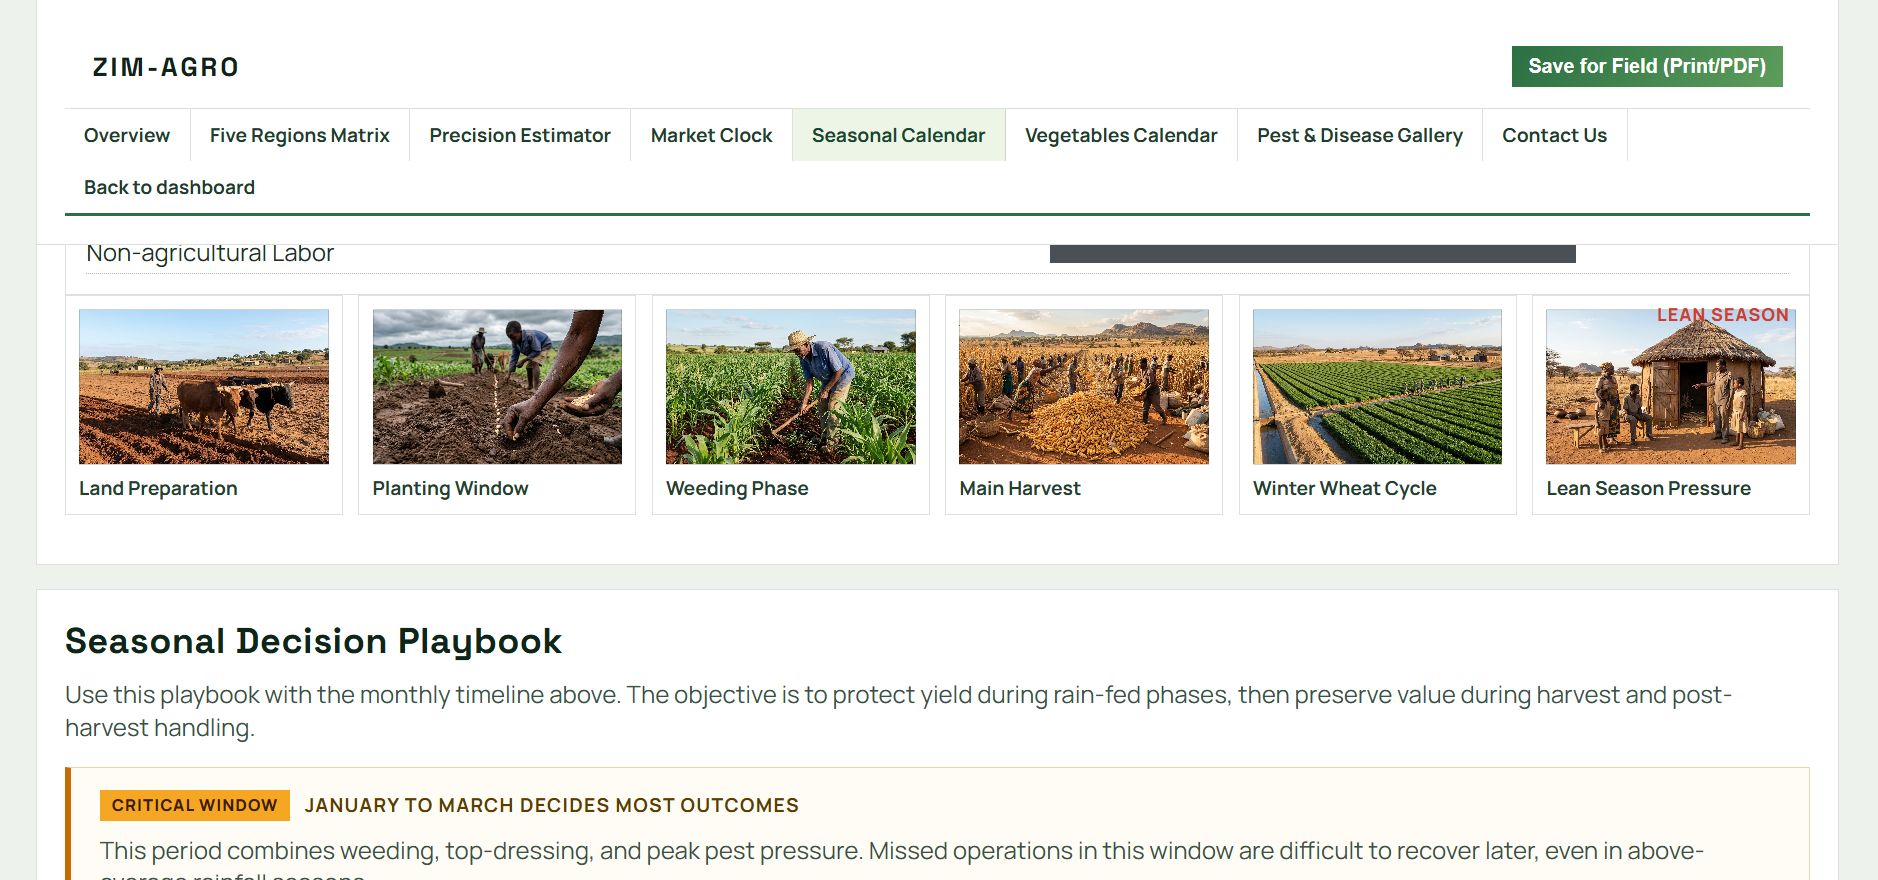
- Seasonal and vegetable calendars for planting and harvest windows
- A Pest and Disease Gallery with practical, low-cost remedies
- Live context from FEWS NET food security phases, TIMB tobacco floor prices, and World Bank climate data, so the guidance isn't generic, it reflects what's actually happening this season
Everything is static first and built to load fast on limited data, because that's the reality for most of the people who'd use it. The whole tool is a STEM based solution in practice, not just in framing: it turns agro ecological science, climate data, and market statistics into a decision a farmer can act on in under a minute.
How I built it
The site is a Vite and React (React 18) single page app, with client side routing through react-router-dom. I kept the stack deliberately lightweight. No heavy frameworks, no unnecessary dependencies, because the target user might be loading this on a low end phone with patchy connectivity in a rural area, not a fast office wifi connection.
I sourced the regional and crop data from FEWS NET, TIMB, ZIMSTAT, and World Bank publications rather than generic agricultural advice, so every number on the dashboard traces back to something real and current, not a guess. That grounding in verifiable data is what makes the solution STEM based rather than just a nicely designed interface.
Challenges I ran into
Getting the natural regions matrix right took the most iteration. Zimbabwe's five agro ecological regions each have different rainfall reliability and suited crops, and getting that mapping accurate (not just technically correct but actually useful to a farmer deciding what to plant) meant going back to source data multiple times rather than relying on a single summary.
Keeping the tool genuinely free and simple was also a constant tension. It would have been easy to add logins, paywalls, or complexity that looks impressive in a demo but adds friction for the person who just needs to know what to plant this month. For a community where connectivity and money are both limited, that friction is the difference between a tool people actually use and one they abandon after one visit.
What I learned
Building for a specific community forces different decisions than building for "users" in general. Every design choice, from keeping the app static first to sourcing data from FEWS NET instead of a generic API, came back to one question: does this actually help a smallholder farmer in Zimbabwe make a better decision this season. That constraint made the project sharper, not smaller, and it's the same constraint I kept coming back to when framing this for PRISM: a meaningful problem, demonstrated with real value, not the most complicated build possible.
What's next
I want to expand the pest and disease gallery with more regional cases, and look at adding an offline mode so farmers with no connectivity in the field can still access their region's data.
Built With
- cloudflare
- css3
- fews-net
- html5
- javascript
- node.js
- npm
- react-18
- react-router-dom
- sharp
- timb
- vite
- world-bank
- zimstat
- zinwa


Log in or sign up for Devpost to join the conversation.