-
-
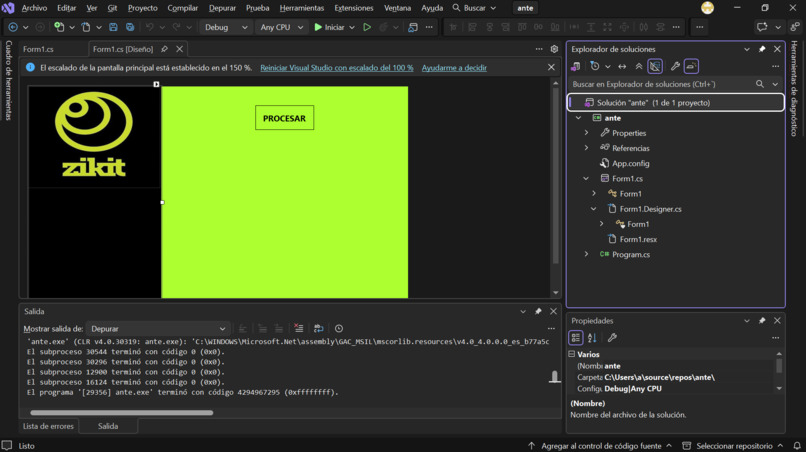
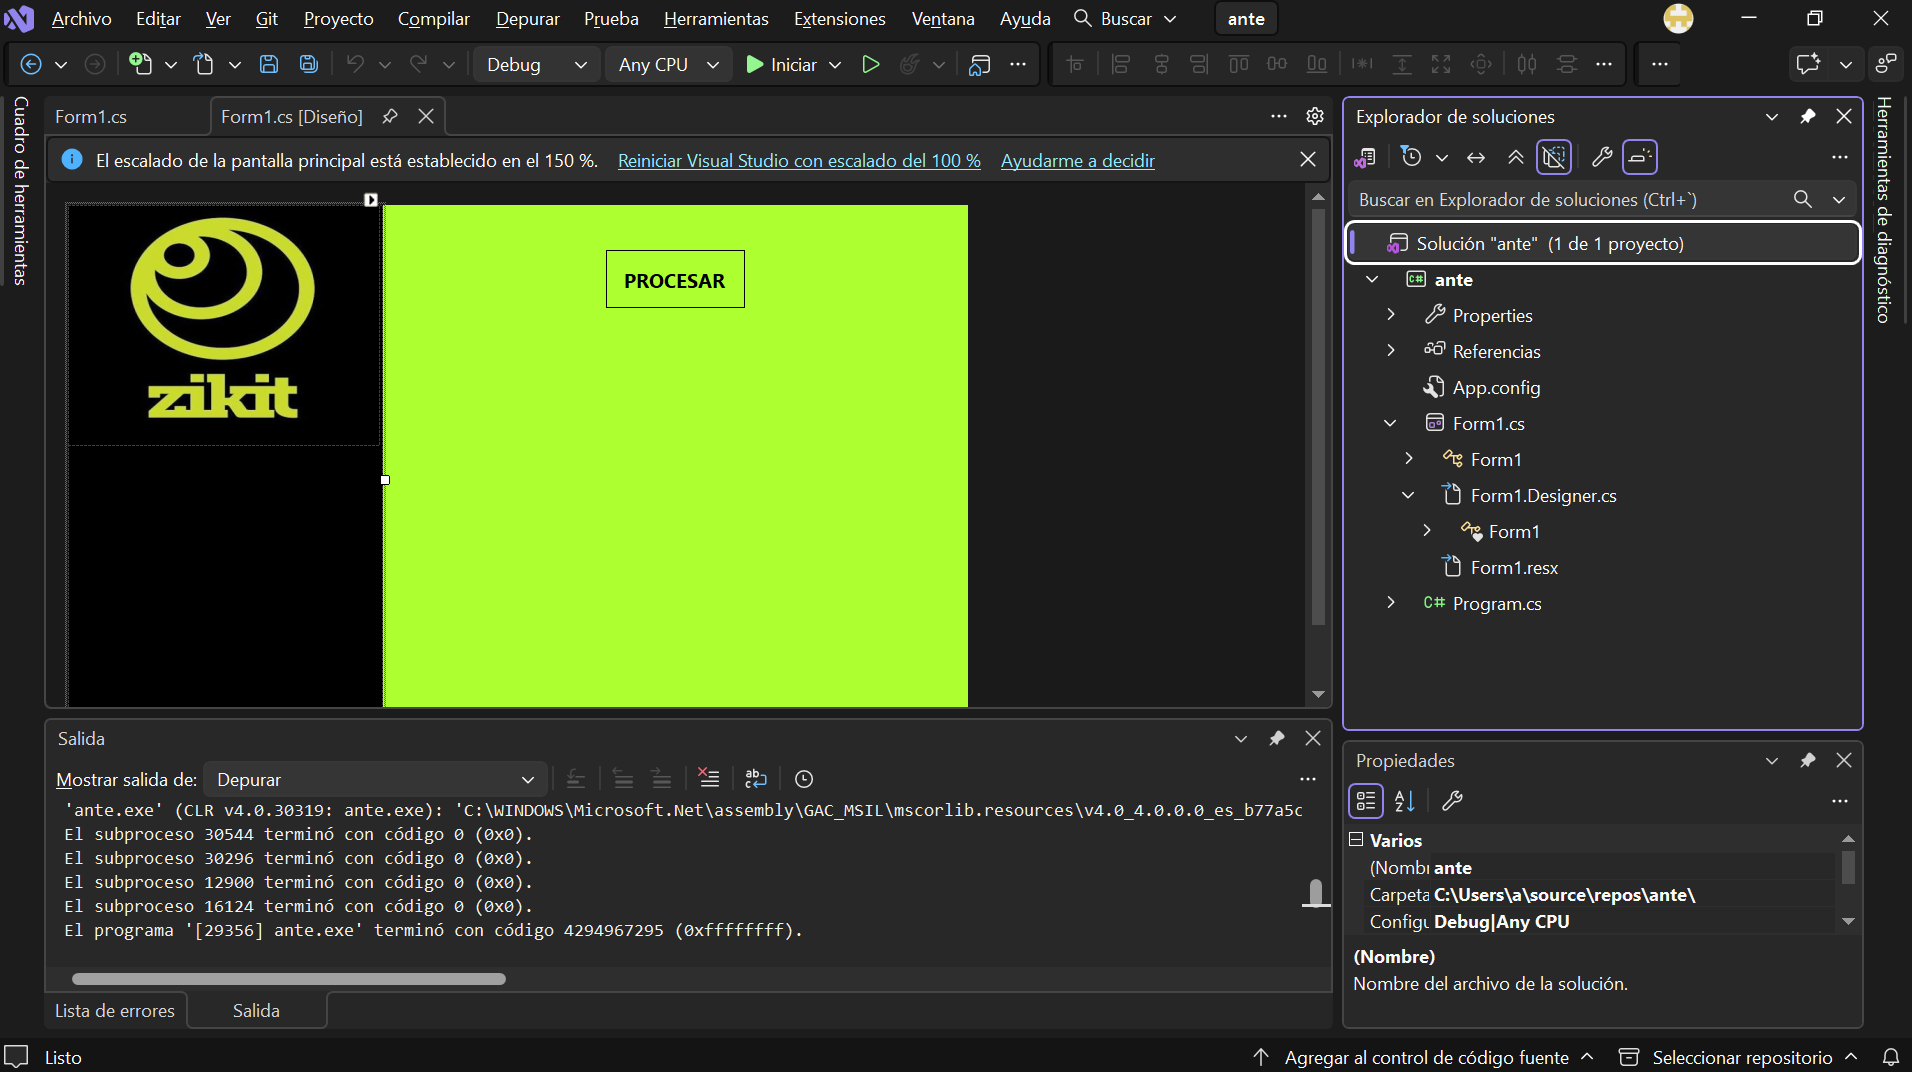
preview of the interface
Inspiration
Systems fail, and by the time we find out, it’s already too late. Watching metrics alone doesn’t solve it either. In our tests, a metrics-only detector fired 78 alarms, 30 of them false. A team that gets that many false alarms ends up ignoring all of them.
Our solution: one button that combines two real-time sources of information, metrics and logs.
What it does
Loads two files at startup: the metrics CSV and the log file. Simulates the passage of time: it reads the CSV line by line, about 3 seconds per hour of data. A full week of operation plays out in about 8 minutes. Never sees the future: at each line it uses only what has already happened, in both metrics and logs. It does not use the errors column to make predictions. Detects that something is going wrong: when at least 2 of the 4 metrics (CPU, RAM, disk, latency) stay above their normal value for 5 consecutive readings, an alarm is created internally. It is not shown yet. Validates it against the logs: If the logs read so far contain a saturation warning, such as “connection pool at 85%”, playback pauses and the alert is shown. If there is none, the system predicts a false alarm and never shows it. Confirms real errors on the fly: an error counts when there is an ERROR log entry and a CSV row with errors. Expected cases (backups, reindexing, campaigns, scheduled retries) are discarded. Closes with a report: it compares alerts against confirmed errors and shows which were hits and which were false alarms.
How we built it
We built zikit kiaku around a simple idea: a metric spike is only a suspicion, and a log is the evidence.
A replay engine reads the metrics CSV one row at a time and advances a simulated clock (3 seconds of real time per hour of data). Logs are loaded in parallel and revealed only up to the current simulated timestamp, so the system can never peek ahead. A two-stage detector. Stage one is a streaming rule on the metrics: at least 2 of 4 signals above their normal baseline for 5 consecutive readings creates a pending alarm. Stage two is a log check: the pending alarm becomes a visible alert only if a saturation warning already appears in the logs read so far. Otherwise it is silently dropped as a predicted false alarm. A ground-truth confirmer that runs alongside. It marks a real error only when an ERROR log and a CSV row with errors coincide, and it filters out known benign events (backups, reindexing, campaigns, scheduled retries). A final report that compares every alert against confirmed errors and labels each as a hit or a false alarm. We kept the errors column strictly out of the prediction path. It is used only afterward, to score the results honestly.
Challenges we ran into
Avoiding lookahead. It is easy to leak future information, whether through the errors column or by reading ahead in the logs. We had to design the replay so every decision uses only past data. Alert fatigue. Our metrics-only baseline produced 78 alarms, 30 of them false, which was exactly the problem we set out to fix. Finding the right threshold (2 of 4 metrics, 5 consecutive readings) took balancing early warnings against noise. Telling real failures from expected load. Backups, reindexing, campaigns, and scheduled retries all look like trouble in the metrics but are normal. Teaching the system to separate them from real incidents was the hardest part. Aligning two data sources. Metrics and logs have different shapes and timestamps, so we had to sync them on a single simulated clock.
Accomplishments that we’re proud of
We cut false alarms by requiring that two independent sources agree before anyone gets interrupted. The metrics-only detector’s 30 false alarms out of 78 were the number to beat. A strictly causal design: at every row, the system knows only what a real operator would know at that moment. A live simulation that compresses a full week of operations into about 8 minutes, so the behavior is easy to watch and demo. An honest final report that scores every alert against confirmed errors, showing the hits and the misses.
What we learned
Metrics tell you that something is off. Logs tell you why. Neither is enough alone, and combining them is what makes an alert trustworthy. An alert’s value is not just catching problems. It is also not crying wolf, because a team that ignores alarms has no monitoring at all. Evaluating a predictor fairly means being strict about time. Even small leaks of future data make results look better than they really are. Knowing what is expected (backups, reindexing, campaigns) matters as much as knowing what is abnormal.
What’s next for zikit kiaku
Live mode: connect to real monitoring streams (e.g. Prometheus or CloudWatch) and live log pipelines instead of replaying files. Adaptive baselines that learn each server’s “normal” automatically, including daily and weekly patterns. Smarter log understanding: go beyond keyword matching and recognize new kinds of saturation and failure messages. Learned expected-event filters that pick up planned maintenance from calendars or deploy schedules instead of a fixed list. Alert routing and integrations with Slack, PagerDuty, and email, plus severity levels and lead-time estimates (“this will likely fail in X hours”). Broader validation across more servers, longer time ranges, and more kinds of incidents to measure how well the approach generalizes.
Built With
- arrays
- c#
- csv
- framework
- md
- messagebox
- streamreader

Log in or sign up for Devpost to join the conversation.