-
-
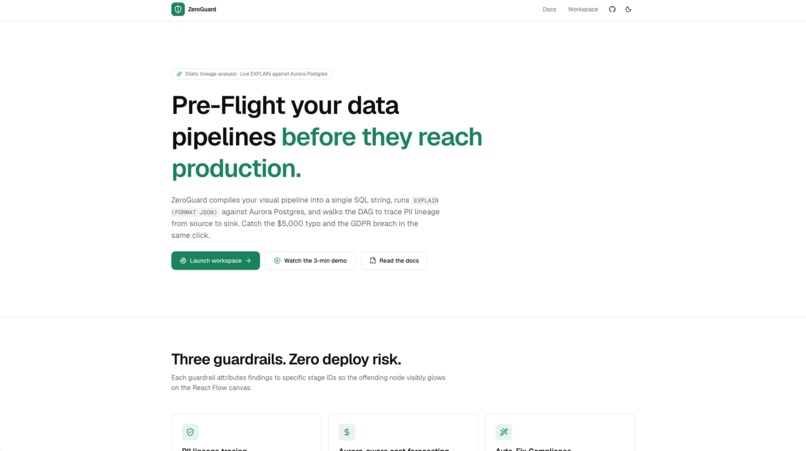
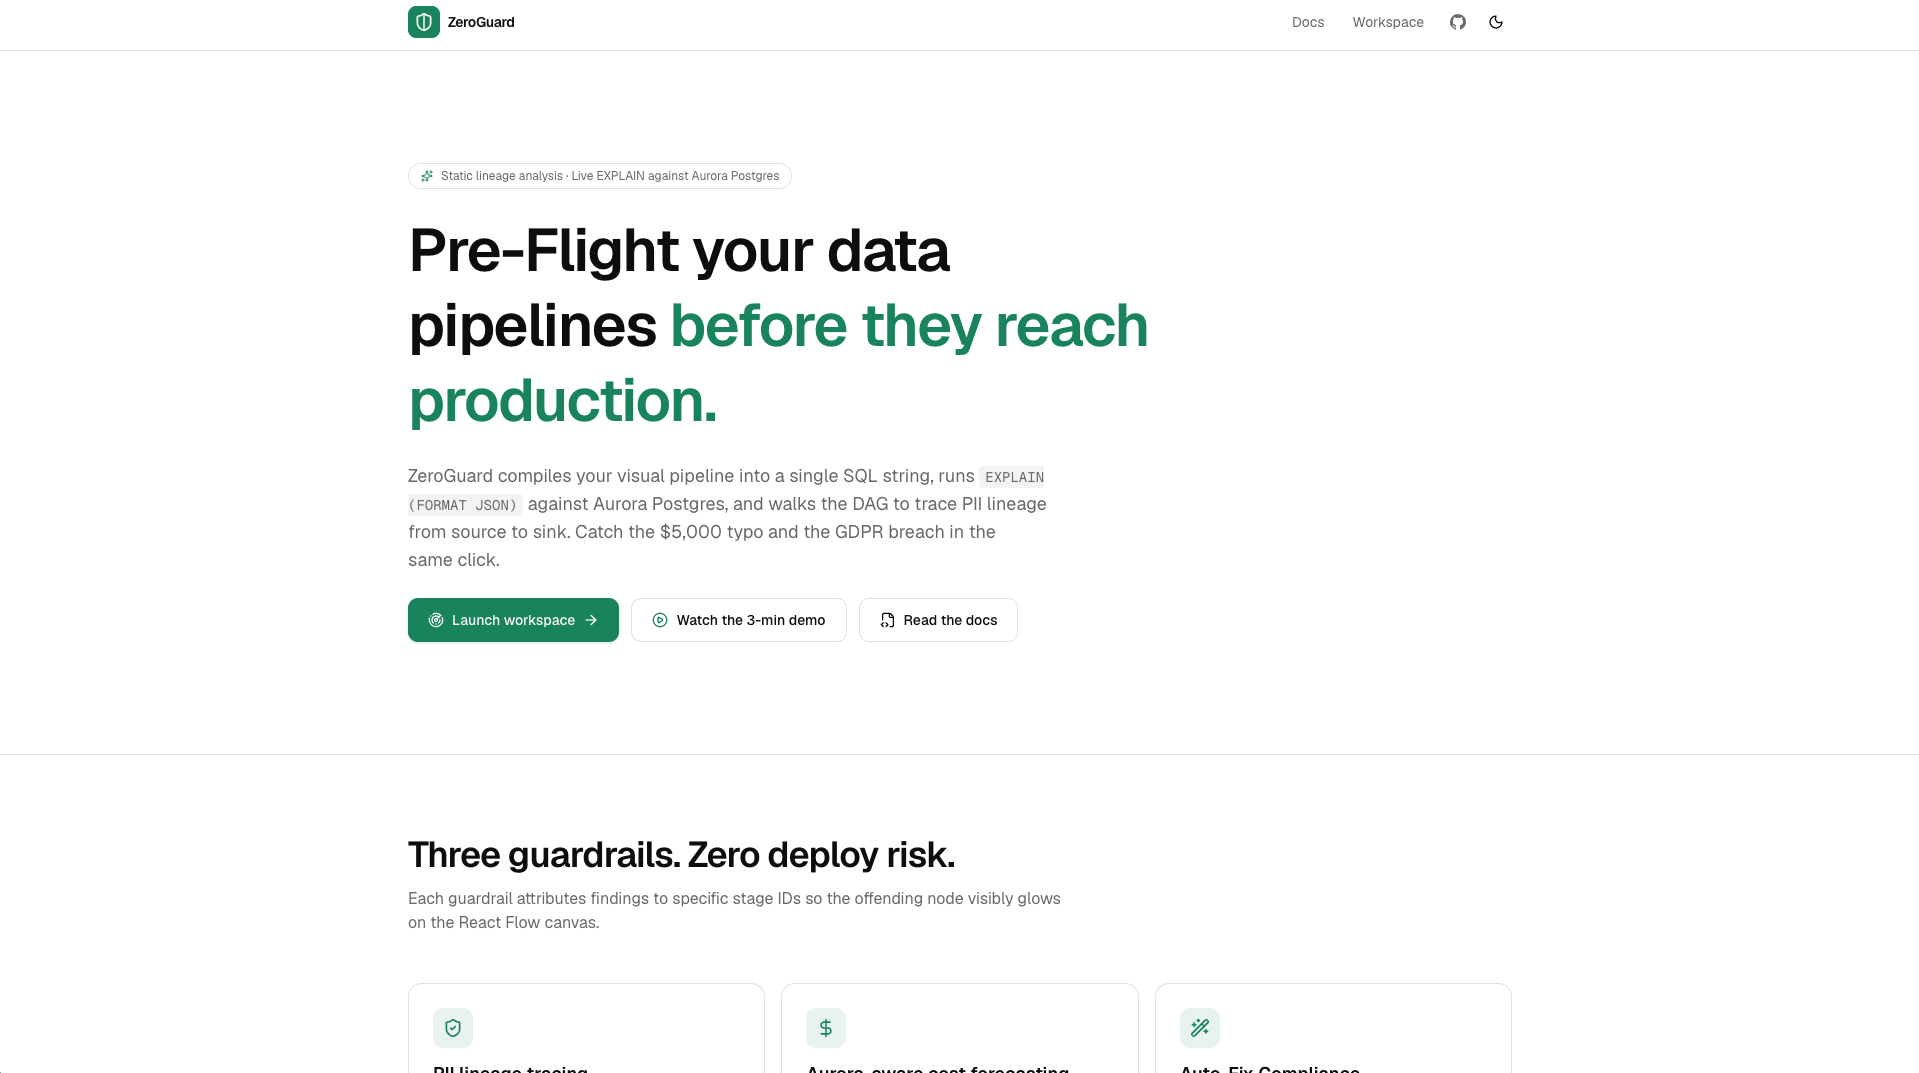
Landing page
-
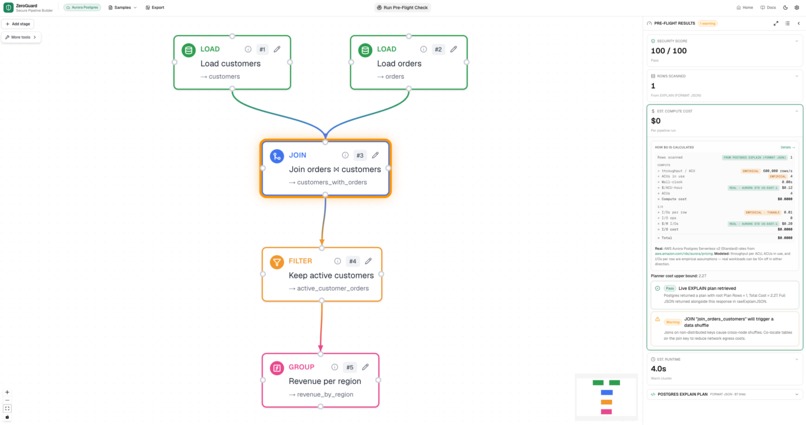
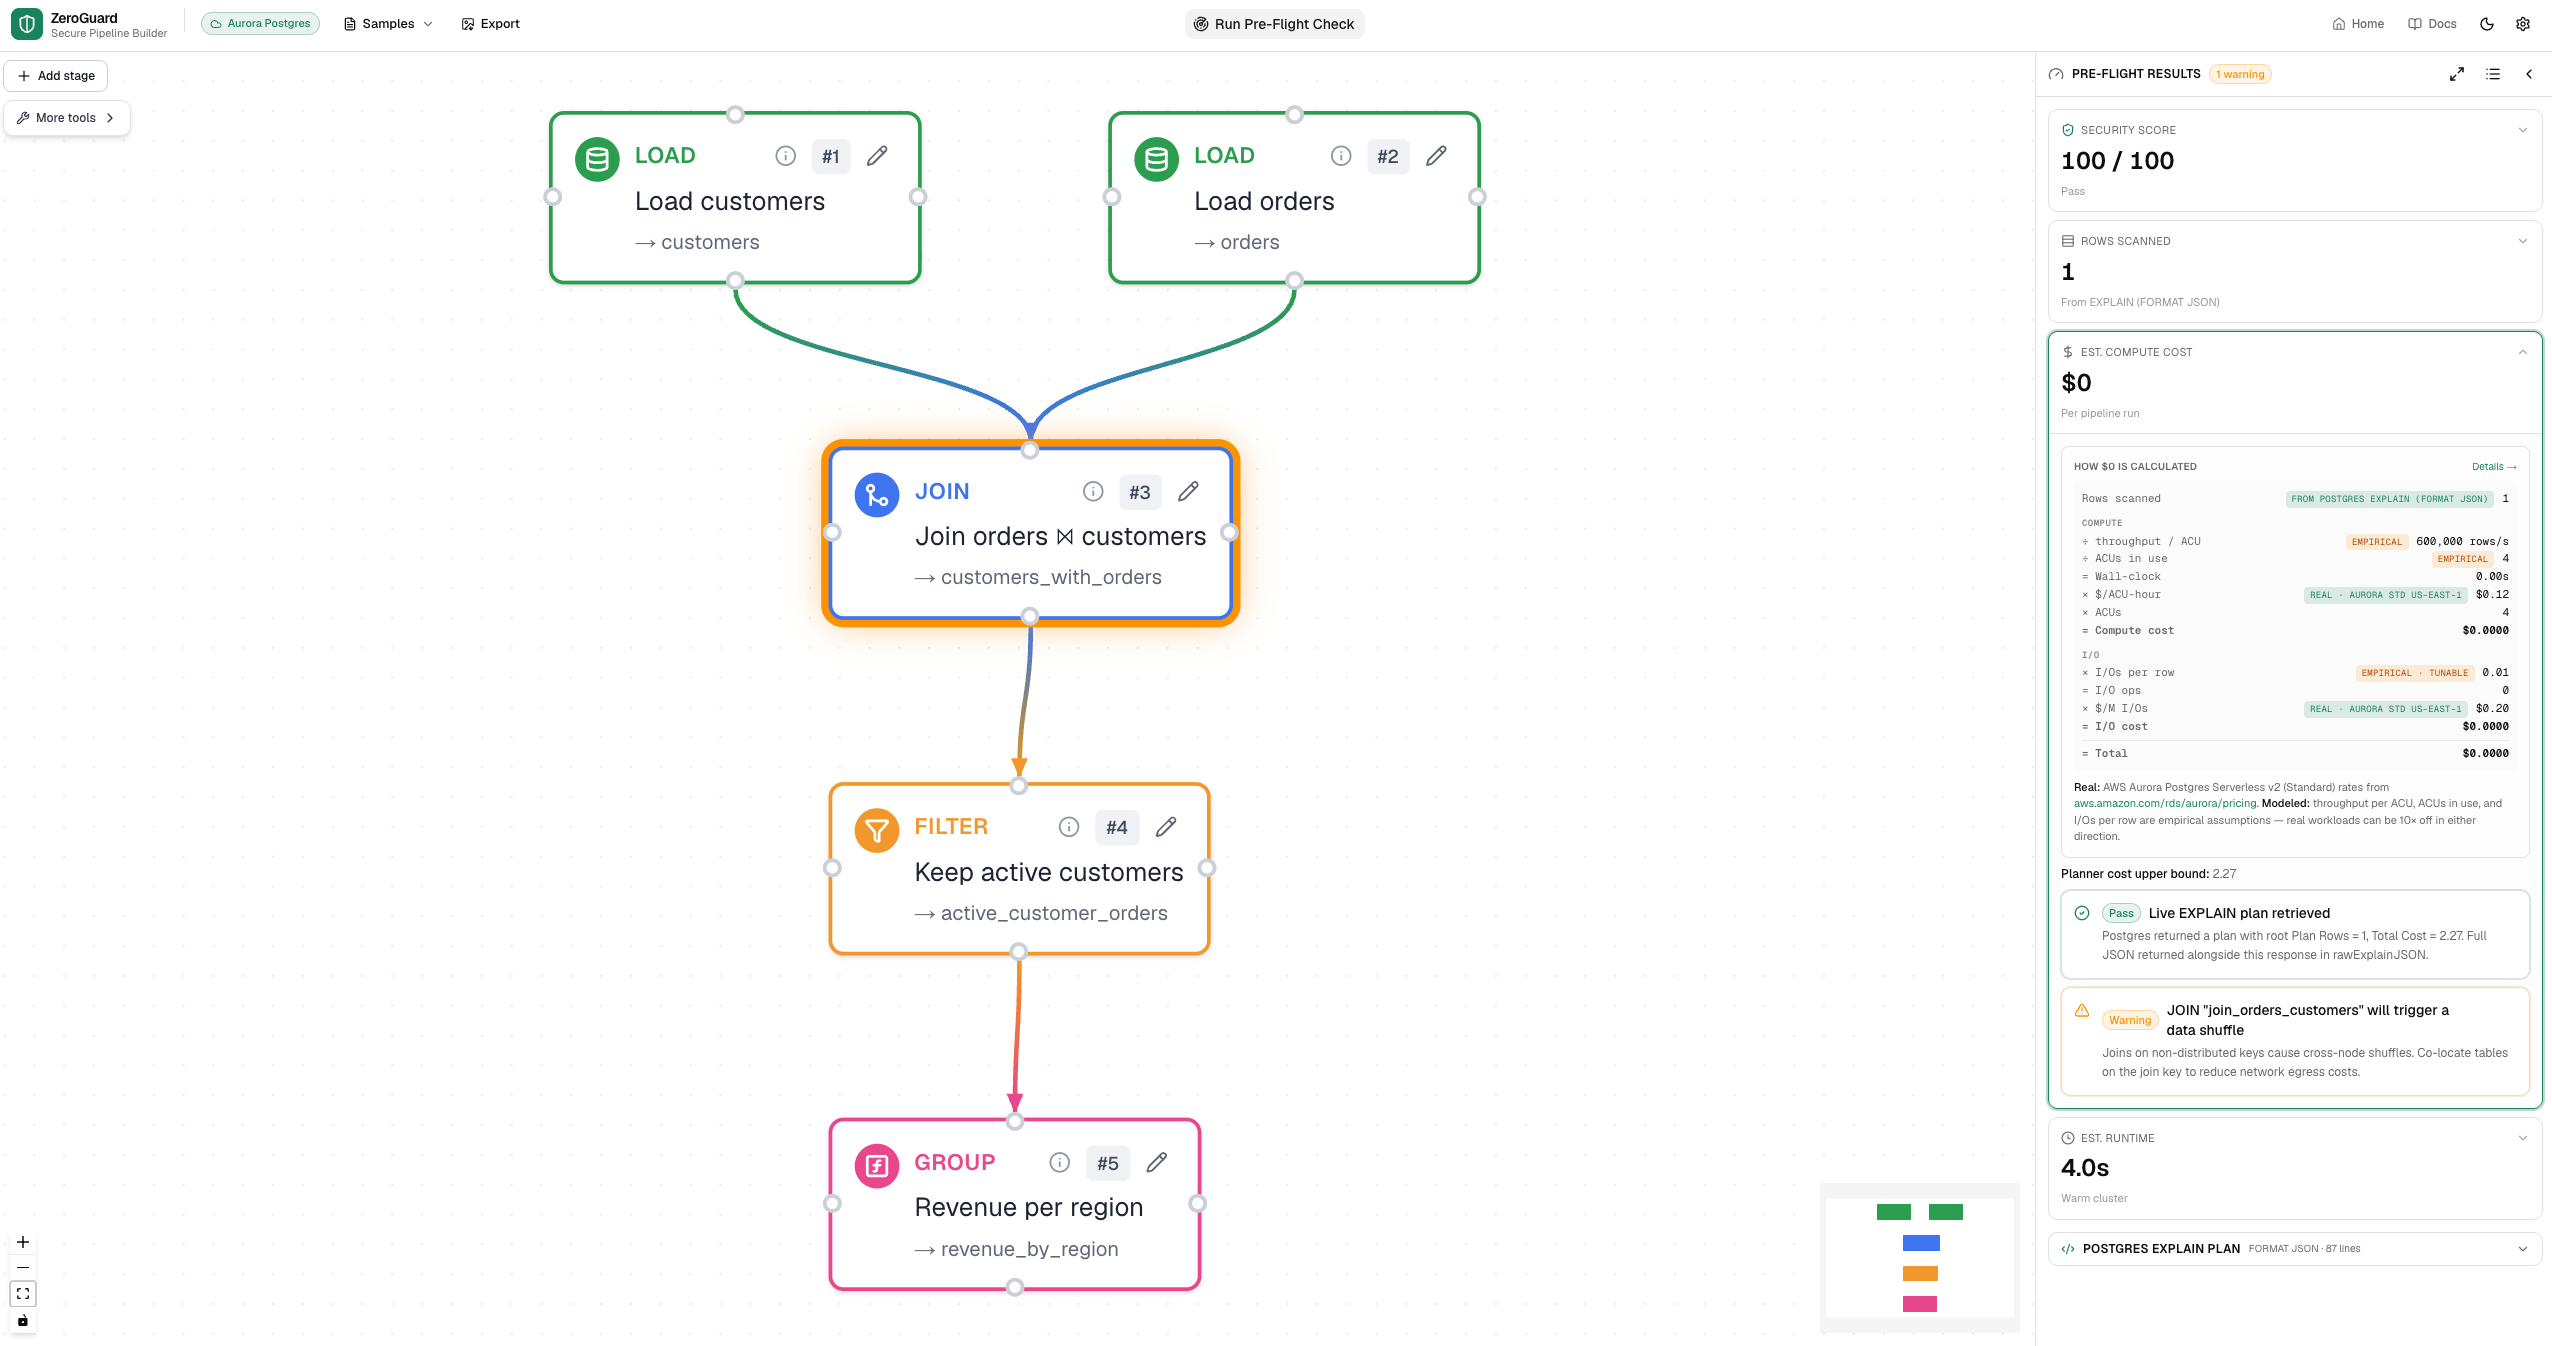
Demo: Revenue by region, Pre-Flight results
-
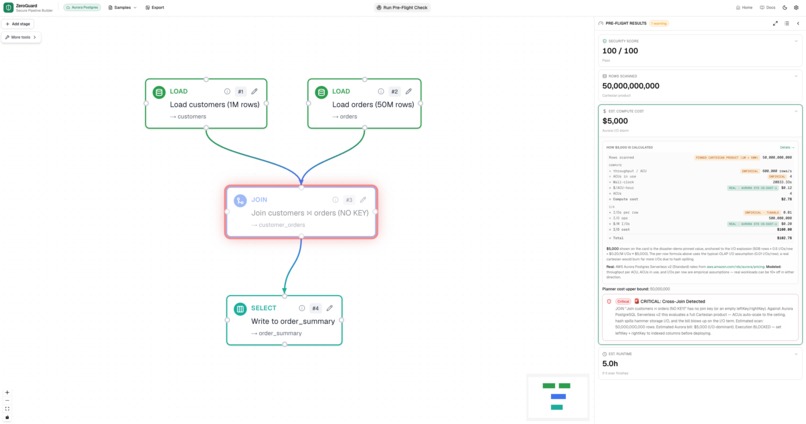
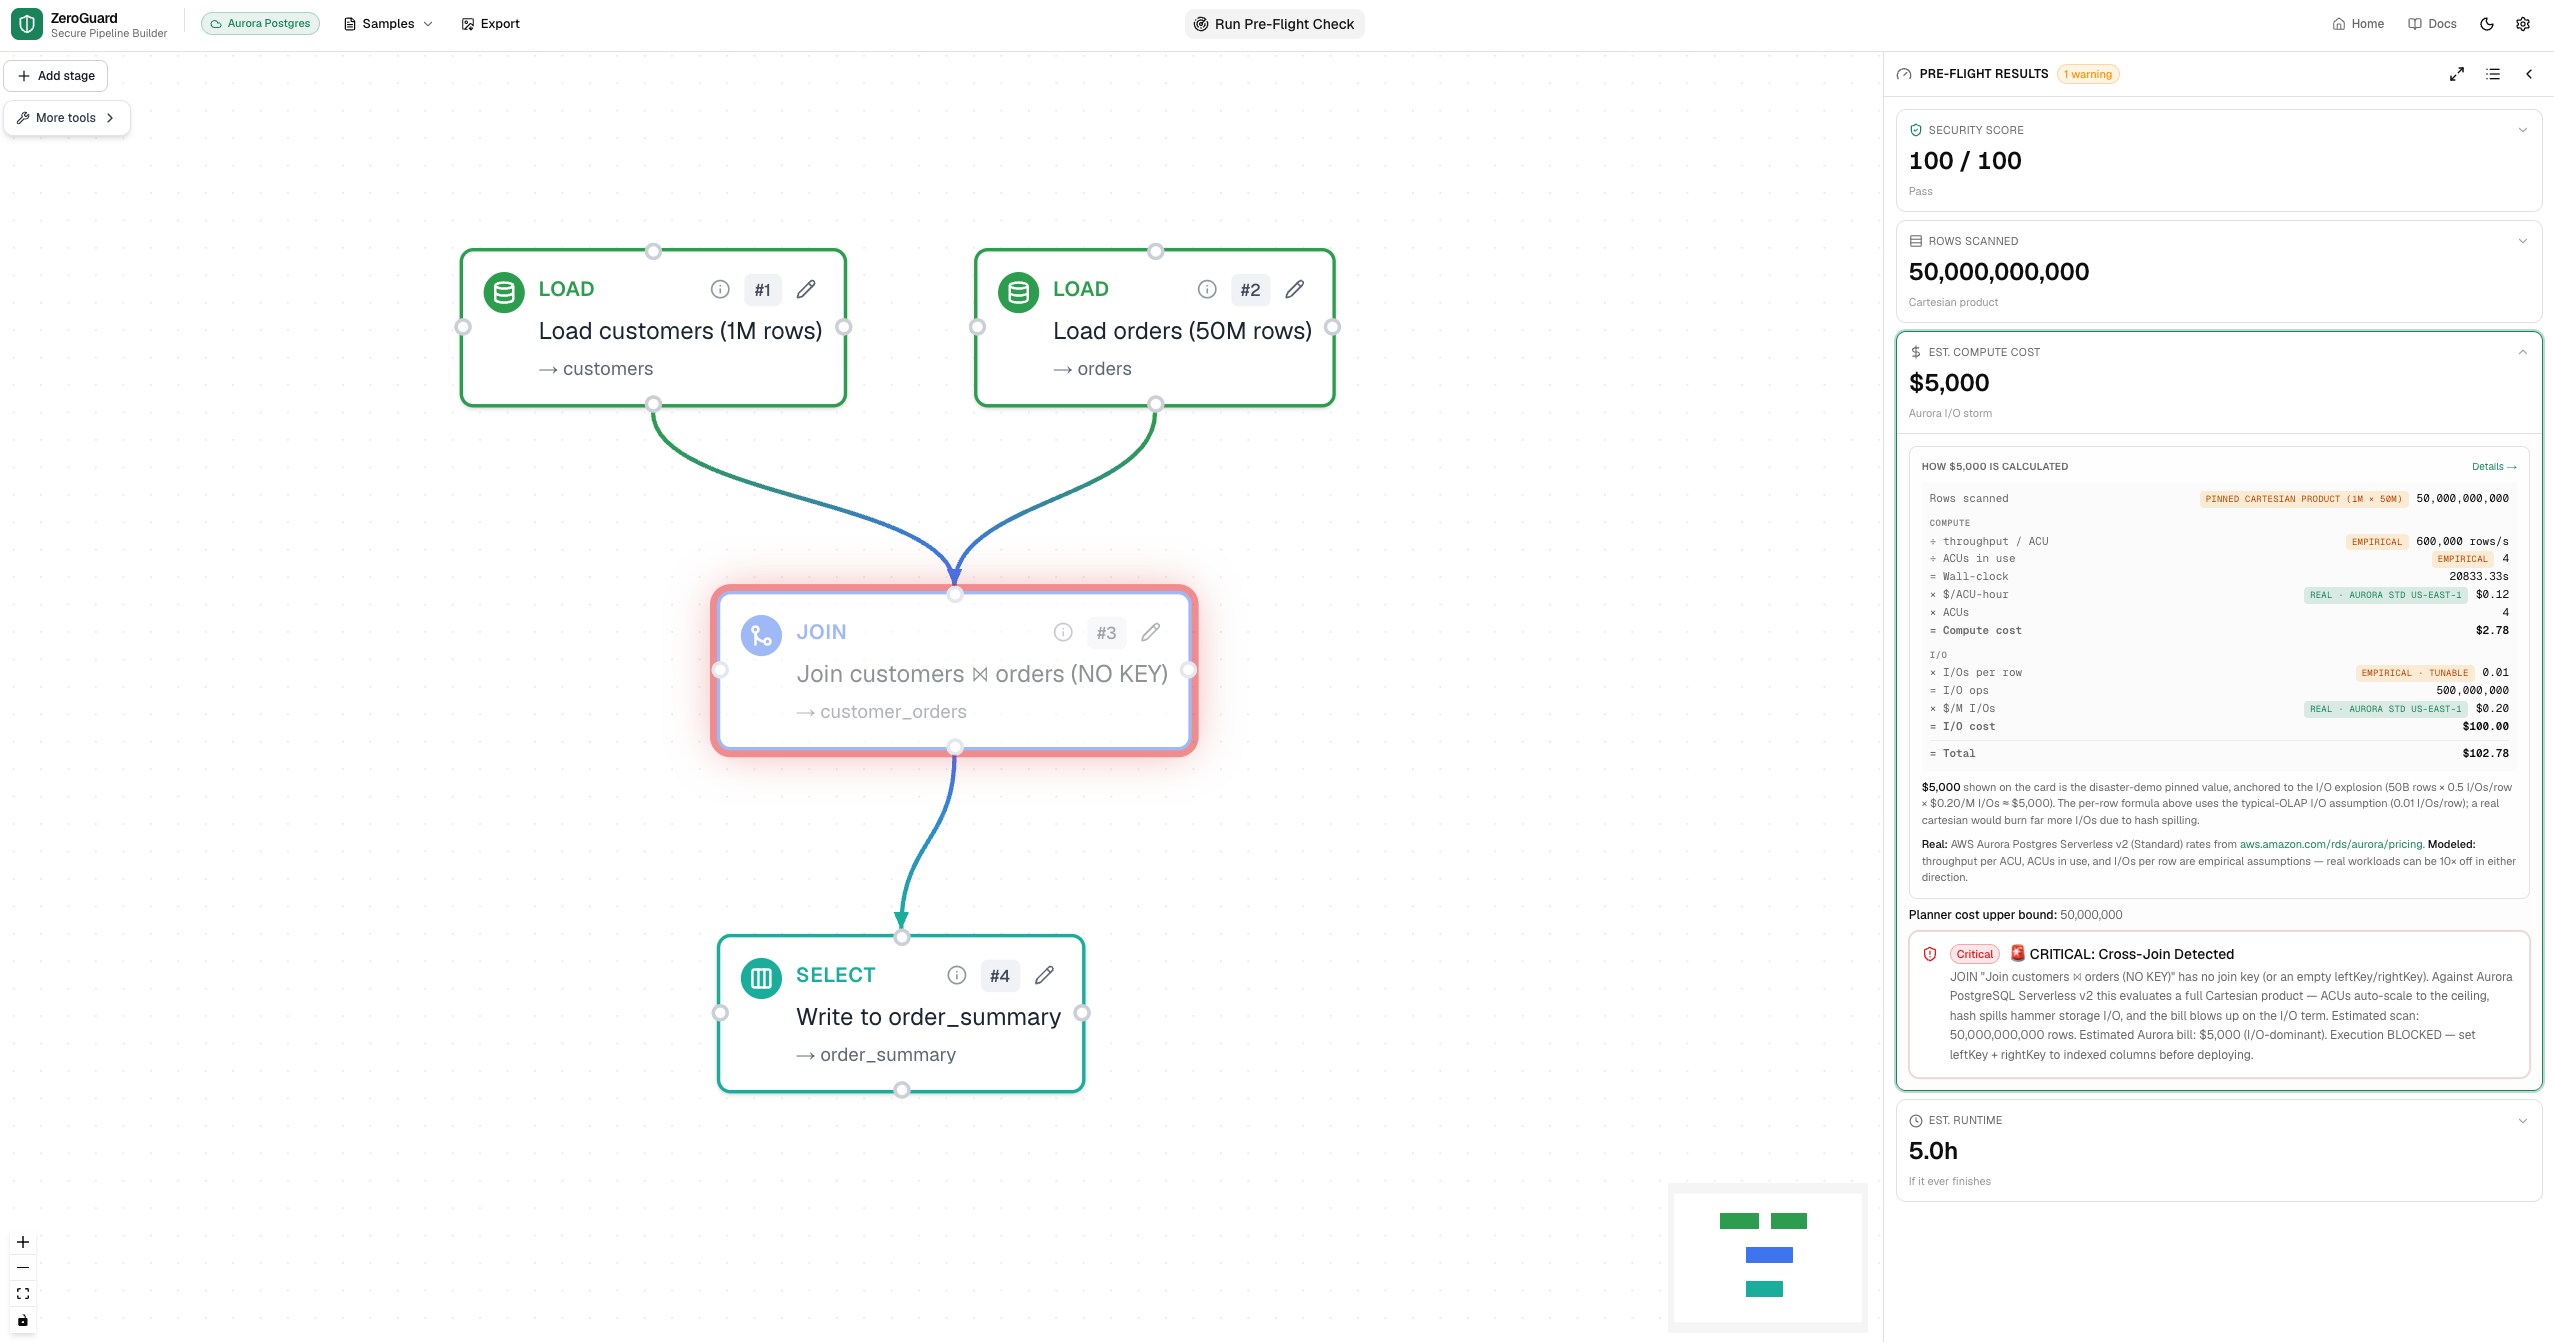
Demo: Cartesian disaster
-
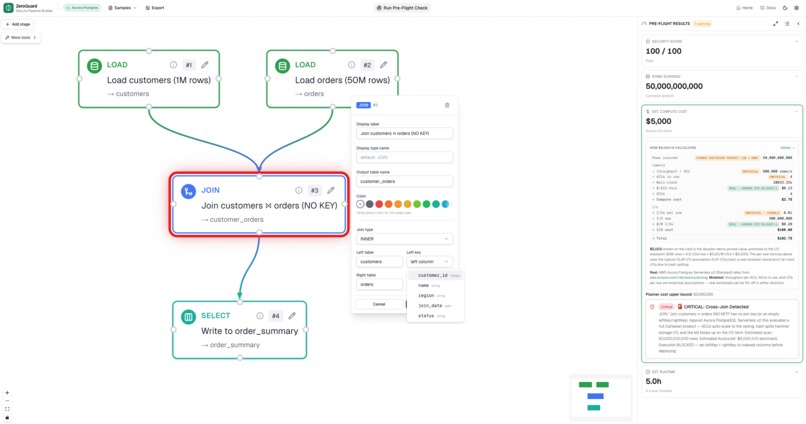
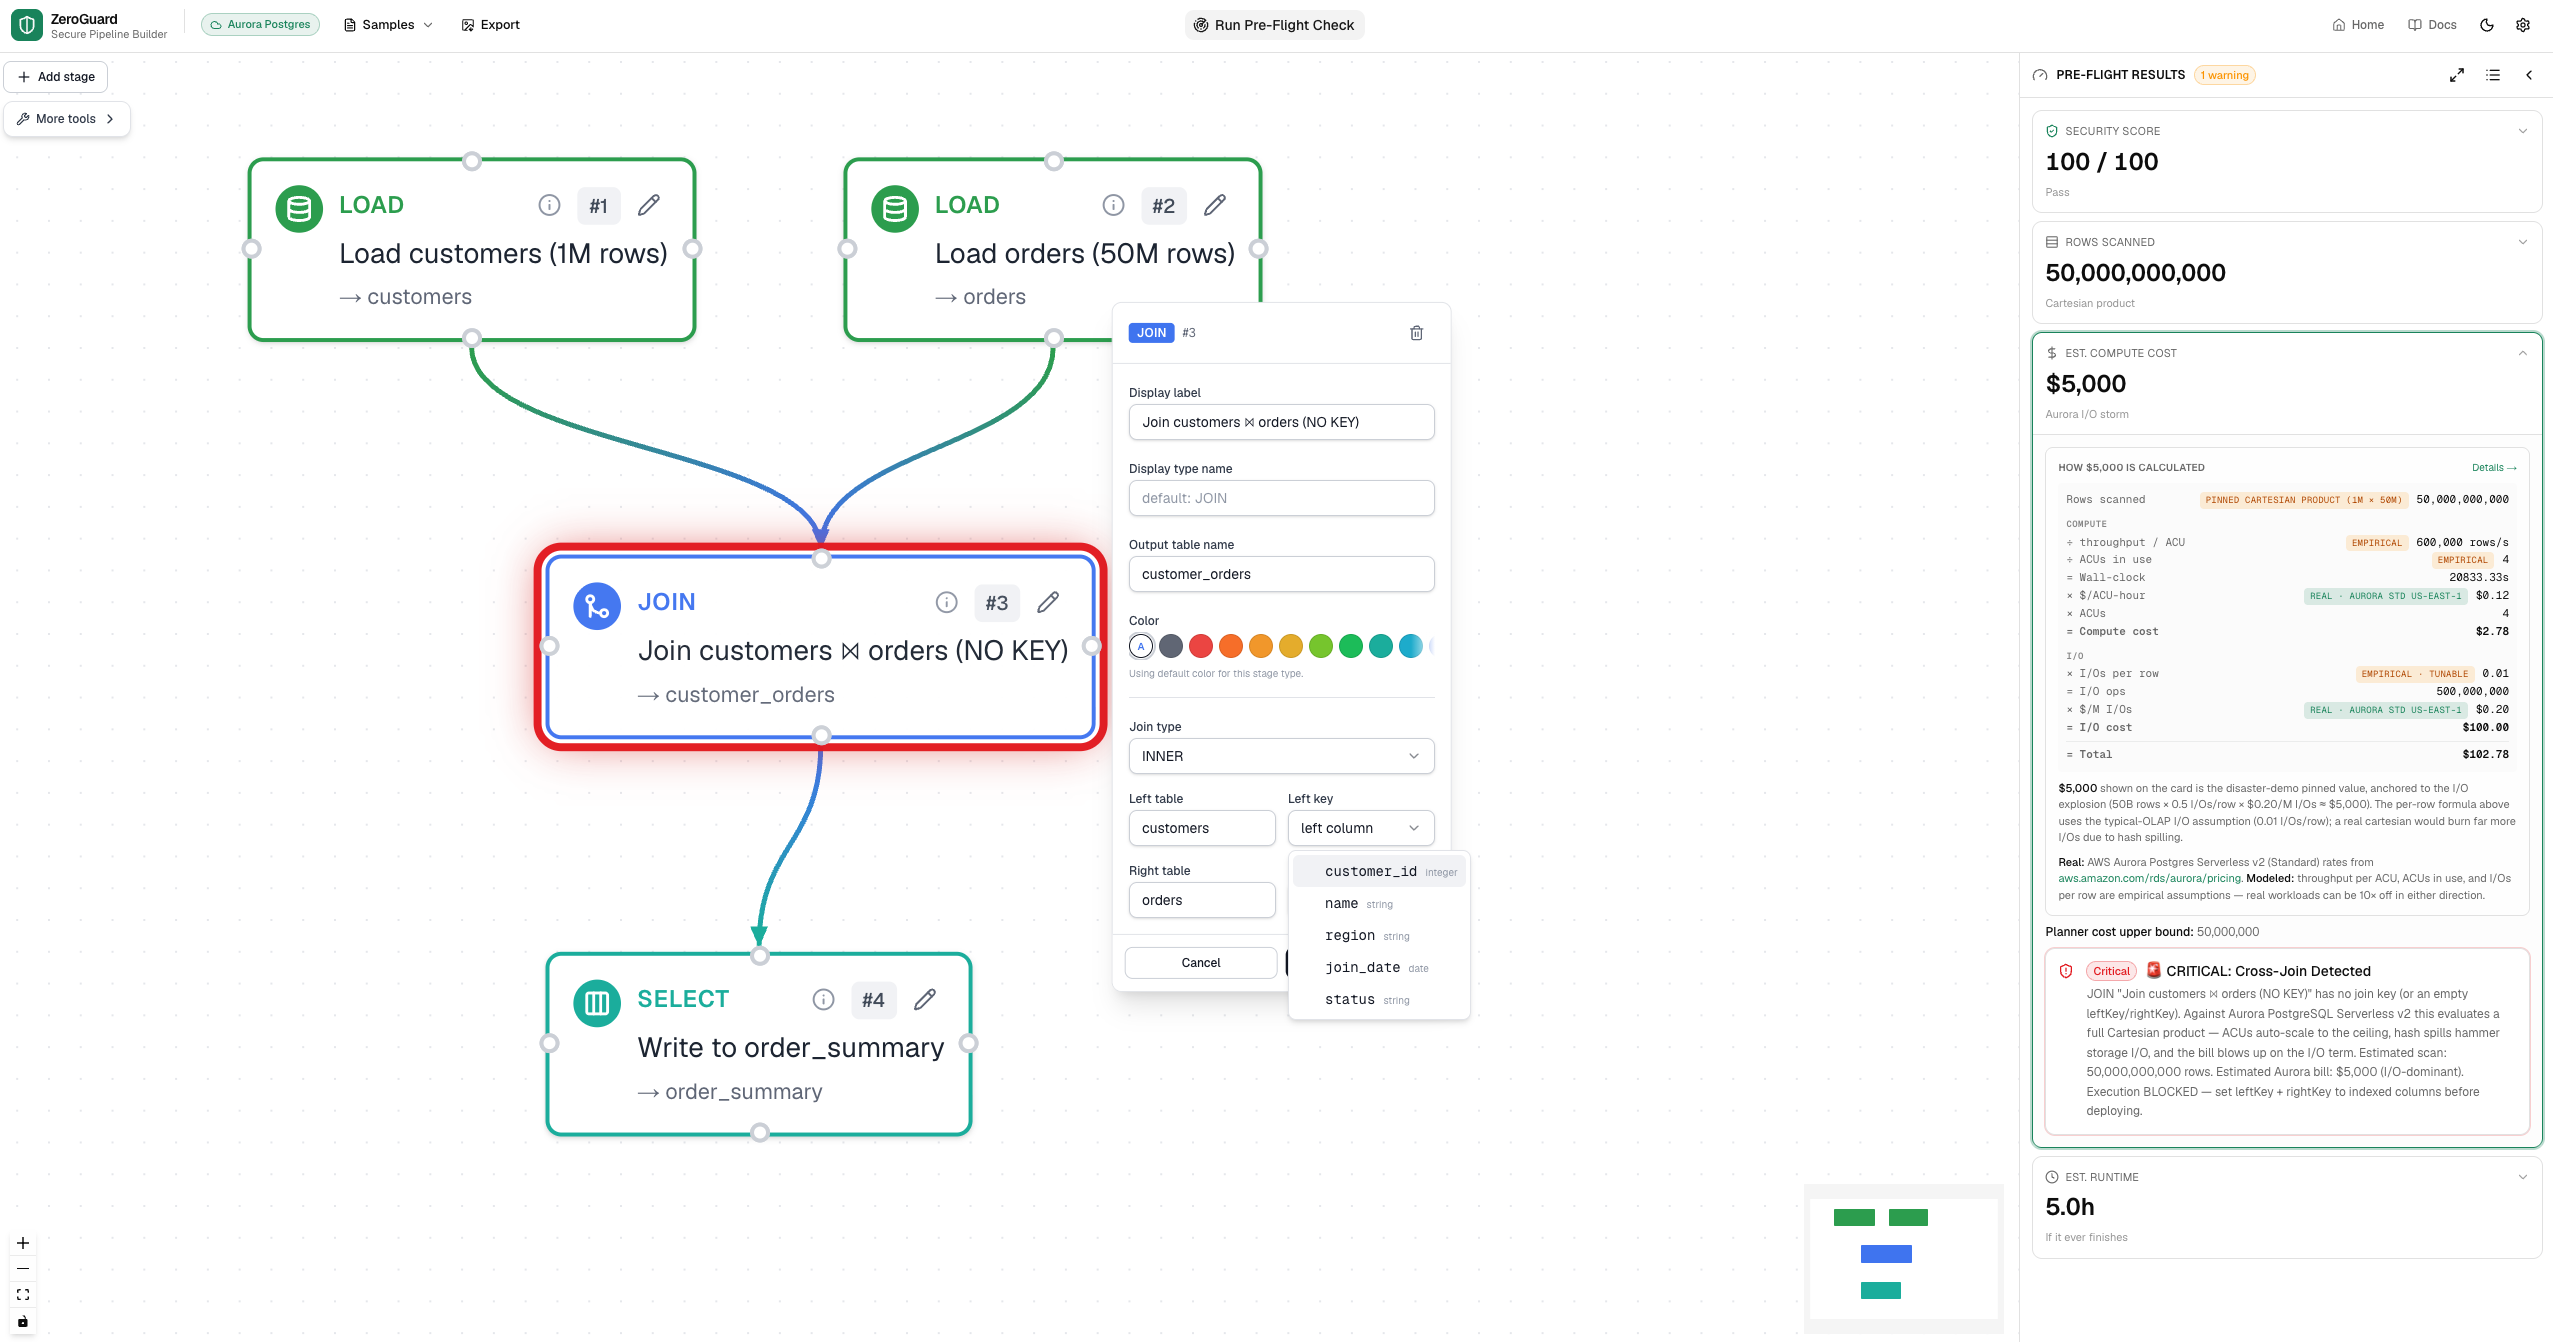
Demo: Cartesian disaster, fix
-
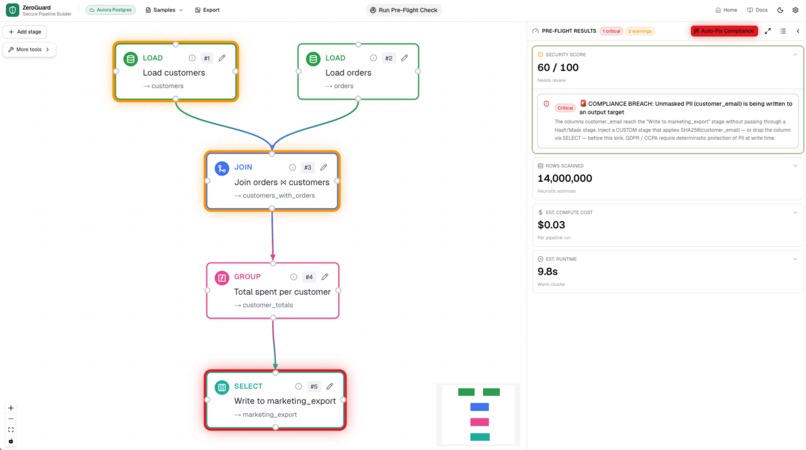
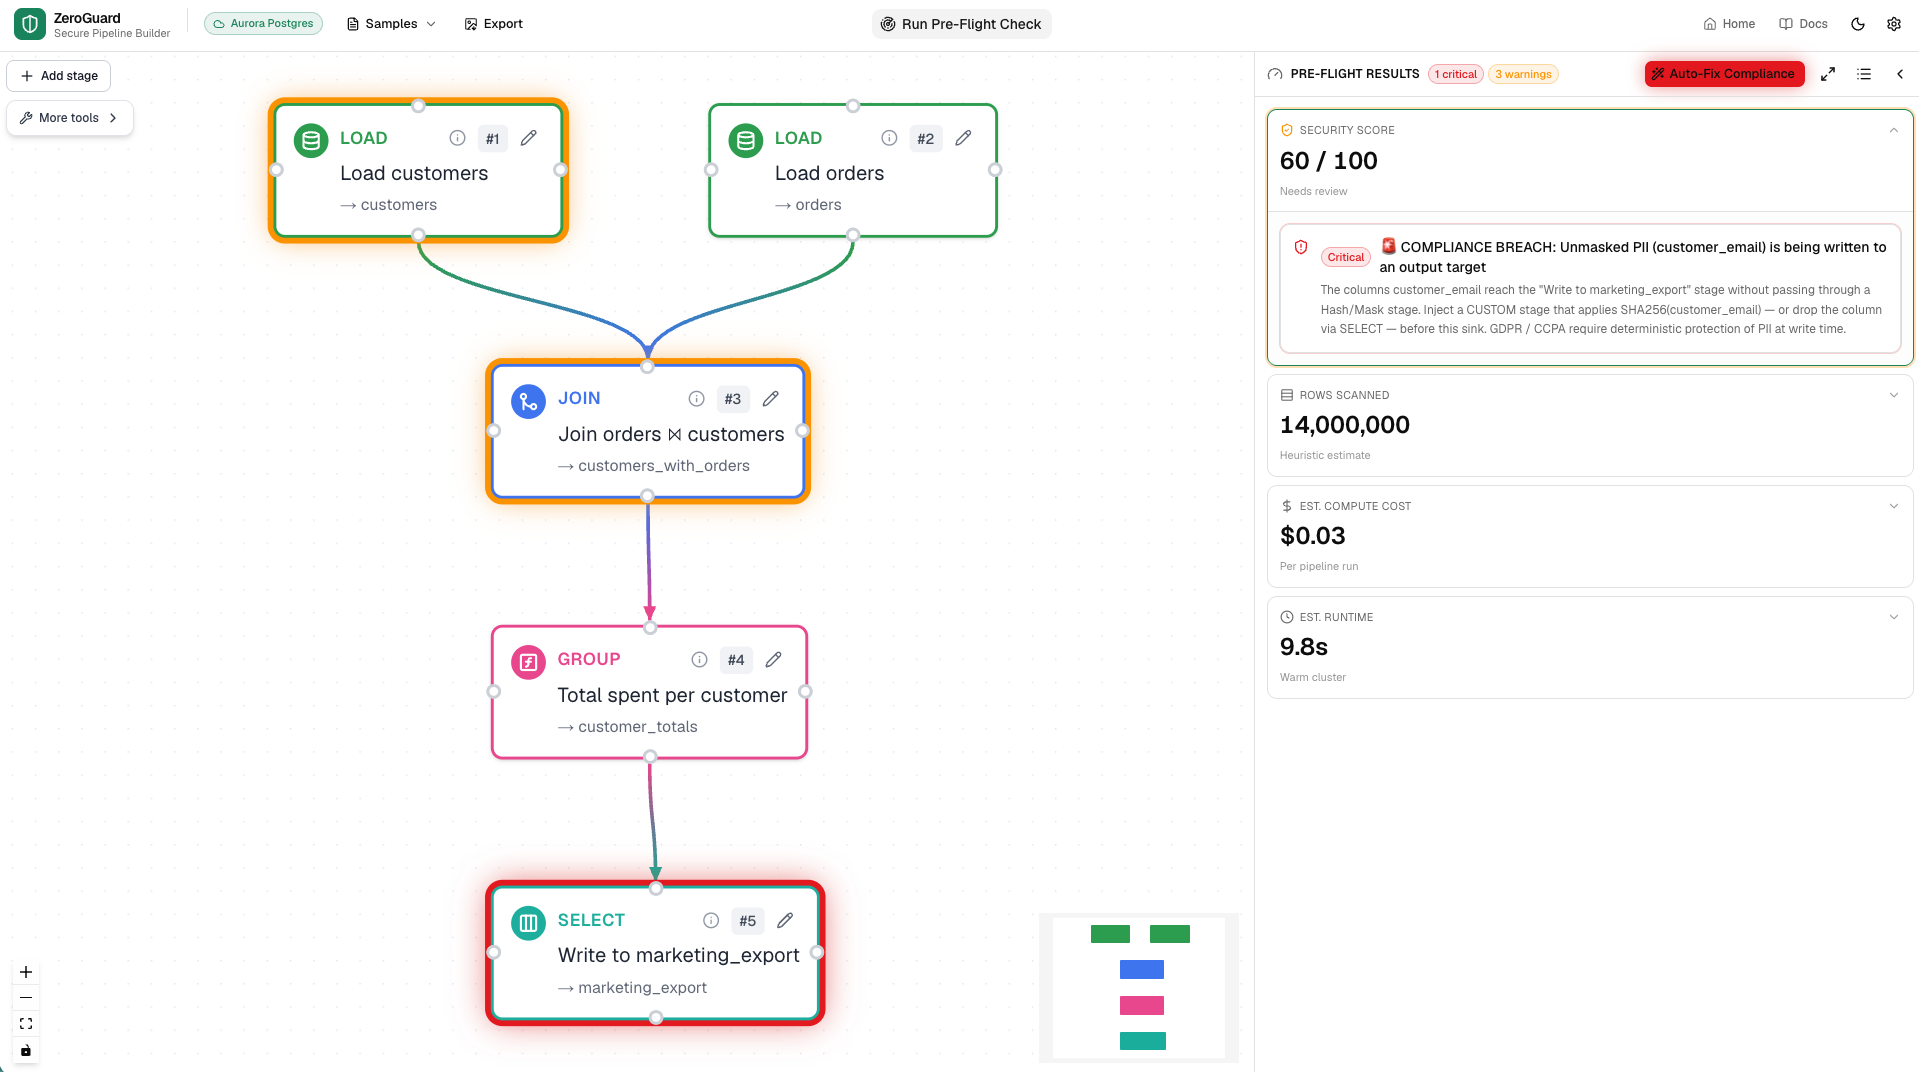
Demo: PII leak disaster
-
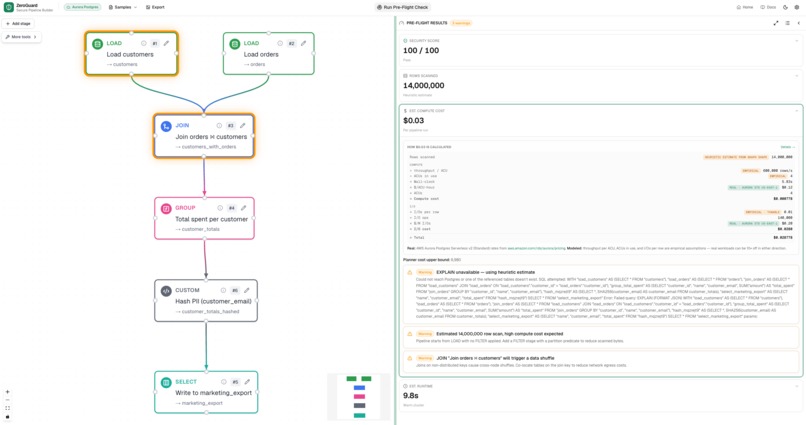
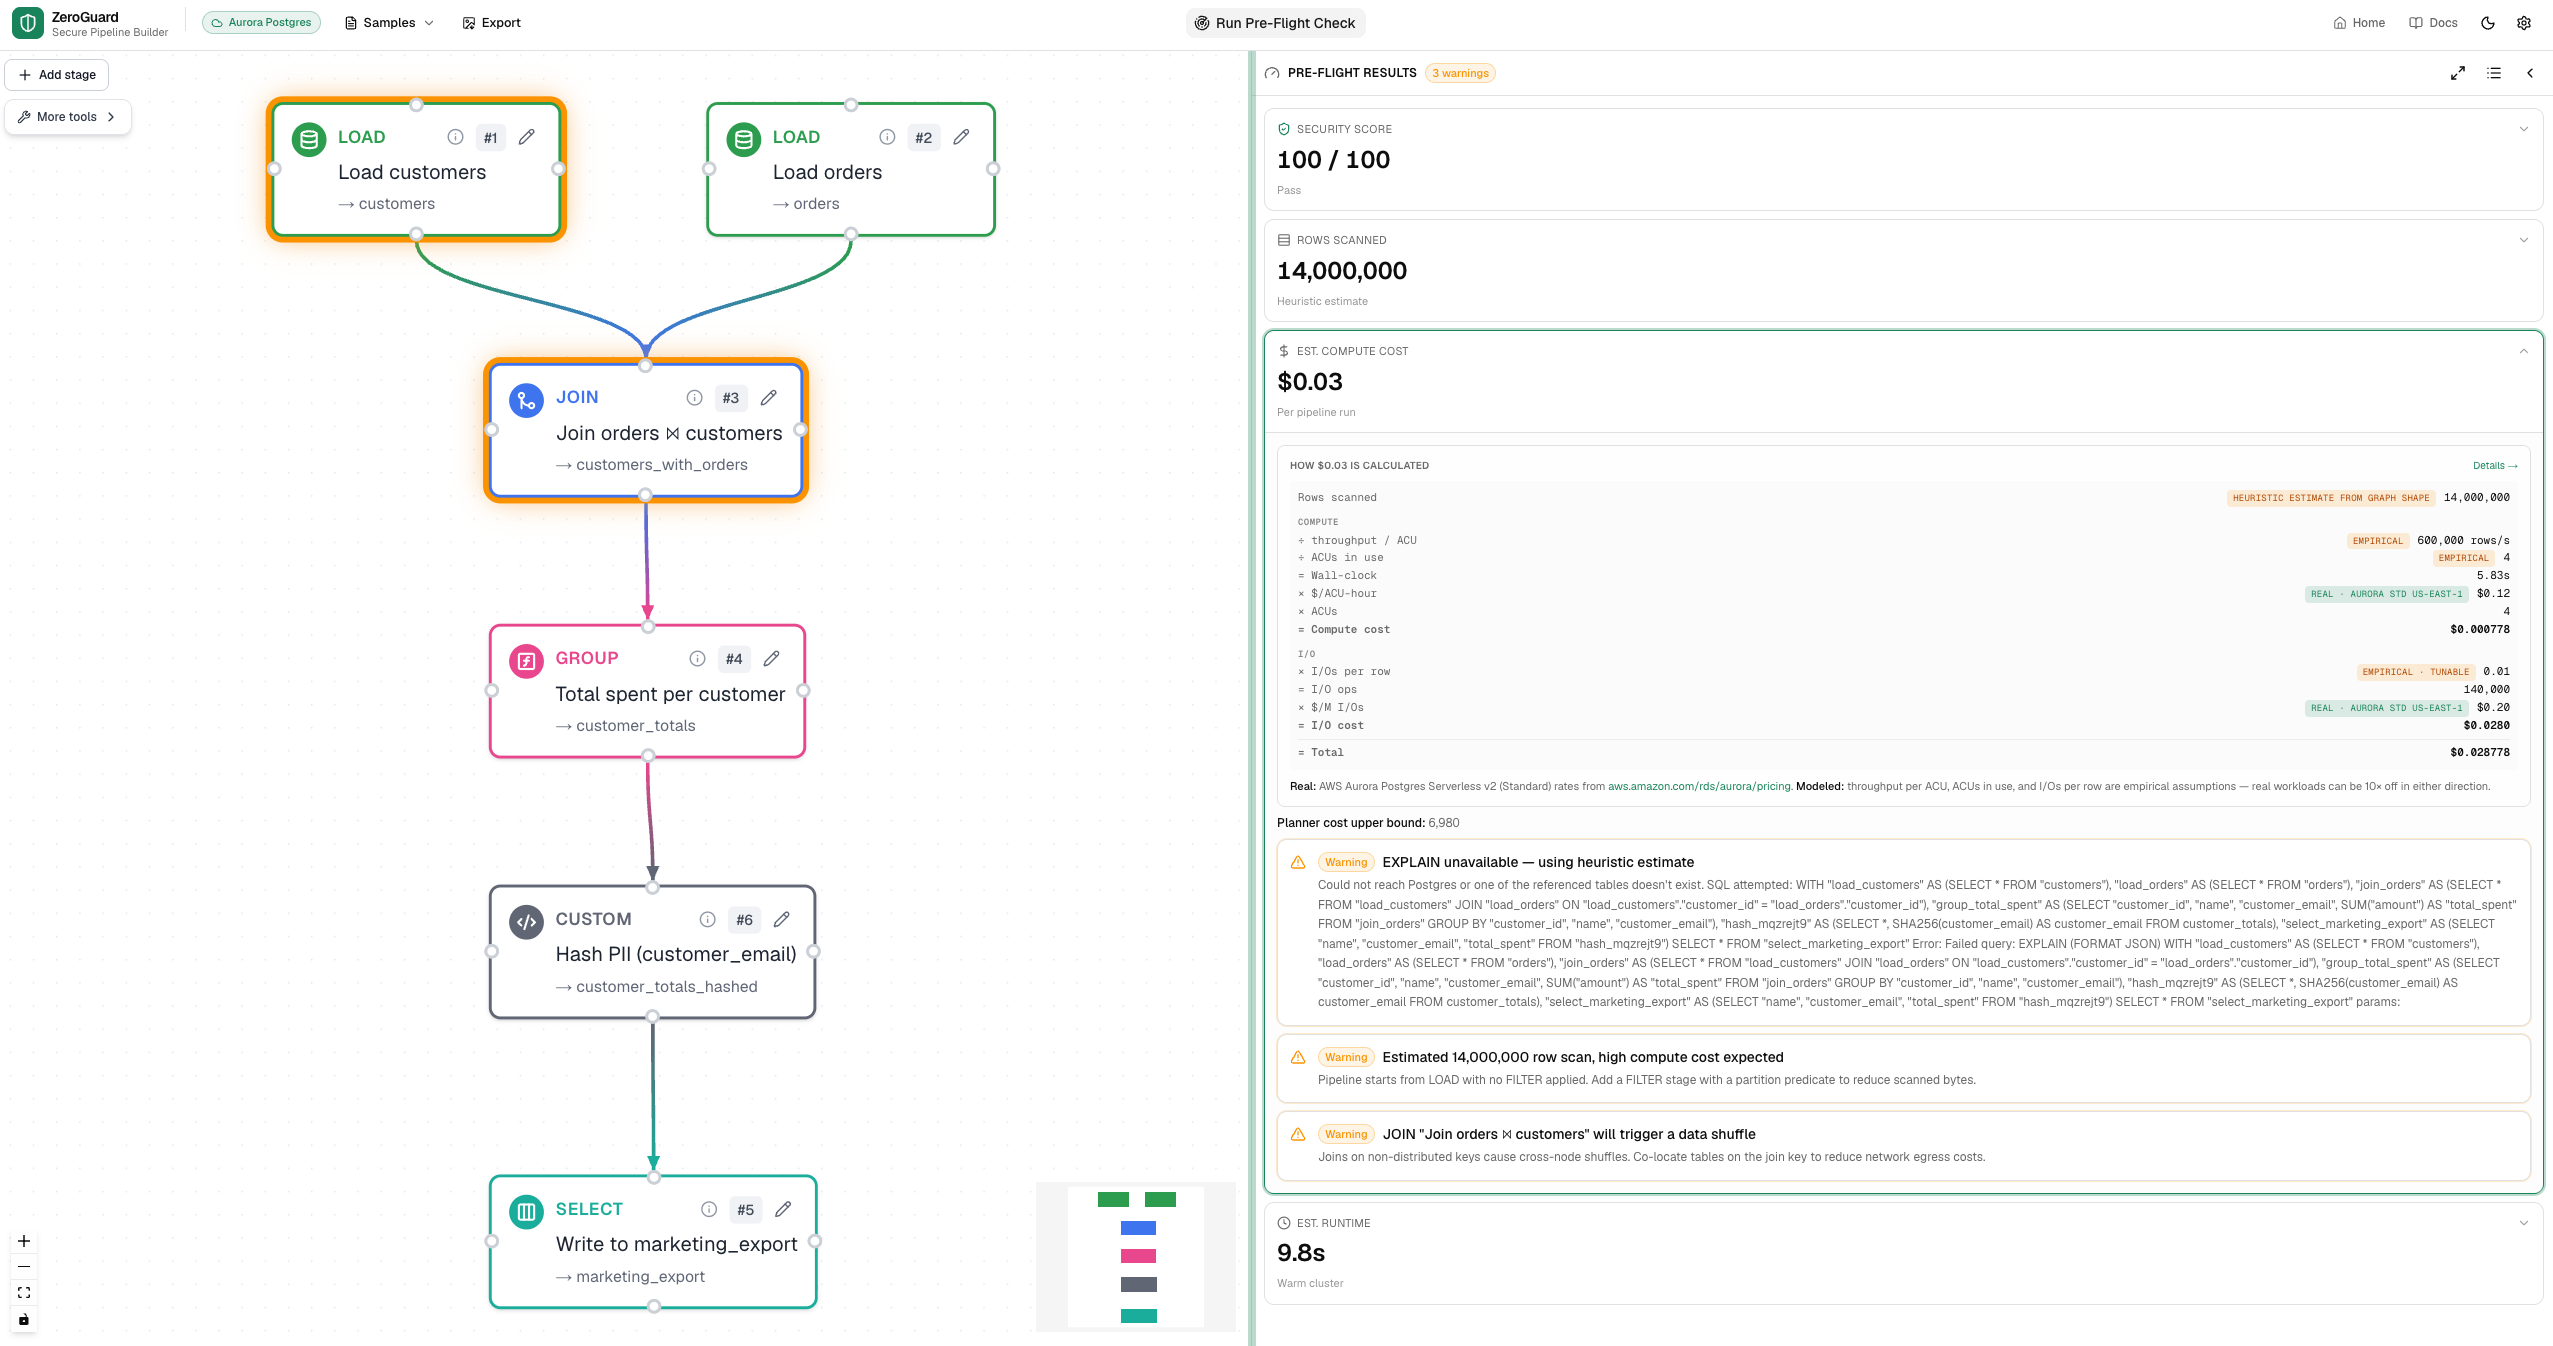
Demo: PII leak disaster, after auto-fix
-
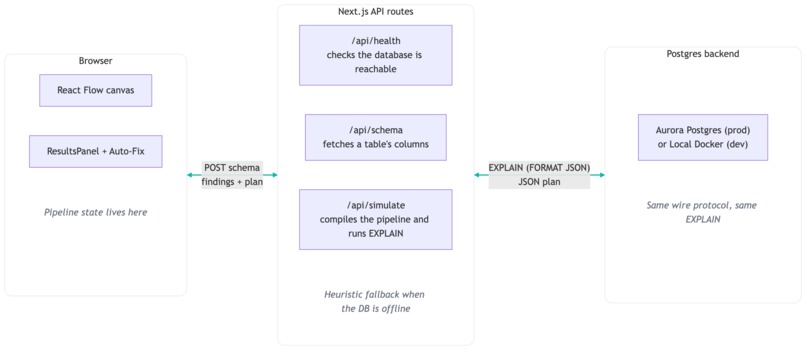
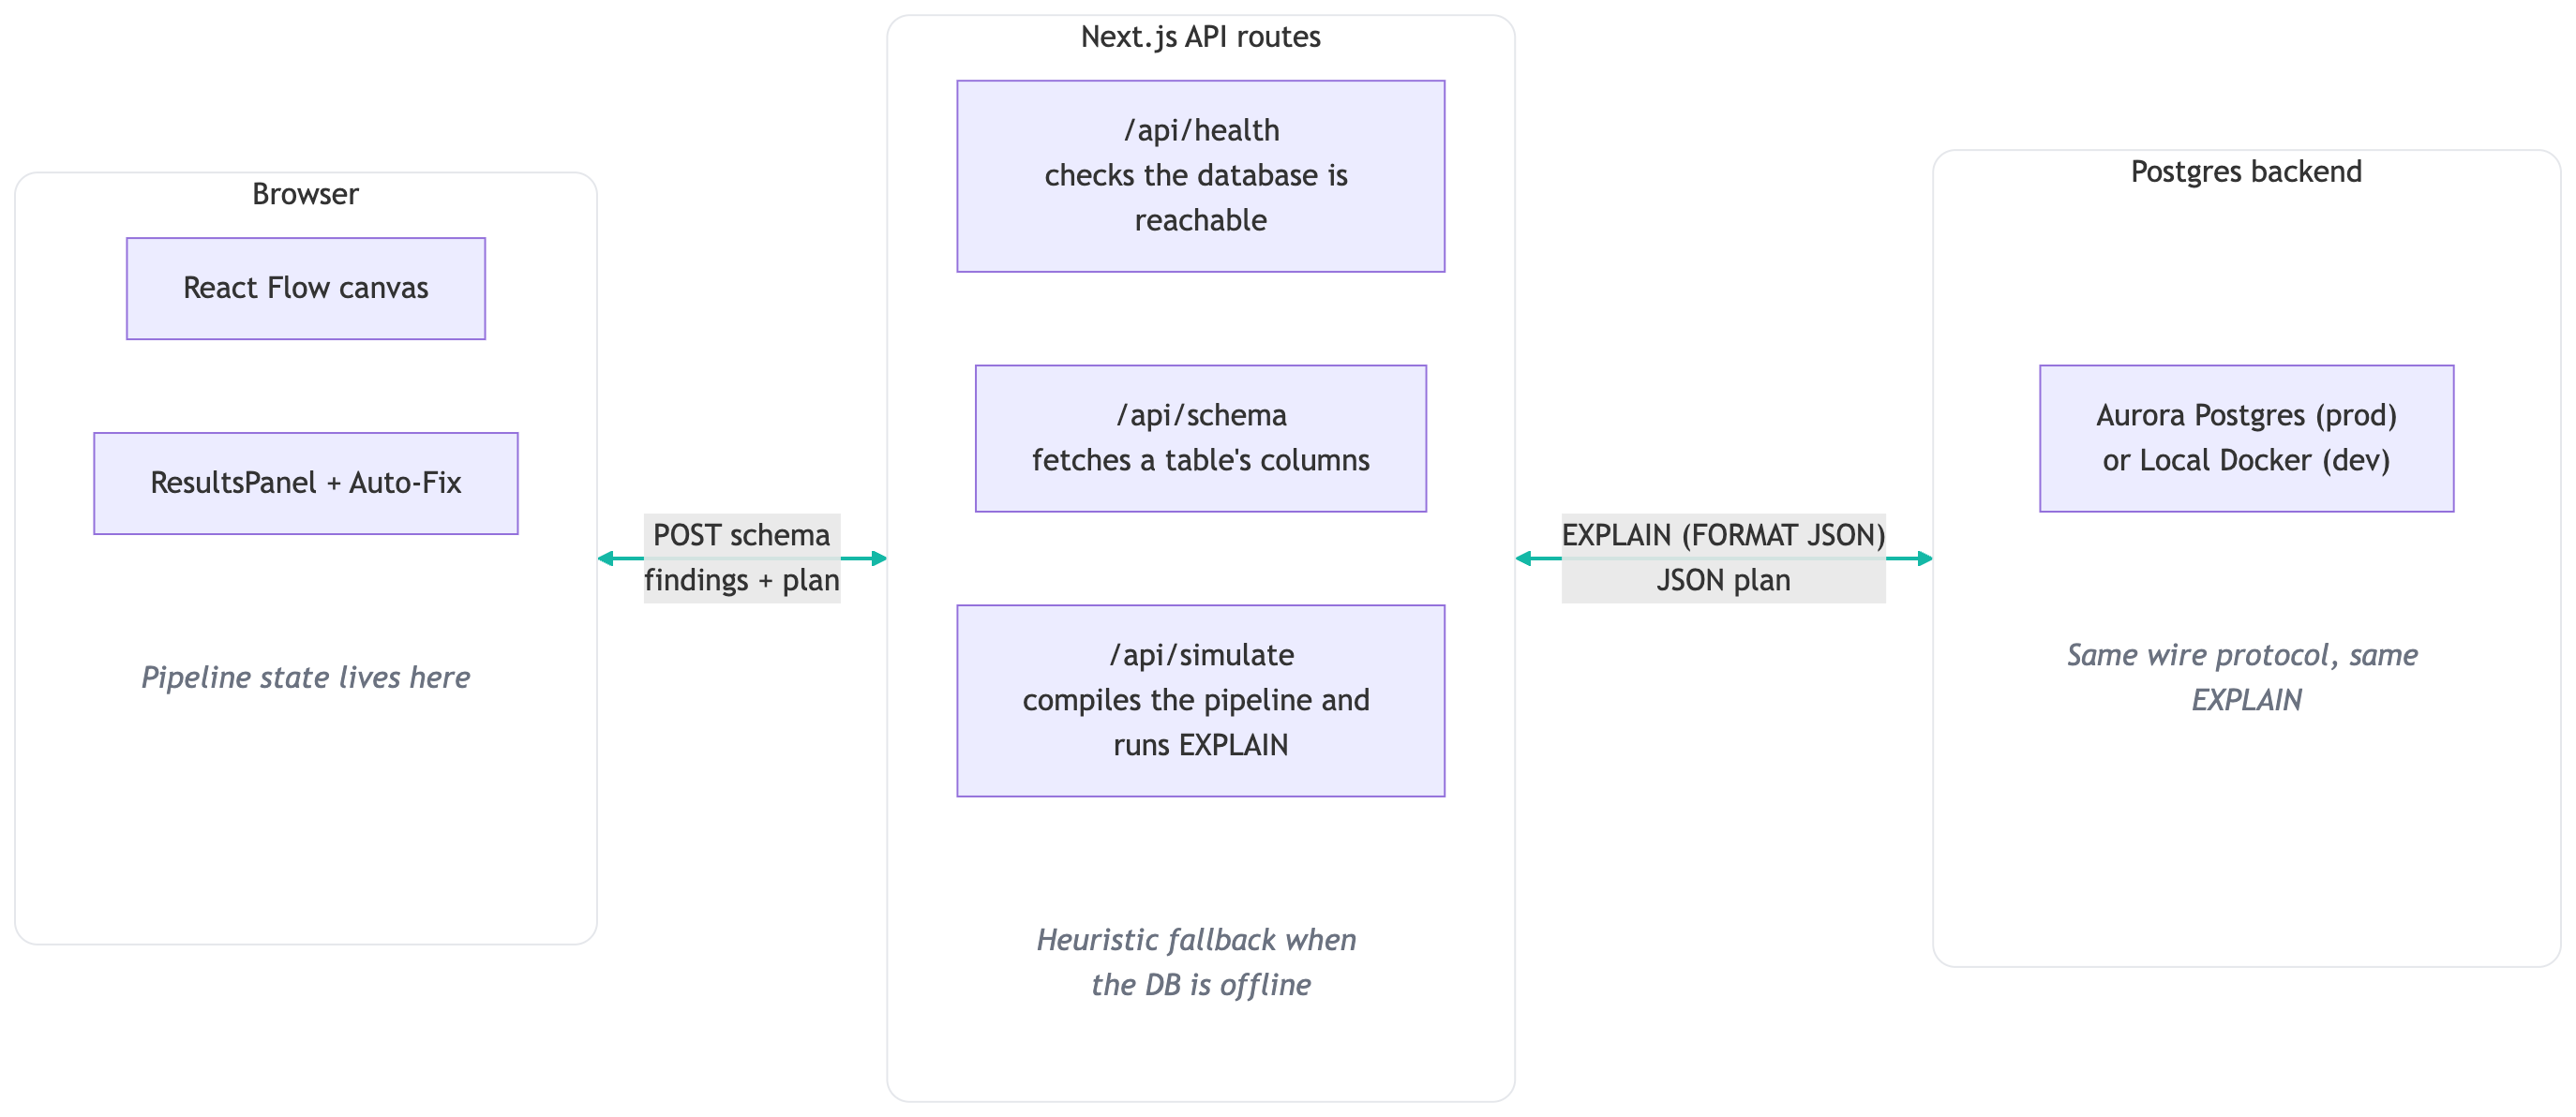
Architecture diagram
-
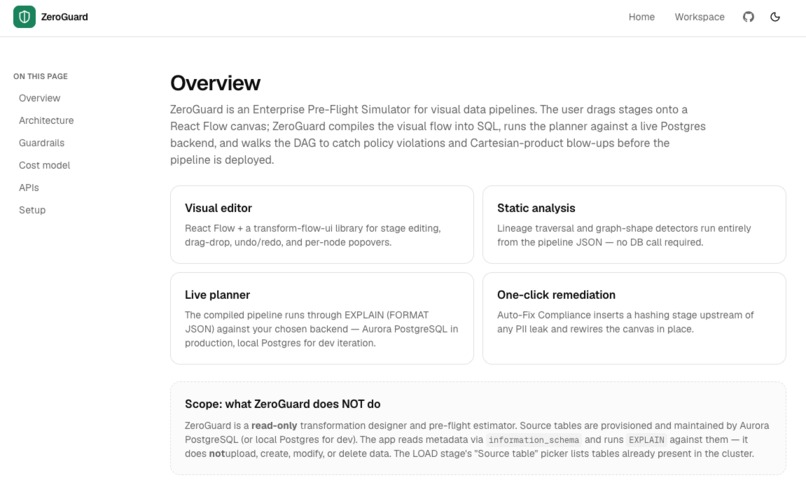
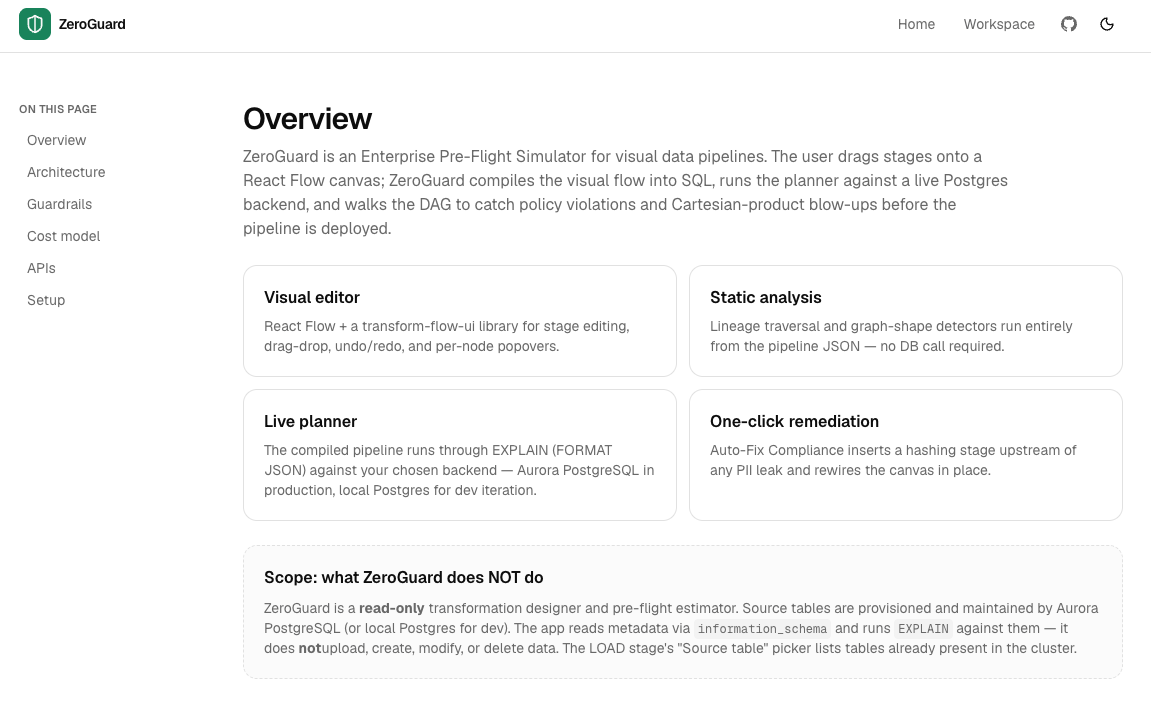
Docs page
About ZeroGuard
A pre-flight check for data pipelines. The full Devpost "About the project" writeup, kept in the repo so the source of truth lives next to the code it describes. Math uses LaTeX, since Devpost supports it.
Inspiration
Every commercial flight runs the same systematic check before takeoff — engines, flaps, fuel, instruments. Data pipelines don't. They get code-reviewed and merged, and the failures show up later: in next month's invoice, in an incident channel, or in a compliance finding from a team that wasn't in the review.
We kept seeing the same two flavors of post-merge bug:
- A join with a missing key on a customer-scale table — silently a Cartesian product, and the bill arrives 30 days later.
- A column with PII (an email, a phone number) flowing through a pipeline whose downstream sink is a marketing table or an analyst's spreadsheet.
The thing that bothered us was that both bugs are visible in the pipeline definition itself. They don't need production data to be detected. They need a tool that reads the pipeline before it runs and says no. That tool, we decided, was ZeroGuard.
What it does
ZeroGuard is a visual editor for data pipelines plus a pre-flight checker
that runs in the editor. The pipeline is a DAG of typed stages — LOAD,
FILTER, JOIN, GROUP BY, SORT, SELECT, UNION, VALIDATE,
CUSTOM SQL — and the user composes it on a React Flow canvas.
A pre-flight check does three things in one round trip:
- Compiles the entire DAG to a single SQL statement — every stage
becomes one CTE, and the terminal node becomes the outer
SELECT. - Runs
EXPLAIN (FORMAT JSON)against Aurora PostgreSQL and parses the planner's row estimates and total cost. The verbatim plan is surfaced in a "Postgres EXPLAIN plan" disclosure so the user can read it themselves — no hand-waving. - Traces PII lineage by walking the DAG from every source column to every output sink. Columns flagged as PII (by name or by upstream annotation) that reach a sink without passing through a hash, mask, or tokenize stage produce a critical finding.
Three categories of issue come out of this:
- Runaway cost. A Cartesian join, a missing
WHERE, an explosive GROUP BY. The cost card shows real-rate dollar estimates and the offending node glows red on the canvas. - Compliance breaches. Un-masked PII reaching a sink, an output table
that mixes hashed and raw email columns. The security score drops and
the user gets a one-click Auto-Fix Compliance button that inserts a
SHA-256hashing stage upstream and rewires the DAG. - Silent data corruption. Missing dependencies, broken column references, type mismatches, joins on nonexistent columns. These would pass code review and silently produce wrong numbers in production.
How we built it
The stack:
- Next.js 16 App Router with Turbopack, React 19, server components
for the marketing + docs pages and
"use client"for the workspace. - React Flow (
@xyflow/react) for the canvas, on top of a forkedtransform-flow-uilibrary that gave us stage editing, drag-drop, undo/redo, and popovers. - Drizzle ORM over a standard
pg.Pool(node-postgres) talking to Amazon Aurora PostgreSQL Serverless v2. No AWS-proprietary code on the hot path — same SQL, sameEXPLAIN, sameinformation_schemayou'd hit in any Postgres. - Three API routes (
/api/health,/api/schema,/api/simulate), each one a thin Next.js route handler.
The cost model is the part we're most opinionated about. Aurora Postgres
Serverless v2 (Standard, us-east-1) bills two things: compute
($0.12 per ACU-hour) and storage I/O ($0.20 per million I/O
operations). For a per-query estimate we compute:
$$ \text{cost} \;=\; \underbrace{\frac{\text{rows}}{R_{\text{ACU}} \cdot N_{\text{ACU}}} \cdot \frac{P_{\text{ACU}}}{3600} \cdot N_{\text{ACU}}}{\text{compute}} \;+\; \underbrace{\frac{\text{rows} \cdot I{\text{row}}}{10^{6}} \cdot P_{\text{IO}}}_{\text{I/O}} $$
Where the real AWS rates are:
$$P_{\text{ACU}} = \$0.12 \text{ / ACU-hour}, \qquad P_{\text{IO}} = \$0.20 \text{ / million I/Os}$$
And the empirical knobs (calibrate to your workload) are:
$$R_{\text{ACU}} = 600{,}000 \text{ rows/sec/ACU}, \quad N_{\text{ACU}} = 4 \text{ ACUs per query}, \quad I_{\text{row}} = 0.01 \text{ I/Os per row}$$
We keep the rates and the knobs separate in the source, and we surface a
costBasis enum ("live-explain" | "heuristic" | "cartesian-pinned") so
the UI can tell the user which path produced the dollar number. That
honesty matters more than a single confident-looking estimate.
Auto-Fix Compliance is a pure client-side mutation of the pipeline JSON.
When a PII finding fires, we insert a CUSTOM stage upstream of the
leaked sink with SQL like:
SELECT *, SHA256(customer_email) AS customer_email
FROM <upstream>
The * plus the aliased SHA256(col) AS col shadows the original column
name, so downstream stages that still reference it by name see the hashed
value. Then we rewire the edges and shift the descendants. No DB round-trip
— the fix works even when the cluster is unreachable.
Challenges we ran into
Wrong AWS product. We initially built against Aurora DSQL, then the deployed cluster turned out to be classic Aurora PostgreSQL (a
*.rds.amazonaws.comendpoint). DSQL bills per DPU, Aurora bills per ACU-hour plus I/O — entirely different cost shapes. We did a multi-pass sweep across UI, docs, and the cost model. The DSQL path stayed in the repo as an alternative deployment target, but everything user-facing is calibrated for Aurora Postgres now.Cost model is two-term. Compute alone undersells the disaster scenarios — a runaway Cartesian product on Aurora Standard is I/O-dominated, not compute-dominated. We had to model both terms and decide which empirical knob represented what. The cartesian disaster's $5{,}000 figure is the I/O term dominating:
$$50 \times 10^{9} \text{ rows} \times 0.5 \text{ I/Os/row} \times \frac{\$0.20}{10^{6}} \approx \$5{,}000$$
Mermaid bidirectional layout flipping. Our architecture diagram had forward + reverse edges between Browser, API, and DB. In
flowchart LRmode, Mermaid's dagre layout treated the bidirectional pairs as ambiguous and laid the diagram out right-to-left. Invisible~~~rank hints didn't override it. We had to collapse each pair to a single<-->edge so the underlying graph was unambiguously forward.React Flow state is lossy. The canvas only stores nodes and edges, not the original dataset column declarations from the loaded sample. When the user opened the JOIN edit popover, the dropdowns degraded to free-text inputs because the live schema had empty
datasets. We threaded the originaldatasetsdict through auseRefand merged it back in when computing column lookups.Empirical knobs vs. AWS rates. AWS publishes the dollar rates but doesn't publish "rows per ACU-second" or "I/Os per row" — those depend on your data, your indexes, and your cache hit rate. We split the cost model into "real rates" (don't touch) and "empirical knobs" (calibrate-to-your-workload) so the source code reflects which is which, and the docs explain how to measure the knobs against your own Aurora cluster with Performance Insights.
Accomplishments that we're proud of
- The cost model is honest about its sources. Three estimation paths
(
live-explain,heuristic,cartesian-pinned), each with a distinct UI label. A user can always tell whether the dollar number came from a real Aurora EXPLAIN, a graph-shape heuristic, or a pinned disaster scenario. - Auto-Fix Compliance works offline. It's a client-side graph rewrite. Even with the cluster burning, you can still patch your pipeline.
- Three demo pipelines, three complete stories. "Revenue by region" is a real query running a real EXPLAIN against Aurora. "Cartesian join" shows a $5{,}000 mistake before it ships. "PII leak to marketing" shows the GDPR breach + the one-click fix.
- No AWS-proprietary code on the hot path. Same SQL, same EXPLAIN,
same
information_schemayou'd run in any Postgres. Aurora is the deployment target, not a lock-in.
What we learned
- Aurora Serverless v2 (Standard) is I/O-dominated for big scans. The compute term is bounded by the ACU floor; the I/O term grows linearly with rows touched. If you're cost-modeling Aurora workloads, the I/O term is where the dollars live.
EXPLAINgives youPlan RowsandTotal Cost, but not dollars. Total Cost is in planner units (~milli-page-reads), not currency. Converting to dollars means modeling ACU-time and I/O-ops yourself.Plan Rowsfrom a non-ANALYZEd table is a guess. Postgres defaults to 1 row when stats are missing. The seed scripts indocs/AURORA_POSTGRES_SETUP.mdanddocs/LOCAL_DEV.mdend withANALYZEfor this reason — without it, the cost path silently collapses to "everything is one row."- Mermaid layout is dagre under the hood. Bidirectional edges are
surprisingly ambiguous to dagre, and source-order tiebreakers don't
always go the way you expect. When in doubt, eliminate reverse edges
by collapsing pairs into
<-->. - React Flow's representation is lossy. Anything that isn't a node or an edge — dataset column declarations, pipeline metadata, original sample JSON — has to be threaded through your own React state. The schema you serialize back out is not the schema you loaded in.
What's next for ZeroGuard: A Pre-Flight Check for Data Pipelines
- More guardrails. Missing
GROUP BYcolumns, schema drift (the table you're scanning grew a new column upstream), expected row-count assertions, type coercion warnings, broken column references caught at compile time instead of EXPLAIN time. - Programmatic pricing. Pull rates from the AWS Pricing API
(
pricing.us-east-1.amazonaws.com, service codeAmazonRDS) instead of hardcodingACU_HOUR_USDandIO_PER_MILLION_USD. Cache 24h, key by region. - I/O-Optimized cost variant. Aurora's I/O-Optimized configuration zeroes the I/O term and raises the ACU rate ~30%. For an I/O-heavy workload (like the cartesian disaster) it changes the cost shape from $\$5{,}000$ to $\sim\$15$. A "what if we switched to I/O-Optimized?" toggle would let users see that tradeoff inline.
- CI integration. A
zeroguard check pipeline.jsonCLI that fails the build if the pipeline has a critical finding. Pre-flight in code review, not just in the editor. - More PII detectors. Right now we detect by column name (
email,phone,ssn, etc.) and by upstream annotation. A regex-based content sampler againstinformation_schemacould catch un-annotated columns whose values match PII patterns. - Multi-database support. The hot path is already vendor-neutral Postgres SQL, so plain Postgres + MySQL would be a small port. Aurora DSQL is already wired in as a code path; we'd flip it on when the pricing question stabilizes.
Built With
- amazon-aurora
- amazon-web-services
- aurora-postgresql
- drizzle-orm
- next.js
- node-postgres
- node.js
- postgresql
- react
- react-flow
- sql
- tailwind
- typescript
- vercel


Log in or sign up for Devpost to join the conversation.