


Inspiration
When we learned that the CDC 2025 theme was zero gravity, we all reminisced about how we had dreamed of space exploration as kids. As we got older, we assumed that was an unrealistic dream. Becoming an astronaut seemed so "elite." When we discovered that there was a dataset with astronaut data, we wanted to analyze it and determine if this assumption was true.
What it does
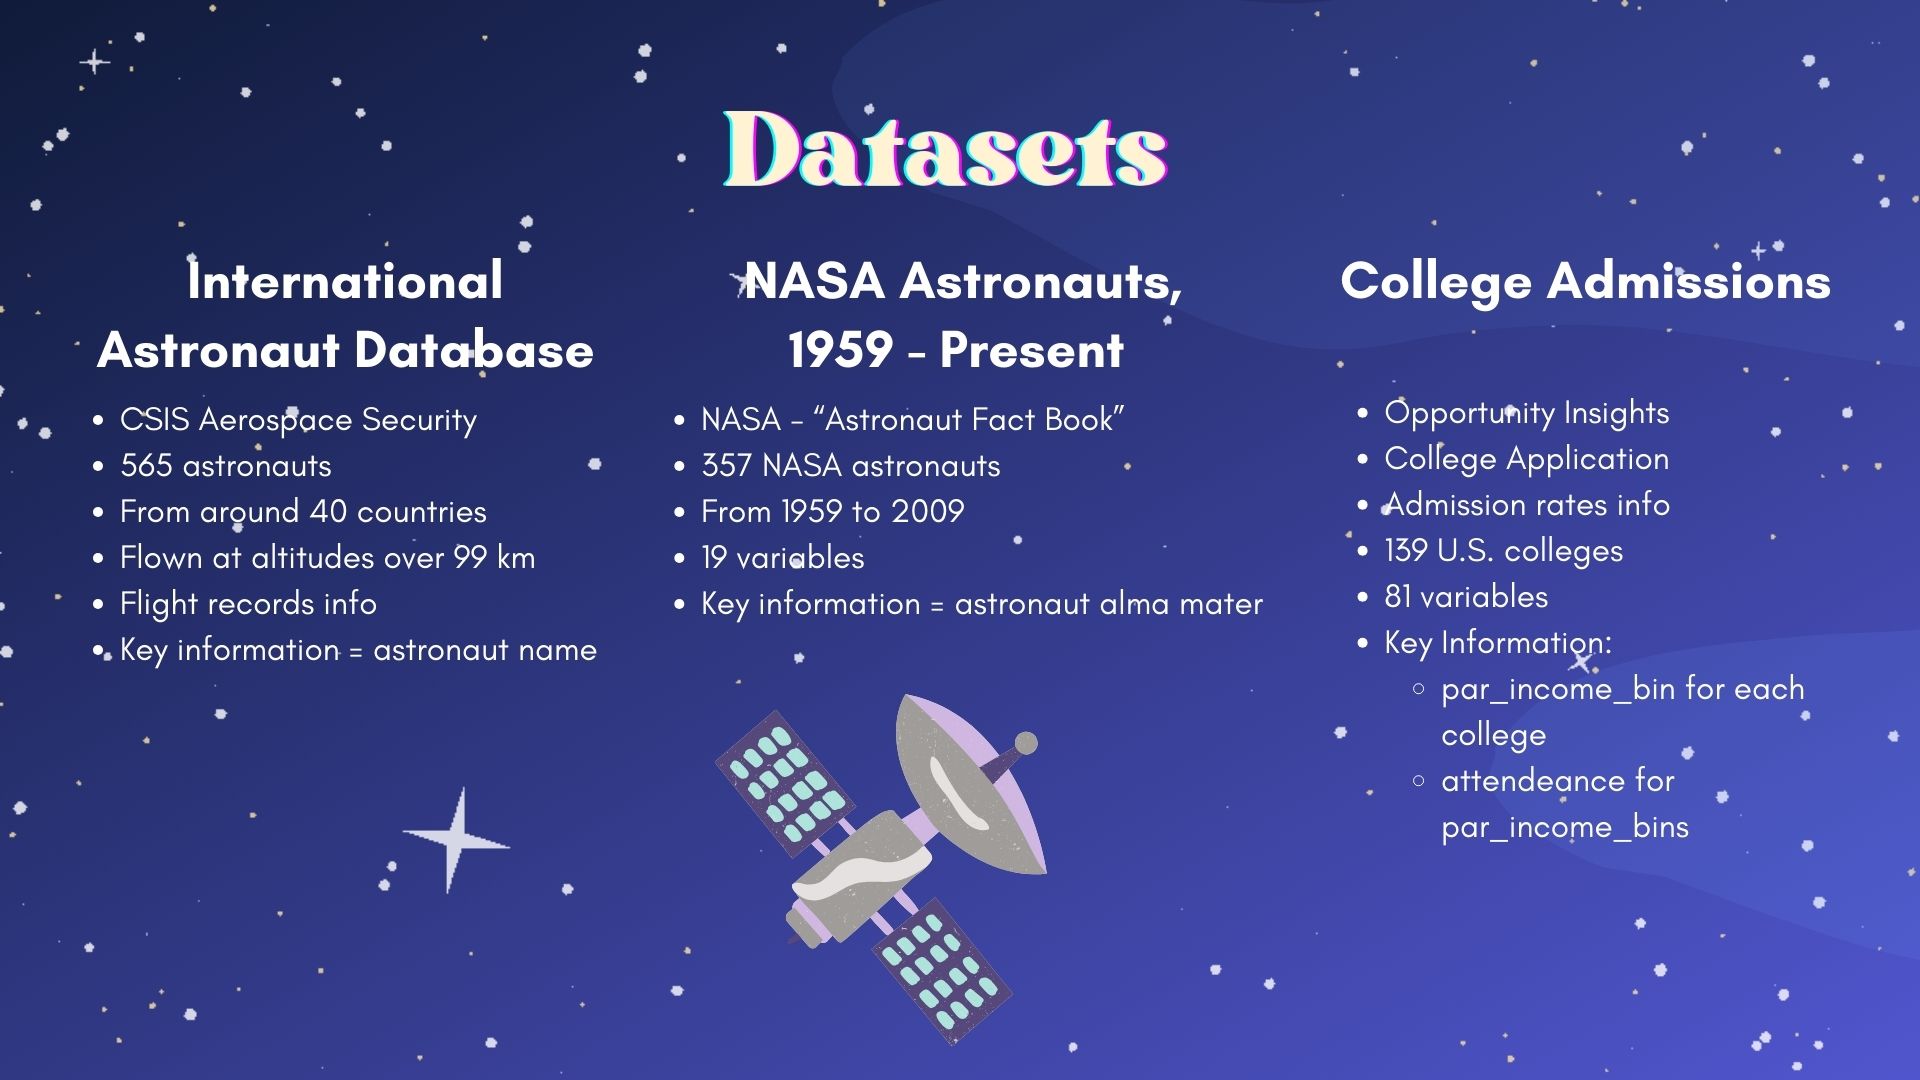
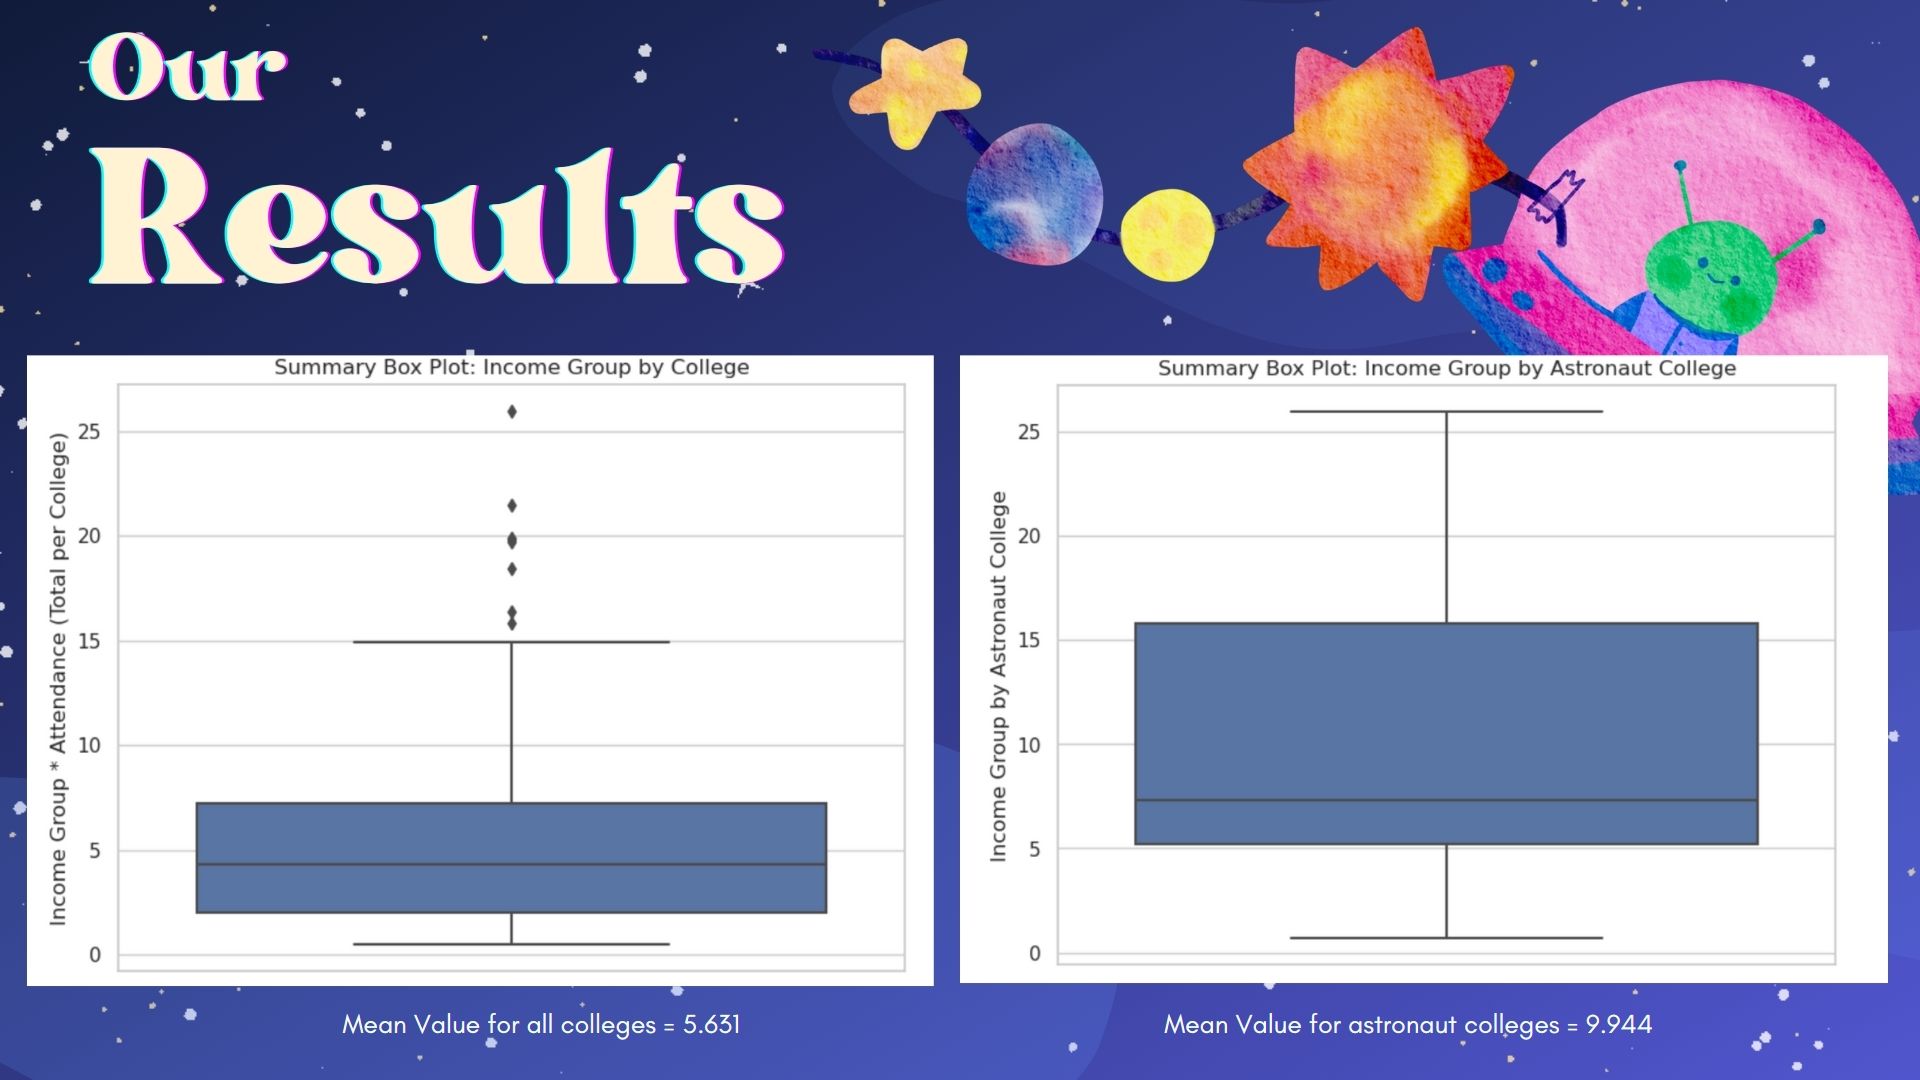
Our project calculates an index that defines the average socio-economic backgrounds of the student population at various institutions in the United States. Next, our project compiles data from three different datasets (International Astronaut Database, NASA Astronauts, 1959 - Present, and College Admissions datasets) to create a new dataframe that includes selected NASA astronauts from 1959 to 2009, the colleges they attended, and the created socio-economic index for these specific colleges. Then, we calculated the minimum, maximum, median, and mean values for the NASA astronauts and all colleges in the College Admissions dataset and plotted these values in a box plot.
How we built it
We used Jupyter Notebook, Pandas, and Python as our tools. First, we calculated the socio-economic index by multiplying the par_income_bin and attendance for each percentile of income groups at all colleges in the College Admissions dataset. Next, we added the values of all percentile groups within each college to obtain a single standardized socio-economic index for each college. This then allowed us to compare the average socio-economic status of the student population at each college. We also standardized astronaut names in the NASA Astronauts, 1959 - Present dataset to match the astronaut names in the International Astronaut Database that we were given. Then, we iterated through each astronaut's colleges to find the socio-economic index associated with that astronaut. Most astronauts attended multiple colleges. However, due to our time constraints, we chose to use the socio-economic index of the first college that matched the other colleges in the College Admissions datasets. In the end, these steps left us with a dataframe of 112 astronauts, the colleges they attended, and the socioeconomic index for one of those colleges. Finally, we calculated the minimum, maximum, median, and mean values for the NASA astronauts and all colleges in the College Admissions dataset and plotted these values in a box plot.
Challenges we ran into
We originally had a few different ideas. First, we wanted to examine the GDP per capita for each country over time and the number of successful missions per country to determine if a correlation existed. However, mission names were not standardized across different datasets, the years we were interested in analyzing were not present in all datasets, and there were no datasets about the space economy of other countries. Thus, we switched gears to our current project idea. The main challenges we ran into when working on our analysis were that we had limited knowledge of using Jupyter Notebook. Therefore, we spent much time debugging and learning how to use Jupyter Notebook along the way.
What we learned
We discovered that the median and mean values of the astronauts' colleges' socio-economic indexes were higher than the median and mean values of the socio-economic indexes of all colleges. This led us to conclude that astronauts seem to be coming from colleges with higher socio-economic backgrounds.
Accomplishments that we're proud of
We are proud that we persevered and can submit an end project despite going through many ideas and obstacles. We are also proud that we expanded our Juptyer Notebook skills. Finally, we are happy that we met through the Carolina Data Challenge and created a cherished friendship.
What's next for Zero Gravity: A Luxury or A Right?
It would be interesting to expand our analysis to an international scale. We would need more data about the education of the astronauts outside of NASA, and the income information of the student populations at those colleges. Also, since many astronauts attended multiple colleges, we would like to consider an average of the indices for all the colleges they attended rather than focusing on one college.
Built With
- jupyternotebook
- python


Log in or sign up for Devpost to join the conversation.