Inspiration
At 3:00 AM when a critical service goes down, SRE teams scramble through dashboards, logs, and terminals trying to piece together what happened — often taking 30+ minutes to isolate a root cause that could have been found in seconds. We asked ourselves: what if an AI agent could autonomously investigate incidents the way a senior SRE would, chaining observability queries, correlating security events, and producing a full forensic report — all before a human even opens their laptop? That's the core idea behind the Zero-Day Forensic Investigator: an autonomous agent that treats every Dynatrace incident as a crime scene and performs a complete digital forensic triage in real time.
What it does
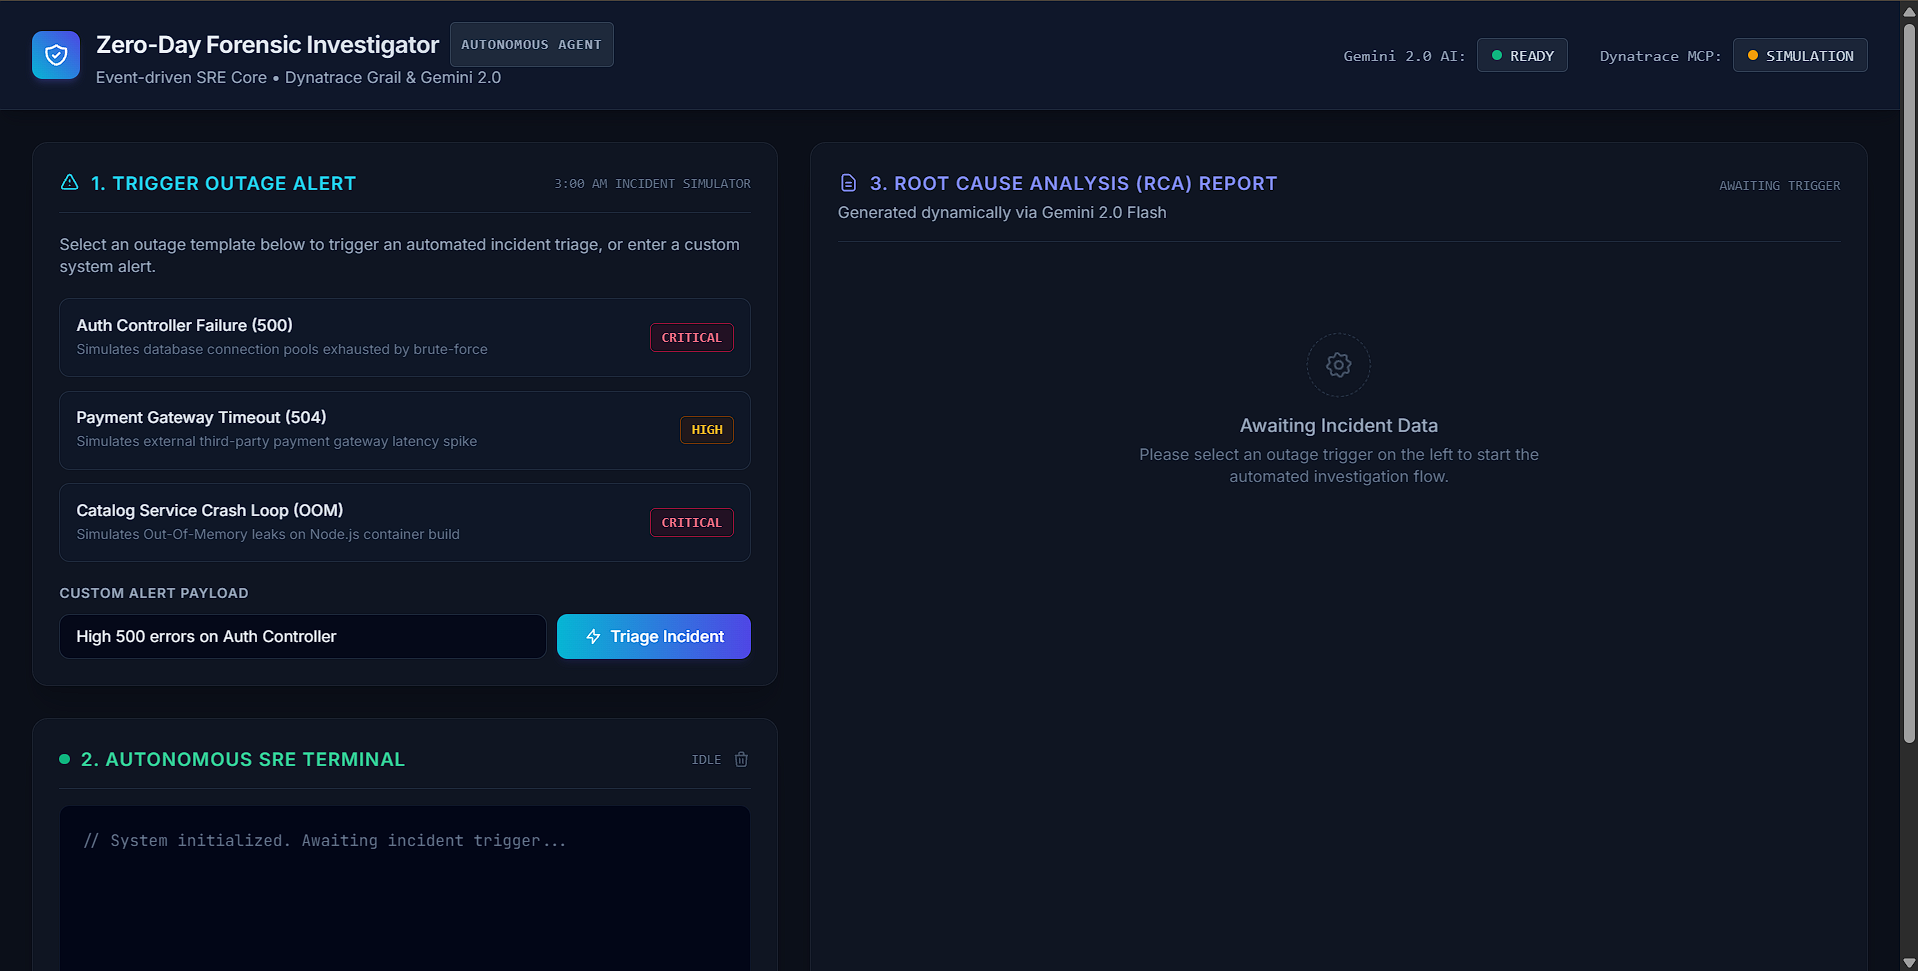
The Zero-Day Forensic Investigator is an event-driven AI agent that: Ingests incident alerts from Dynatrace (or simulated outage templates — Auth Controller 500 errors, Payment Gateway timeouts, OOM crash loops). Autonomously investigates by chaining multiple diagnostic tool calls via the Model Context Protocol (MCP) — querying service topology maps, executing DQL (Dynatrace Query Language) queries against Grail log data, and pulling security audit events. Streams its reasoning in real time to a live SRE terminal UI, showing every query it formulates, every tool it calls, and every piece of telemetry it retrieves. Produces a structured Root Cause Analysis (RCA) report identifying the exact culprit (malicious IP, failing dependency, memory leak), the technical mechanism, supporting log evidence, and a ready-to-execute remediation command (e.g., kubectl rollout restart, iptables -A INPUT -s -j DROP). Offers one-click remediation approval, letting an SRE specialist authorize and execute the proposed fix directly from the dashboard.
How we built it
AI Reasoning Engine: Google Gemini 2.5 Flash with function-calling (tool-use) capabilities. We inject MCP tool schemas as Gemini function declarations so the model can autonomously decide which observability queries to run. Tool Integration Layer: Model Context Protocol (MCP) SDK over SSE transport, connecting to a MongoDB Atlas MCP server to query real production telemetry (logs, metrics, security events, service topology). Agentic Loop: A multi-step tool-calling loop (up to 6 iterations) where Gemini formulates queries, we execute them against MCP, feed results back, and let the model refine its diagnosis until it produces a final RCA JSON. Resilience: Exponential backoff retry logic for Gemini API 429 rate limits, multi-model fallback chain (primary → fallback models), and a complete mock forensic simulation engine that generates realistic investigation data when APIs are unavailable — ensuring the demo always works. Frontend: A real-time Server-Sent Events (SSE) streaming architecture pushes investigation progress to a sleek dark-mode dashboard built with Tailwind CSS, Inter (UI) and JetBrains Mono (terminal) fonts, featuring a live agent console, glass-panel RCA report card, severity badges, and a remediation approval panel. Stack: Node.js + Express, @google/generative-ai, @modelcontextprotocol/sdk, SSE streaming, vanilla JS frontend.
Challenges we ran into
Gemini API rate limiting (429 quota exhaustion): During development and testing, we hit aggressive rate limits on the Gemini API. We had to implement exponential backoff with jitter, parse retry-after headers, and build a multi-model fallback chain to ensure investigations never silently fail. Getting Gemini to reliably call tools and produce structured JSON: The model would sometimes wrap its JSON output in markdown fences, add conversational filler, or skip tool calls entirely. We solved this with strict system instructions, JSON fence stripping, regex-based JSON extraction fallback, and a safety loop cap. MCP SDK integration complexity: The Model Context Protocol SDK is relatively new, and setting up SSE transport with custom Bearer token authentication, mapping MCP tool schemas to Gemini's function declaration format, and handling the async tool-call loop required significant experimentation. Ensuring demo reliability: Live APIs can fail during a hackathon demo. We built a comprehensive simulation mode with context-aware mock data (different responses for auth attacks, payment timeouts, OOM crashes) so the full investigation flow works even without external dependencies.
Accomplishments that we're proud of
Built a fully autonomous multi-step agentic investigation loop — Gemini doesn't just answer questions, it actively formulates hypotheses, runs queries, reads results, and refines its diagnosis across up to 6 chained tool calls. Achieved real-time transparency via SSE streaming — every thought, query, and tool result is visible to the human operator as it happens, making the AI's reasoning process auditable and trustworthy. Implemented production-grade resilience — exponential backoff, model fallback chains, mock simulation engine, and graceful degradation ensure the system never fails silently. Created a beautiful, operationally useful UI that mirrors what a real SRE would see: a live terminal, structured RCA reports with severity badges, and one-click remediation approval. Demonstrated a real-world SRE use case with context-aware scenarios — brute-force attack detection, external gateway failure diagnosis, and container OOM crash analysis.
What we learned
AI agents need guardrails, not just capabilities. Without a safety loop cap and structured output enforcement, LLMs can loop indefinitely or produce unparseable output. Constraining the agent's output schema was critical. Resilience is a first-class feature. Building retry logic, fallback models, and simulation modes wasn't optional — it was what made the project demoable and production-viable. MCP is powerful but early. The Model Context Protocol provides a clean abstraction for AI tool-use, but the SDK ecosystem is still maturing. Mapping between MCP tool schemas and Gemini function declarations required custom glue code. Streaming UX transforms trust. Showing the agent's thought process in real time fundamentally changes how operators interact with AI — it turns a "black box" into a "collaborative investigator." Context-aware system prompts are everything. The quality of the RCA output was directly proportional to how precisely we defined the agent's operational protocol and output schema in the system instruction.
What's next for zero day forensic investigator
Real Dynatrace Grail integration — Replace simulation mode with live DQL queries against production Dynatrace environments for actual incident response. Automated remediation execution — Integrate with Kubernetes API, firewall management systems, and PagerDuty to execute fixes automatically upon approval, not just display commands. Multi-incident correlation — Detect patterns across multiple simultaneous incidents to identify systemic root causes (e.g., a single bad deployment cascading across services). Investigation history & learning — Store past RCA reports in MongoDB and use retrieval-augmented generation (RAG) to let the agent learn from previous incidents and resolve recurring issues faster. Collaborative multi-agent architecture — Add specialized sub-agents (security analyst, performance engineer, database expert) that collaborate on complex incidents requiring cross-domain expertise. Slack/Teams integration — Push real-time investigation summaries and remediation approvals to messaging platforms where SRE teams already work.


Log in or sign up for Devpost to join the conversation.