-
-

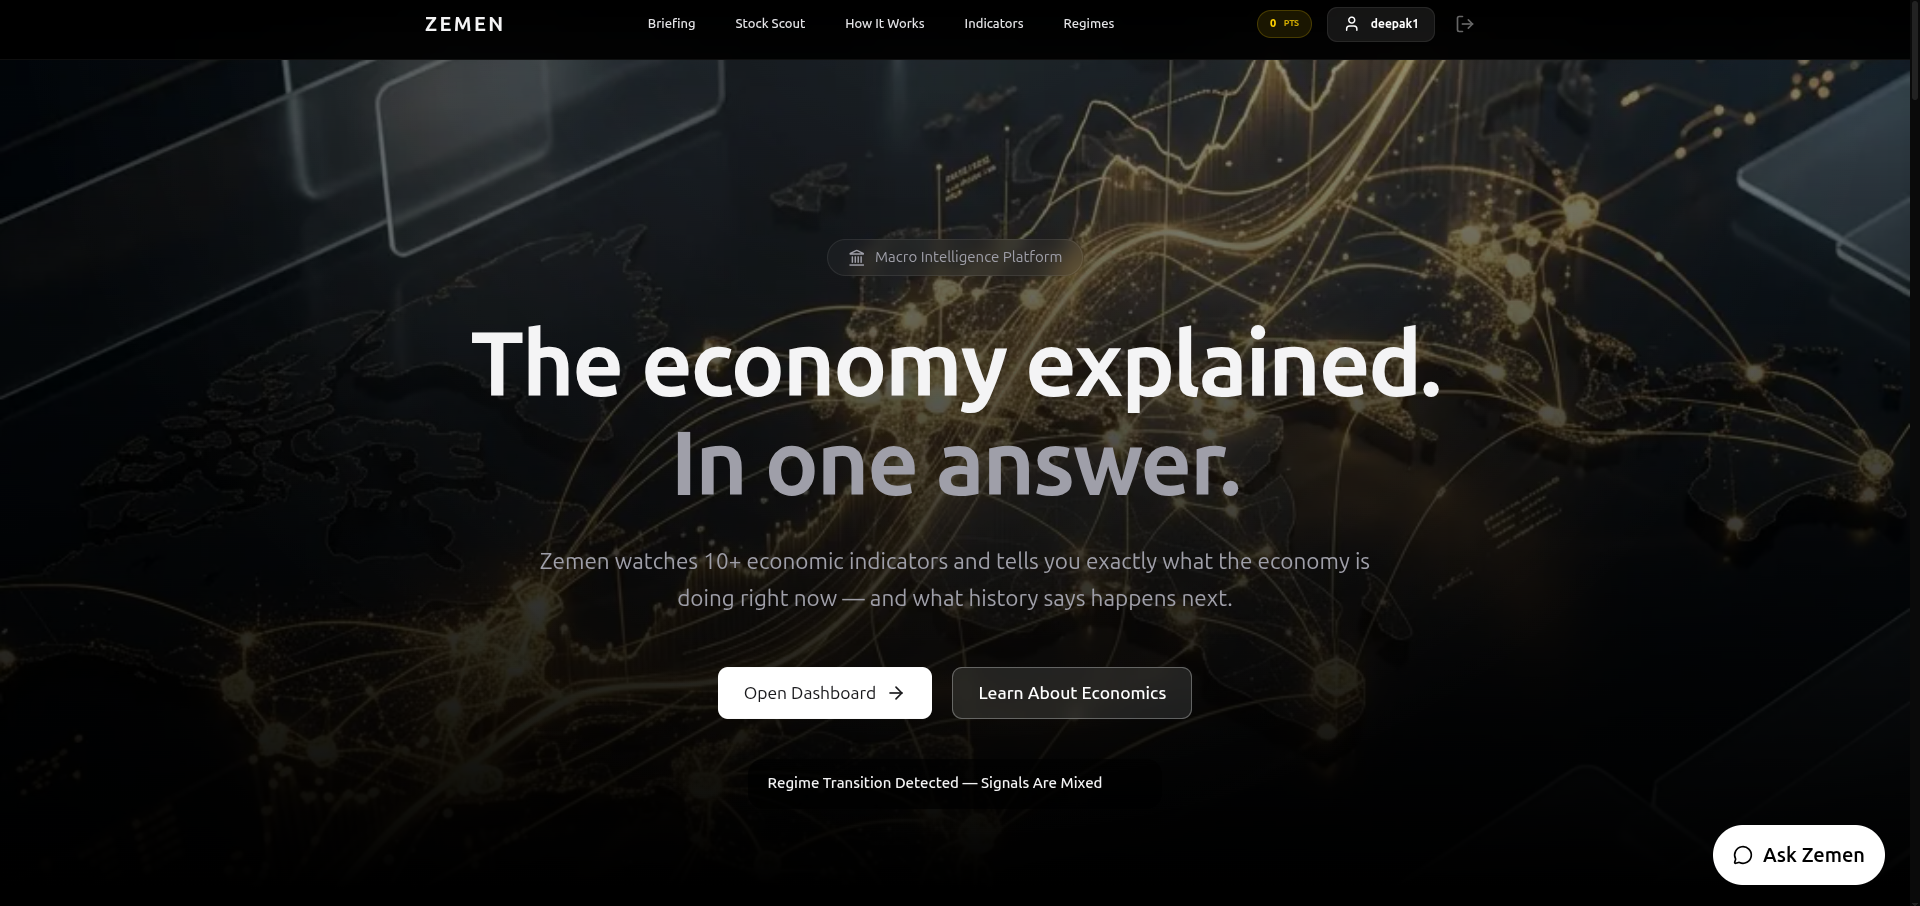
zemen - a regime detector landing page
-
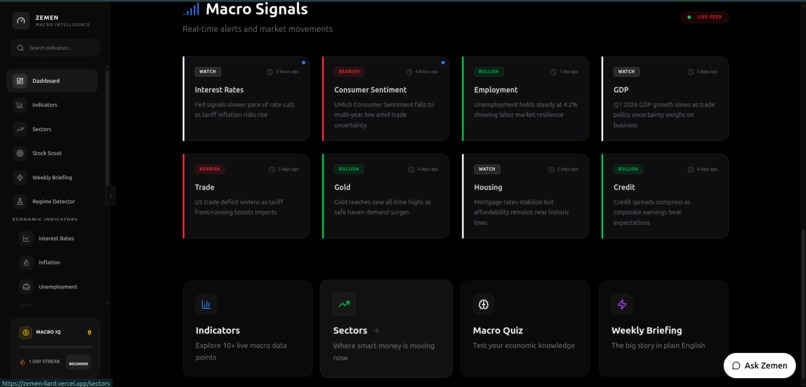
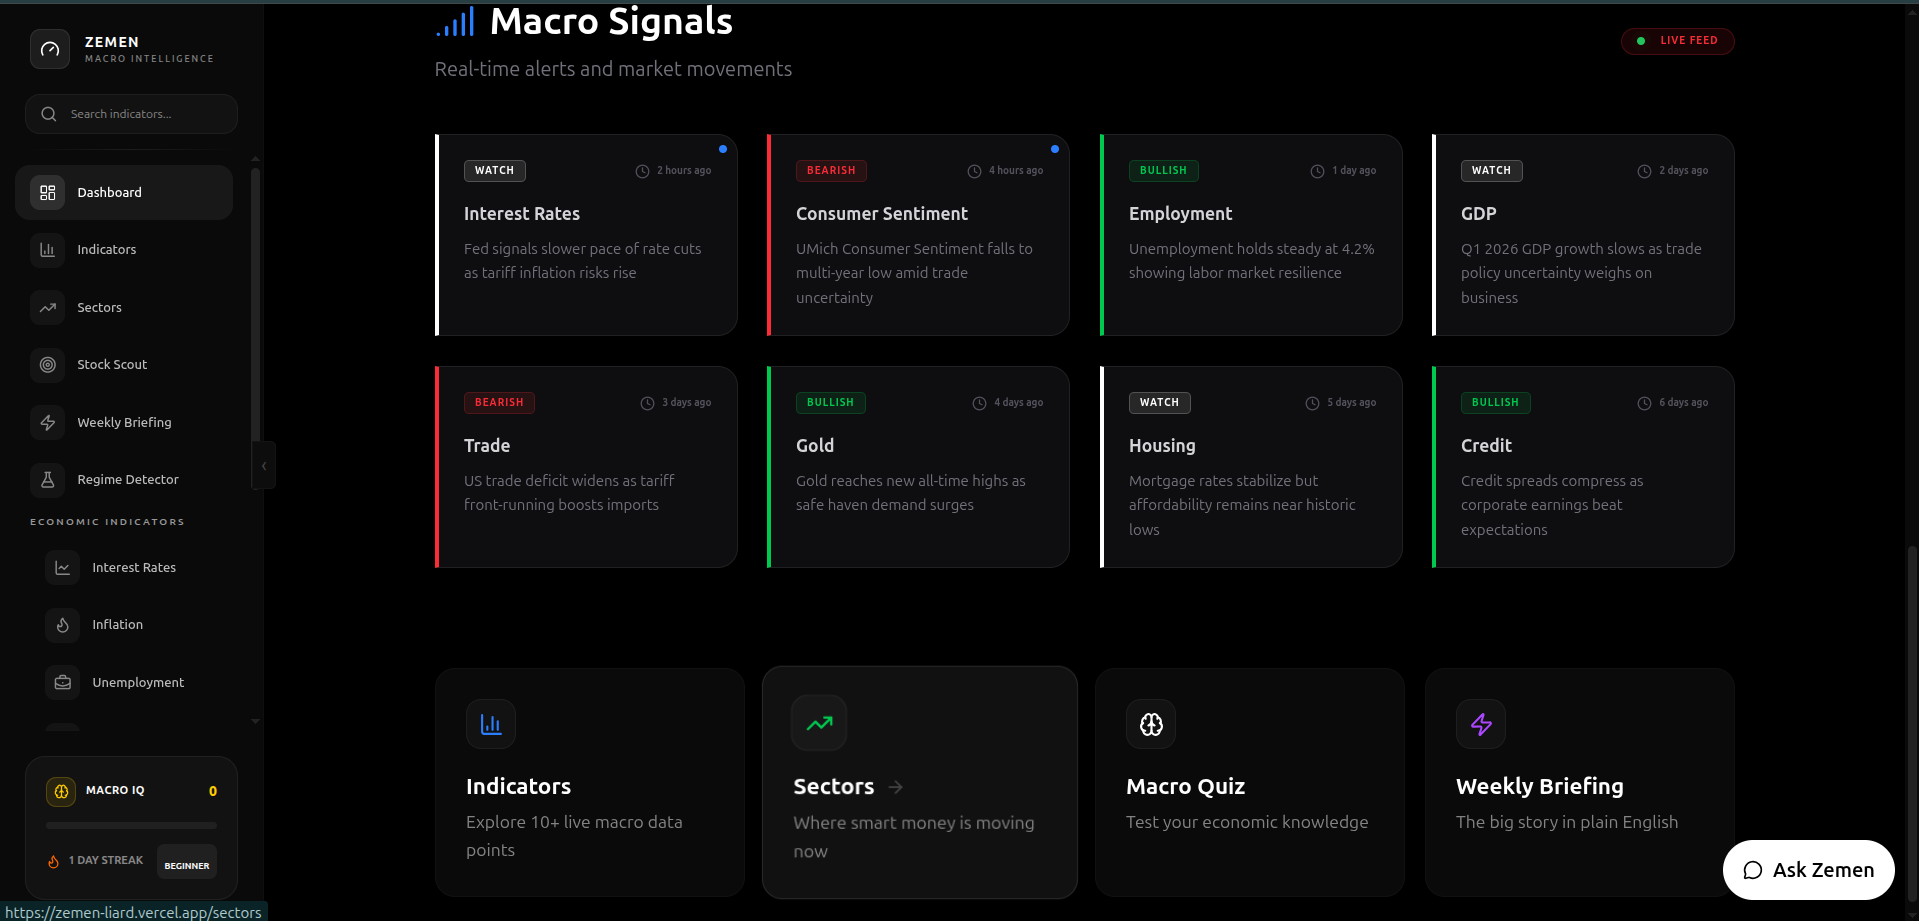
dashboard - macro signals
-
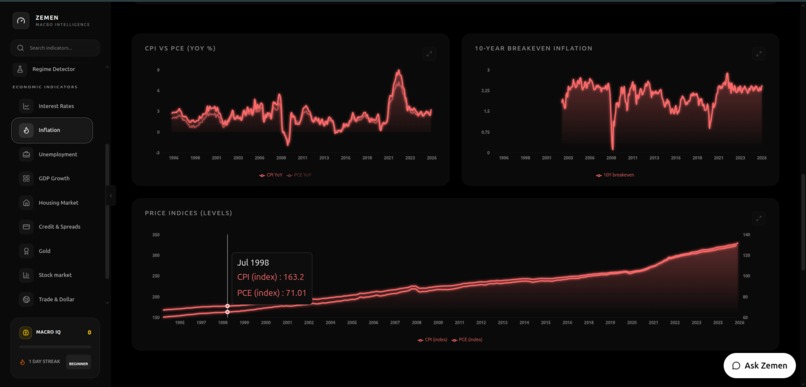
dashboard - sector and intelligence panel
-

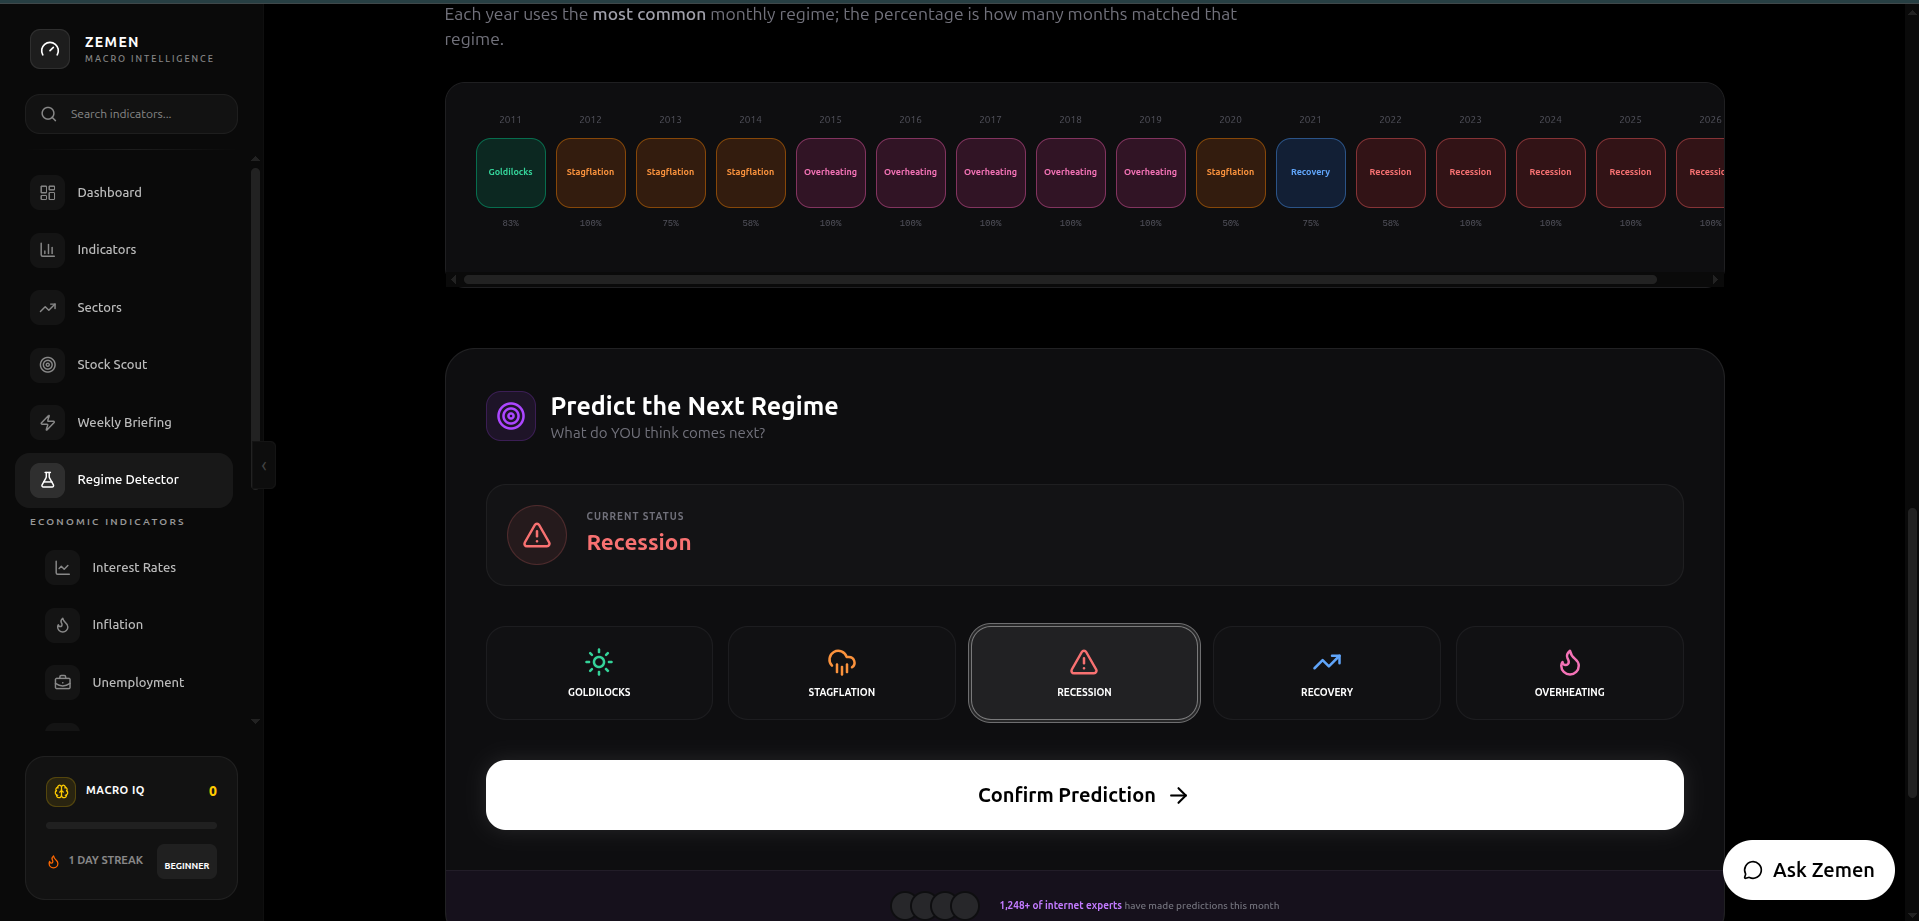
regime detector - submit your prediction page
-

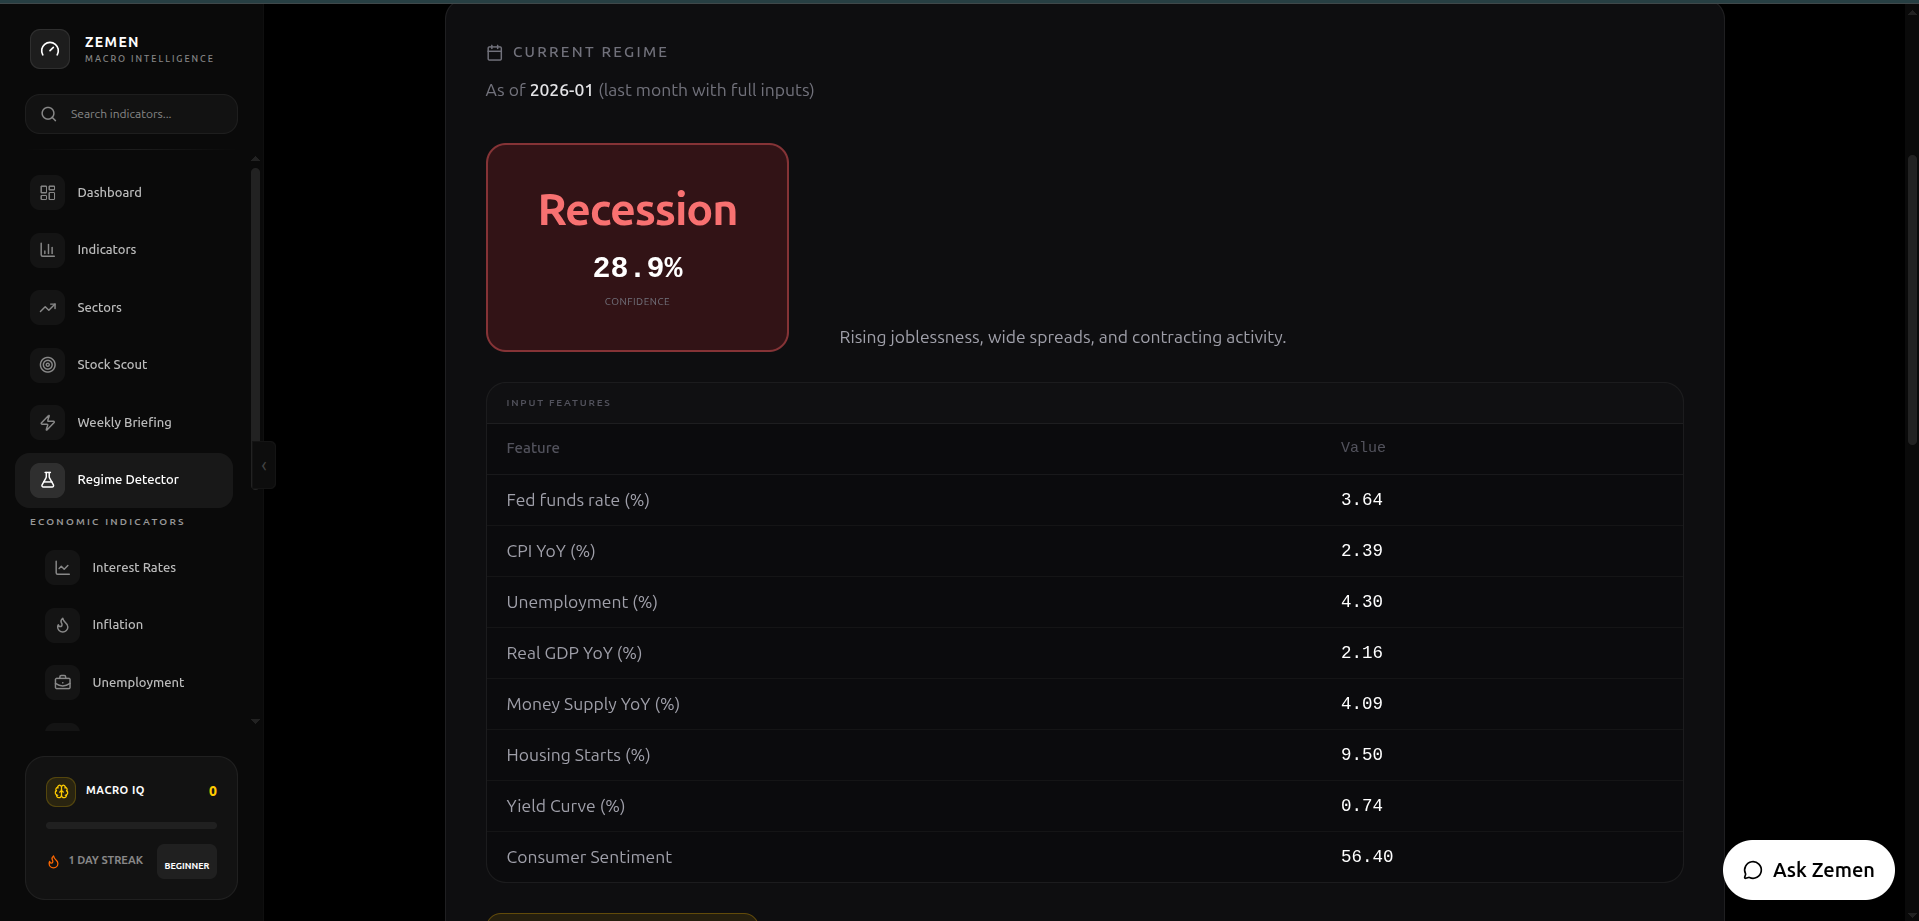
regime detector
-
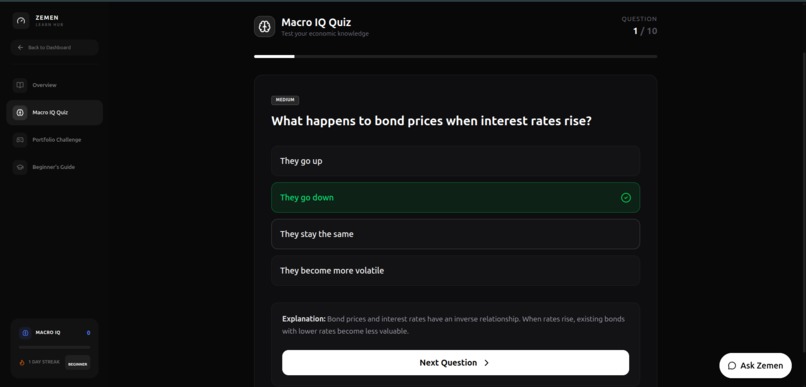
learn hub - quiz
-

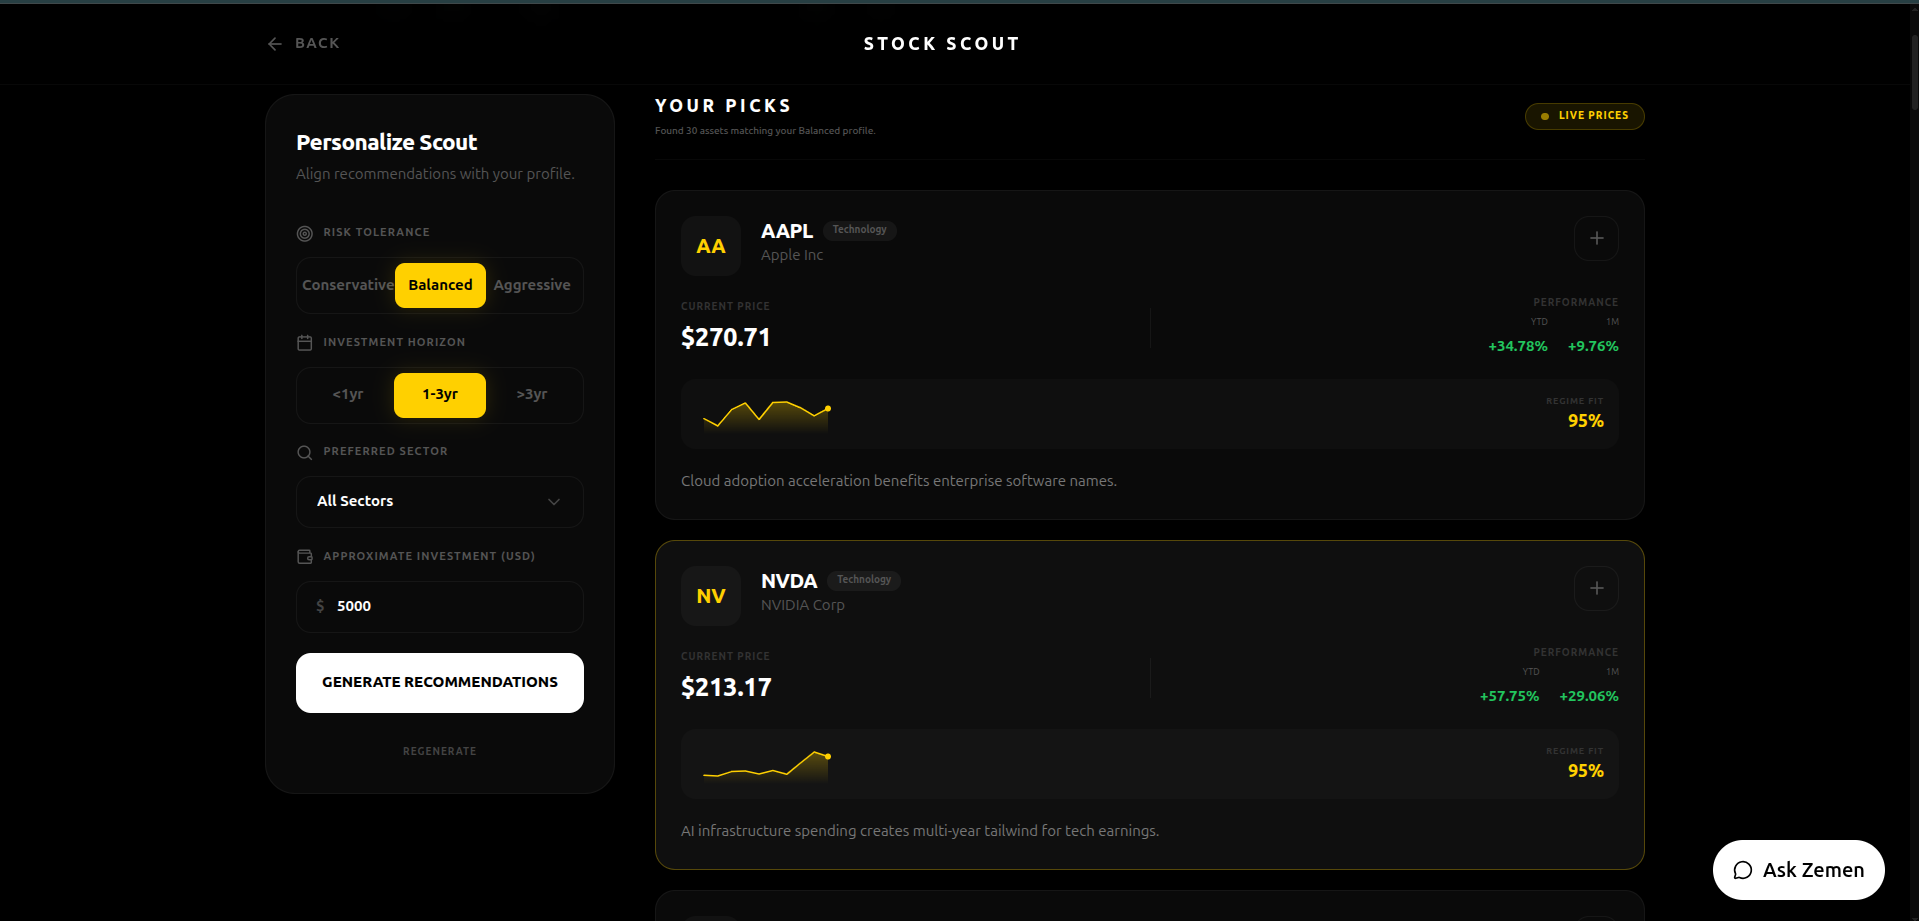
stock scout


🌍 The Problem Nobody Talks About
Every day, millions of people make financial decisions — whether to invest, borrow, hire, save, or spend — without understanding the economic environment they are operating in.
The data exists. The Federal Reserve publishes 800,000+ economic time series. But it is scattered across dozens of government websites, written in technical language, and completely disconnected from any actionable guidance.
The result? Most people are flying blind.
- A business owner takes out a loan right before rates spike
- A retail investor buys growth stocks right as stagflation begins
- A student learns macroeconomics from a textbook with no connection to the real world
We built Zemen to fix this.
💡 What is Zemen?
Zemen is a macro intelligence platform that transforms raw economic data into one clear answer: what is the economy doing right now, and what does history say happens next?
Think of it like a weather app — but for the economy. A weather app does not show you raw pressure readings and leave you guessing. It says: rainy tomorrow, bring an umbrella.
Zemen does the same for the economy. It looks at 10+ live economic indicators and tells you: we are in Stagflation — here is what that means for your money, your business, and your decisions.
⚡ Core Features
🧠 Regime Detector — The Heart of Zemen
Our ML-powered regime detector is the feature that makes everything else possible.
Using unsupervised clustering (KMeans + Gaussian Mixture Models) on live FRED data, Zemen classifies the current economy into one of 5 regimes every day:
- 🟢 Goldilocks — Everything is just right
- 🔵 Recovery — Coming out of a downturn
- 🟠 Overheating — Growth too fast, inflation rising
- 🔴 Stagflation — The worst combo
- ⚫ Recession — Economy contracting
The detector shows a confidence percentage, a plain English explanation, and most importantly — what happened to stocks, gold, and bonds in the 90 and 180 days after every similar period in history since 1970.
This is not a prediction. It is a historical playbook built from 50+ years of data.
🤖 Ask Zemen — AI-Powered Economic Assistant
Zemen has a built-in AI assistant powered by the Google Gemini API that understands the current economic context.
What makes it different from a generic chatbot:
- It has live economic data injected into every conversation — current CPI, Fed rate, GDP, unemployment, regime, and confidence
- It has 3 response modes: Simple (plain English), Detailed (with charts and tables), and Analyst (full data breakdown)
- It renders charts and tables inside the chat — not just text
- It answers questions like: "Is now a good time to start a business?" with actual data
No other economic dashboard has a chatbot that knows what the economy is doing today and can explain it at any level of sophistication.
📈 Stock Scout — Regime-Aware Stock Finder
Stock Scout solves a problem that every retail investor faces: which stocks actually fit the current economic environment?
Users enter their budget, risk tolerance (Conservative / Balanced / Aggressive), and investment horizon — and Stock Scout fetches real live prices from Yahoo Finance and returns stocks that:
- Are priced within their budget
- Fit the current macro regime
- Are ranked by regime fit score, momentum, and risk profile
Every result shows a live sparkline chart, YTD return, 1-month return, sector, industry, and a plain English reason why this stock fits right now.
Filters include sector, market cap, price range, and positive-only toggle. Results are displayed in a responsive grid with sort options.
Users can save stocks to their personal watchlist which is stored in the database and synced across sessions.
🗺️ Sectors & Opportunities — Where Is
Smart Money Moving?
The Sectors page shows all 11 major market sectors ranked by their fit with the current economic regime.
Each sector card shows:
- Live YTD and 1-year return from real ETF data
- HOT / NEUTRAL / COLD regime fit badge
- A sparkline of the last 12 months
- One sentence on the current opportunity
Clicking into any sector reveals:
- Full performance dashboard vs S&P 500
- What factors drive this sector up or down
- Top 8-10 companies with real logos, analyst ratings, PE ratios, revenue growth
- 3 emerging trends with the companies best positioned to benefit
- A portfolio simulator showing how different sector combinations would have performed historically
📚 Learner's Guide — Economics For Everyone
Most people never learned economics. Zemen's Learn Hub fixes that with a structured educational system built directly into the platform.
Theory modules cover all 10 economic indicators — Interest Rates, Inflation, Unemployment, GDP, Housing, Credit Spreads, Gold, Money Supply, Trade, and Consumer Sentiment — each explained with:
- Plain English "what is this?" explanations
- What the unit means
- When it goes high vs low
- Who controls it and how
- Real historical events on a timeline
- Current 2025-2026 context
Every topic the user reads is marked as complete in the database and earns XP toward their Macro IQ level.
5 levels: Beginner → Student → Analyst → Expert → Master
🎯 Macro IQ Quiz — Test Your Knowledge
The quiz system makes learning economics genuinely fun.
10 questions per session, mixing:
- Static knowledge questions about fundamentals
- Dynamic questions using live data (e.g. "What is the current unemployment rate?")
Questions have 4 options, show animated correct/wrong feedback, and reveal a plain English explanation after each answer.
Results are saved to the database. The user's Macro IQ score is a rolling average of their last 5 quiz scores — so it reflects real improvement over time.
Streak system tracks daily visits and rewards consistent learners with milestone badges.
📊 Weekly Macro Briefing — Your Economic
Newspaper
Every week, the briefing page generates a clean summary of:
- This week in numbers — all 10 indicators with current value, change from last update, and direction for the economy
- The big story — what major macro theme is dominating right now (tariffs, Fed policy, inflation trajectory)
- What Zemen is watching — 3 specific signals to monitor in the coming weeks
- Regime status — is the current regime stable, strengthening, or showing transition signals?
The briefing is designed to be readable in under 2 minutes and replace the need to visit 10 different government websites.
🔍 Intelligence Panels — Every Graph
Explained
One of the most unique features of Zemen is that no graph is left unexplained.
Below every single chart across every indicator page, Zemen shows an Intelligence Panel with:
- What this graph is showing (plain English)
- What the unit means
- A color-coded health range bar showing where the current reading sits
- What it means when it goes HIGH vs LOW
- The key factors that move this number
- Who controls it (Fed, Treasury, etc.) with real historical examples
- A timeline of the 5-6 most important events that caused major spikes or crashes
Any chart can also be expanded into a full-screen modal with a split layout — chart on the left, all intelligence data on the right — for deep focused analysis.
🎮 Portfolio Challenge — Learn By Doing
The Portfolio Challenge is a gamified simulation tool where users:
- Pick a historical economic crisis or boom (2008, 2020 COVID, 2021 Recovery, 2022 Stagflation, 2024 Goldilocks)
- Allocate a virtual ₹10,00,000 across stocks, gold, bonds, and cash using sliders
- Run the simulation to see how their strategy would have performed
Results show their return vs the best possible strategy for that regime — teaching the direct connection between macro awareness and investment outcomes.
💼 Take Action — From Data to Decision
Every indicator page has an Action Panel that bridges the gap between understanding and doing.
- Stock section — direct links to Zerodha, Groww, Upstox, Robinhood with context on which platform suits which type of investor
- Gold section — 4 ways to buy gold (Digital Gold, ETFs, Sovereign Gold Bonds, Physical) with direct links and a gold allocation calculator
- Jobs section — links to LinkedIn, Naukri, Indeed, Internshala, Upwork with skill-building resources for recession-proof careers
- Inflation section — FD rate comparison, inflation-resistant assets, cashback platforms
- Housing section — property portals, EMI calculator, regime-based buying guidance
Zemen does not just show you what is happening. It tells you what you can do about it.
🔐 User Accounts — Persistent Progress
Zemen has a full authentication system so every user's progress is saved:
- Registration requires a unique username, password (bcrypt hashed), and profession
- JWT tokens are issued on login and stored as httpOnly cookies
- Quiz scores accumulate into a Macro IQ level that improves with consistent learning
- Watchlist syncs across devices — stocks added on mobile appear on desktop
- Learning progress tracks which topics have been read and how much XP has been earned
- Streak counter tracks daily visits and rewards consistency
🏗️ How We Built It
Platform: Zerve AI — the entire data science pipeline, ML clustering, and Python backend was built using Zerve's agentic canvas
Data: FRED API (Federal Reserve Economic Data) — 10+ live macroeconomic series updated daily, with yfinance providing real-time stock and ETF prices
ML: Scikit-learn KMeans and Gaussian Mixture Models for regime classification, trained on 30+ years of monthly economic data
Frontend: Next.js 14, TypeScript, Tailwind CSS, Framer Motion for animations
Database: PostgreSQL + Prisma ORM for user accounts, watchlists, quiz results, and learning progress
AI: Google Gemini API for the Ask Zemen chatbot with live economic data injection
Auth: JWT + bcrypt for secure authentication
Charts: Plotly.js for all data visualisations with custom dark theme styling
📐 Architecture
flowchart TD
    A[FRED API] --> B[Zerve Data Pipeline]
    B --> C[ML Regime Classifier]
    C --> D[Regime Label + Confidence Score]

    E[Yahoo Finance] --> F[Stock Universe]
    F --> G[Regime Fit Scoring]
    G --> H[Ranked Stock Recommendations]

    I[User Query] --> J[Gemini API + Live Context]
    J --> K[Rich Response\n(Text + Charts + Tables)]

    L[User Actions] --> M[Next.js API Routes]
    M --> N[PostgreSQL via Prisma]
    N --> O[Persistent Progress + Watchlist]

---

## 🧗 Challenges We Faced

**Data Availability:** FRED does not provide
gold or equity prices. We solved this with a
three-layer fallback system — yahoo-finance2
(server-side) → Alpha Vantage → hardcoded
approximate data — so the app never shows
empty screens.

**Making Economics Accessible:** Every feature
went through a test: *can a curious 14-year-old
understand this without googling anything?*
This forced us to rewrite explanations multiple
times until they were genuinely simple without
being inaccurate.

**Regime Classification with Limited Data:**
Monthly economic data is sparse. We engineered
lag features, rolling volatility, and YoY
change features to give the model enough signal
to produce stable, meaningful clusters.

**Real-Time Feel with Delayed Data:** Economic
data is released monthly, quarterly, and
annually — never truly real-time. We solved
this with freshness indicators showing exactly
when each series was last updated, so users
always know the recency of what they are seeing.

---

## 📖 What We Learned

Building Zemen taught us that the gap between
*data existing* and *data being useful* is
enormous — and almost entirely a design and
communication problem, not a technical one.

The Federal Reserve has published incredible
data for decades. The challenge was never
finding it. The challenge was making it speak
to someone who is not an economist.

Every feature in Zemen is an answer to the
question: *what would this data look like if
it genuinely respected the user's time and
intelligence?*

---

## 🚀 What's Next for Zemen

- **Real-time alerts** — notify users when
  a regime change is detected
- **India-specific indicators** — RBI rate
  decisions, Nifty 50 regime analysis,
  rupee strength
- **Portfolio integration** — connect a real
  brokerage account and see your holdings
  scored against the current regime
- **Community predictions** — see how Zemen
  users are collectively predicting the next
  regime transition
- **Mobile app** — native iOS and Android
  with push notifications for weekly briefings

---

*Zemen means "time" in Amharic — because
understanding the economic moment you are in
is the most valuable thing you can do with
your time.*
Built With
- ai
- framer-motion
- lucide-react
- next.js
- prisma
- tailwindcss
- typescript


Log in or sign up for Devpost to join the conversation.