-
-

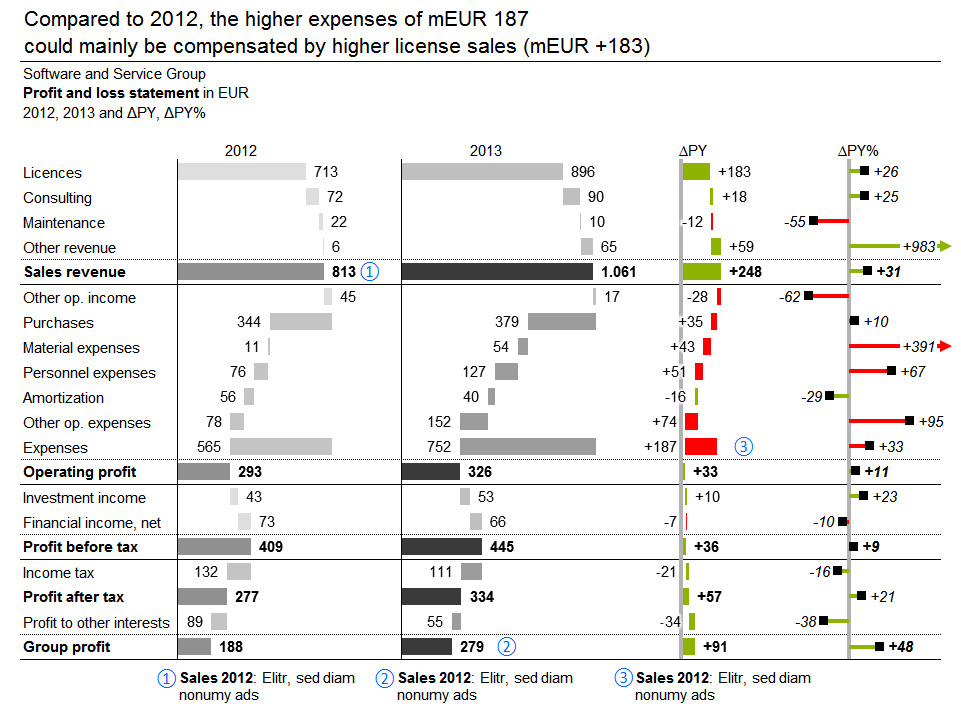
Profit and loss statement
-

Market size analysis
-

Population distribution
-

Zebra BI Ribbon


Inspiration & What it does
Our specialty is combining our knowledge about data visualization with the requirements and demands of management, FP&A and financial professionals. That's why we developed Zebra BI, an Excel add-in that offers a lot of functionalities that are missing from Excel: variance charts, advanced waterfall charts, difference highlights, scaling of multiple charts, small multiples, financial report templates, IBCS-certified charts...
How we built it
Since most of our users are using a desktop version of Excel we decided that an add-in for it would best serve their needs. A combination of a COM and XLL add-in offered just what we needed.
Challenges we ran into
Our biggest challenges were:
- building the add-in that supports many different Excel versions,
- trying to get around the limitations of Excel's chart component so that we could add new types of charts,
- supporting the different deployment scenarios.
Accomplishments that we're proud of
Zebra BI is available in many different languages, supports all regional settings and formats, and is used all over the world. Companies like Coca-Cola bottles, Bayer, Roche, SFGOV,... trust Zebra BI with producing their financial reports. We were also named one the most promising data visualization solution providers of 2016 by CIOReview.
What's next for Zebra BI
Version 2.0 with some major new features!

Log in or sign up for Devpost to join the conversation.