-
-
Zap Dashboard
-
Zap Leaderboard
-
Zap Global Impact
⚡ Zap your utility usage! ⚡
⚡ Zap greenhouse gas emissions! ⚡
Inspiration
Our idea is to incentivize people to reduce their carbon footprint by tracking monthly usage of electricity, water, and gas and comparing personal usage statistics against local and global trends. We encourage competition and collaboration around improving household resource efficiency and provide educational information about residential greenhouse gas emissions. We chose electricity, water, and gas because they are easy to track, commonly billed utilities, and individuals have control over their personal usage.
Our platform will effectively motivate people to reduce their utility usage through three means:
- Save money
- Compete alongside your friends and other people
- Save the planet
Conservative usage of electricity, gas, and water saves money for users. The tracking component compels people to be conscious of their consumption and spending trends. 5-10% of total annual income is spent on utilities, and utility spending can be reduced up to 10% through small conscientious efforts.
Secondly, social competition and status are known drives for human behavior. Our site contains two elements introducing social influence. The first is a local leaderboard showing top savers in electricity, gas, and water in the neighborhood and among friends. Secondly, we provide comparisons of personal resource usage to area-wide (neighborhood) average usage levels, which will inform people of where they stand compared to others in their area and country-wide, adjusting for household size.
Finally, the motivation to do good for the environment is intrinsically rewarding. We show the aggregate impact of users across time with the amount of electricity, water, and gas they have saved to show that individual efforts add up to create larger change and promote an every-drop-counts attitude. The residential sector accounts for 21% of energy usage in the US, and even a small reduction in energy usage across households has a significant impact on carbon emissions. Thus, users can feel good about saving money and seeing their social impact.
In addition to its potential for positive sustainable impact, our platform serves as a feasible business platform. Eventually, data collected through our platform can be compiled into a robust database about energy usage trends across US households, for which we can sell access to businesses and institutions for further study.
What it does
The platform consists of the following features:
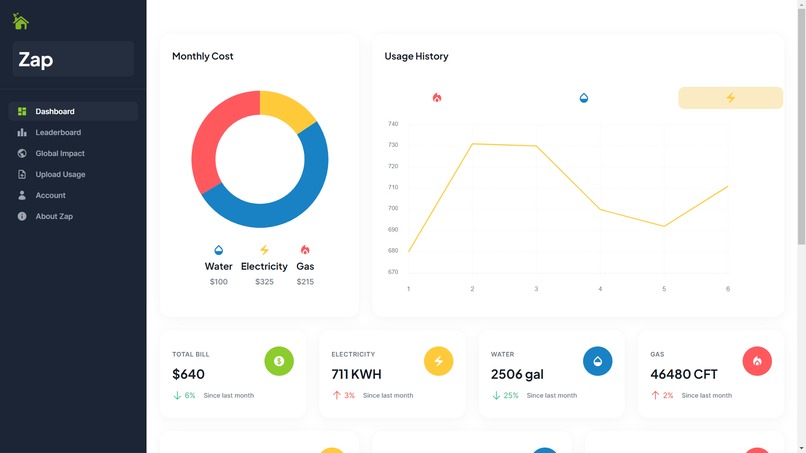
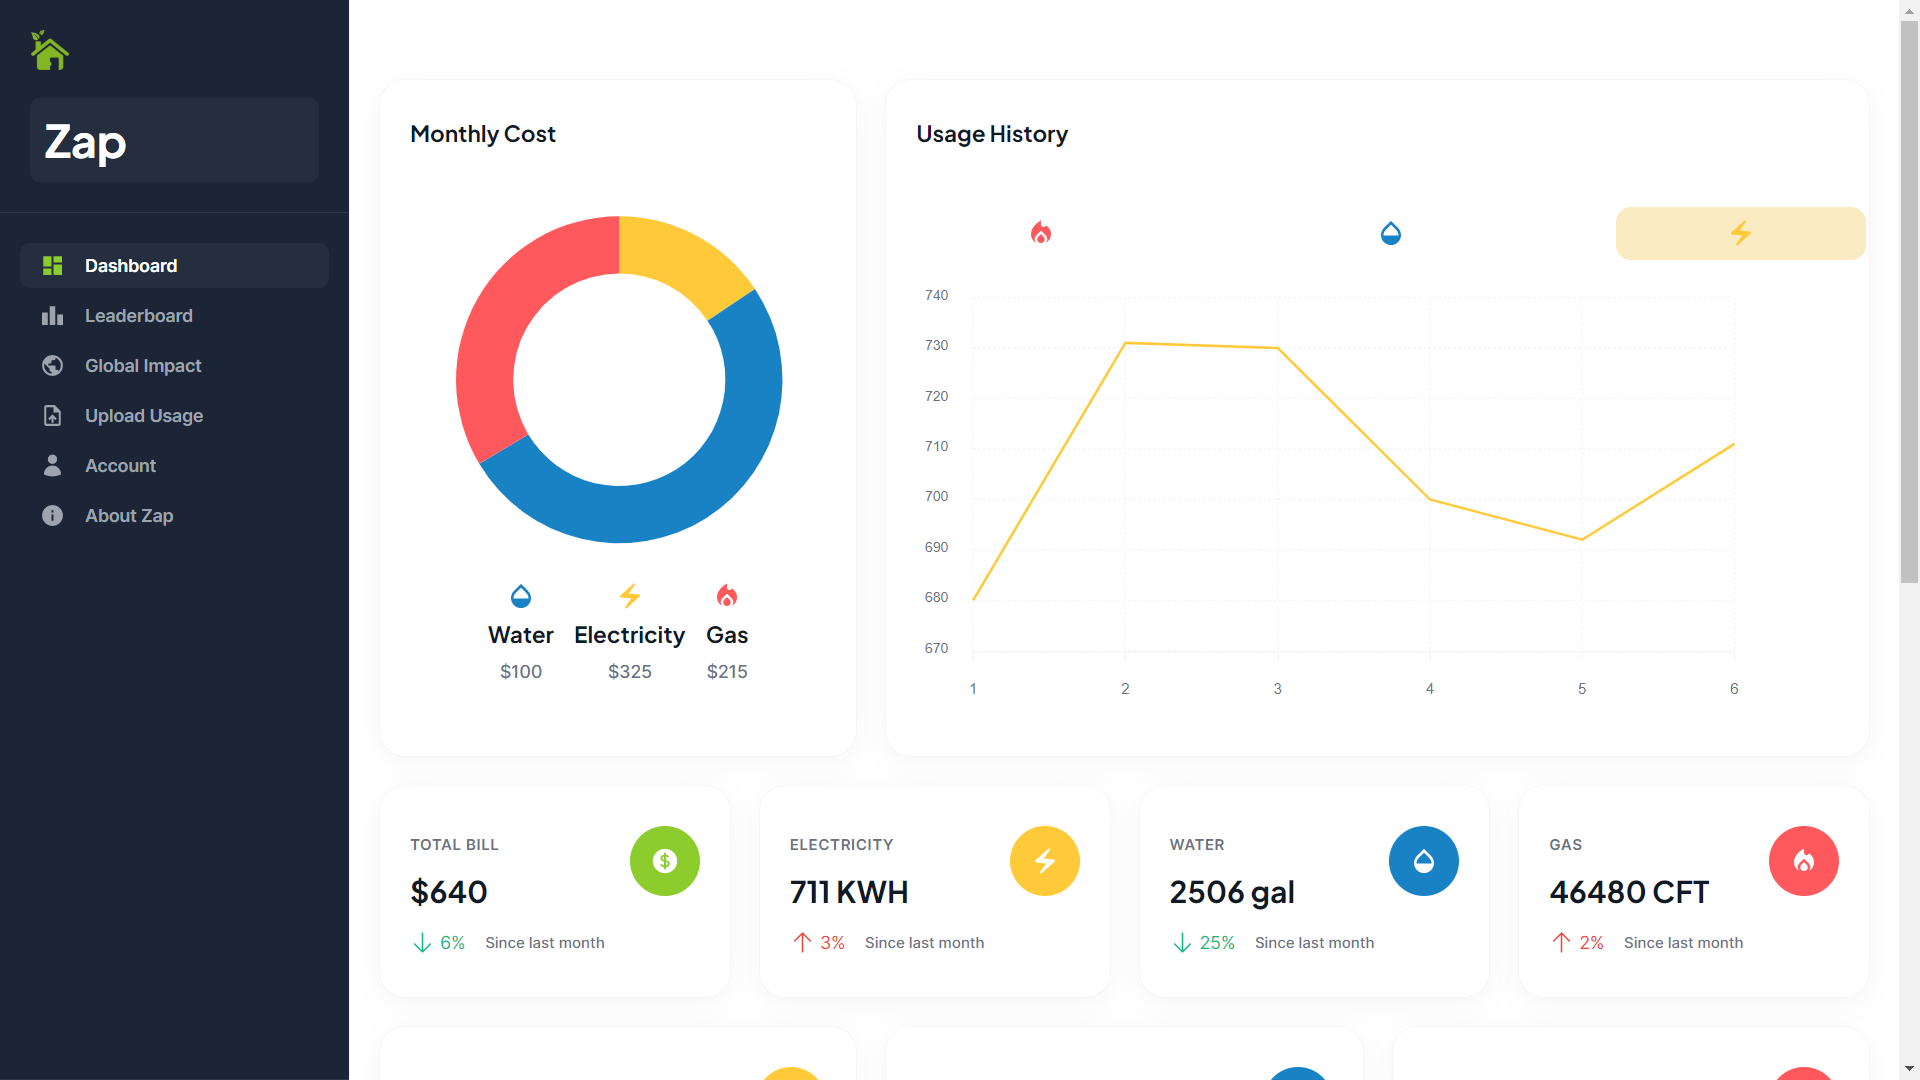
1. Home Page
Dashboard summarizing current month’s usage and cost, as well as monthly usage and cost trends based on past data entries. Also displays tips on reducing electricity, water, and gas usage and fun facts putting the quantity of saved electricity, water, and gas into perspective.
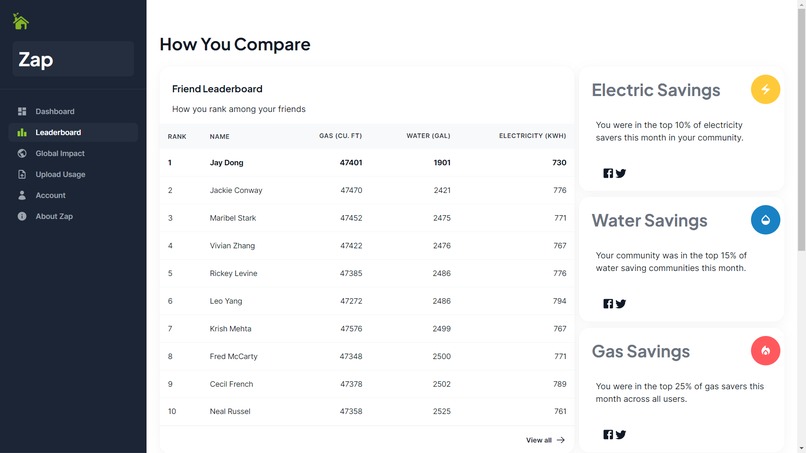
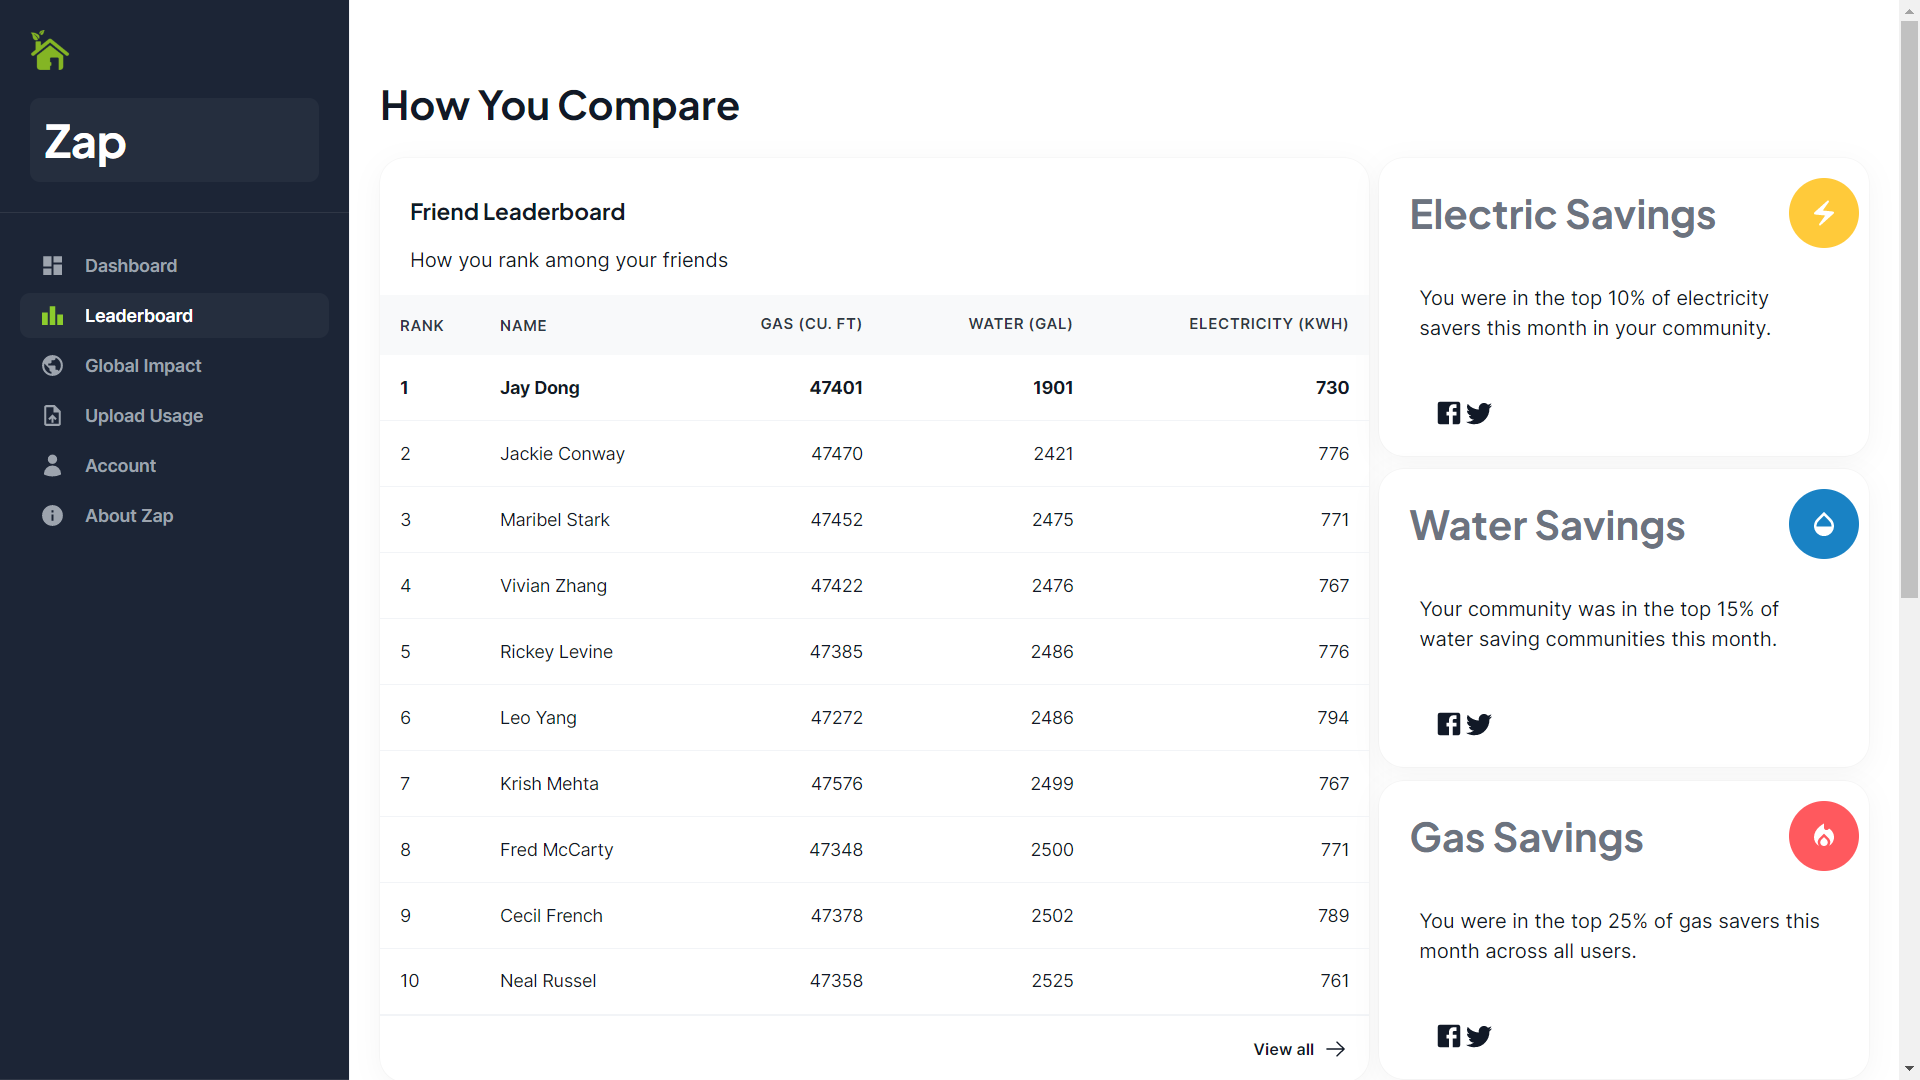
2. Leaderboard
A view summarizing where you stand vs. other users and households in your area and state. Contains a neighborhood leaderboard ranking your usage against friends or other users in your area and graphics displaying where you fall against a state-wide usage distribution
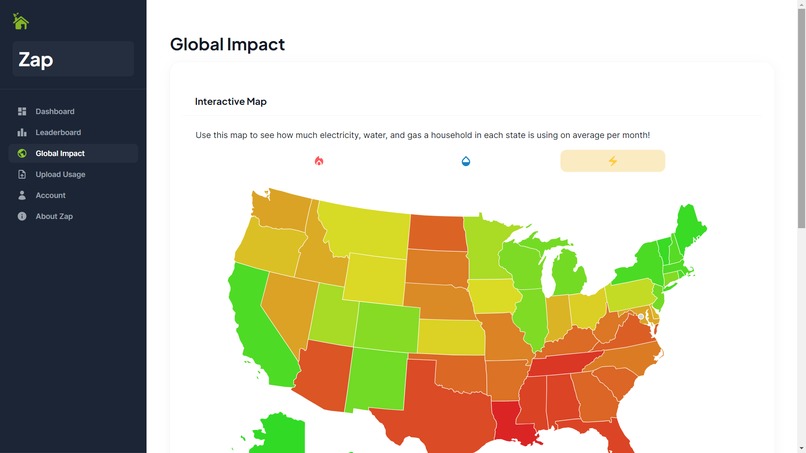
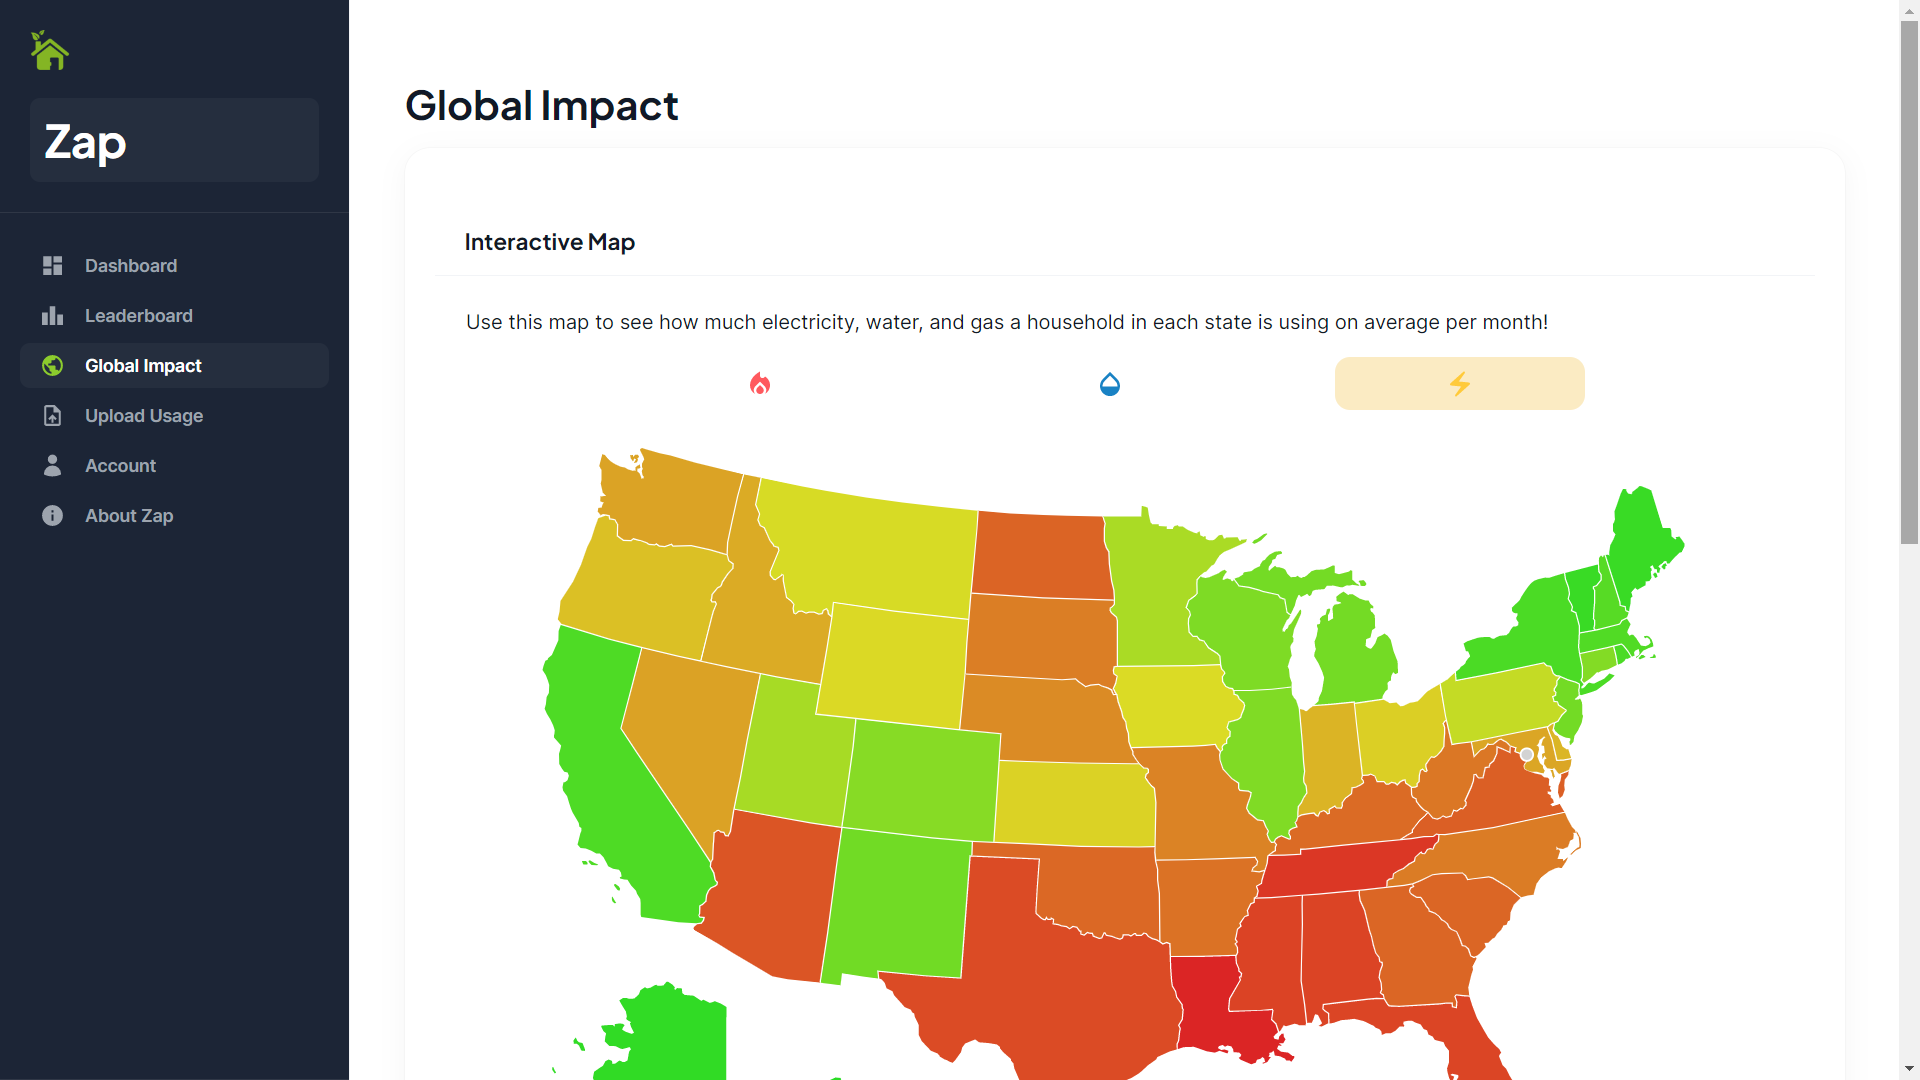
3. Global Impact
Page to show overview of usage trends by state in the US and combined impact Interactive US Map showing average electricity, water, and gas usage in each state How much electricity, water, and gas users in your state/area have saved over the last few months
4. Data Entry
Users are asked to input their monthly usage for electricity, gas, and water or to upload their monthly utility bill. User information including name, zip code, city, state, and household size are also recorded. This information is used to filter by location and household size in usage comparisons and leaderboards.
How we built it
We decided to use ReactJS as the framework for our frontend. We started with an open source JavaScript/React dashboard template from this source, which we modified to fit our needs. We used MUI elements to theme and format items on the dashboard and pages, and apex-charts as the graphing library. The interactive US Map was implemented using the react-usa-map package.
For individuals, we simulated data entries for 20 users using a normal distribution around average monthly electricity, water, and gas usage for households in Pasadena and Irvine. To implement the interactive map, we collected data for average electricity and water usage by state based on online data. We generated simulated data for gas usage using a normal distribution around the average gas usage for Pasadena.
Sources for tips and stats for simulated data:
- Energy Data Facts
- Use of energy in homes
- Tips for Managing Your Electric Usage:
- Tips for Managing Your Natural Gas Usage
- EnergySage (data about average usage and pricing in specific areas/cities)
Challenges we ran into
We prioritized modeling proof of concept over functional implementation of backend features and data collection. Our project is easily scalable and has the flexibility to incorporate and improve many features. One issue we considered is privacy. Since the platform collects personal data, we would realistically need a secure backend to store personal information, and anonymity can be maintained on the leaderboard using id numbers or screen names and exposing names only to friends.
Accomplishments that we're proud of
Coming up with and implementing a proof of concept in a limited time was a challenging and rewarding experience, and we are proud that we were able to implement many difficult features within the scope of our idea. Most of our was unfamiliar with using React, but wanted to gain experience, which is why we decided to use React. Over the hackathon, we are proud to say that we learned a lot about how to organize React elements, use features such as hooks etc and built an end to end full scale React app that we can host and publish! We also collaborated and allocated work smoothly, and even generated realistic data for our proof of concept.
What we learned
This project taught us a lot about using React and MUI, both of which we were previously inexperienced with. In the process of research, we also learned about energy and utilities usage trends across America and the impact of energy and water use. We also learned many ways that we can make small changes in our lives to improve resource efficiency and do our part in reducing carbon emissions.
What's next for Zap
We hope to continue this project by implementing and linking a backend data server and publishing our app as a beta tool for public use.
About us
We are four Caltech junior CS majors who met through the swim team. This is our first hackathon, and we really enjoyed it and hope to do more in the future!
Thanks a lot! Jay, Krish, Leo and Vivian


Log in or sign up for Devpost to join the conversation.