-
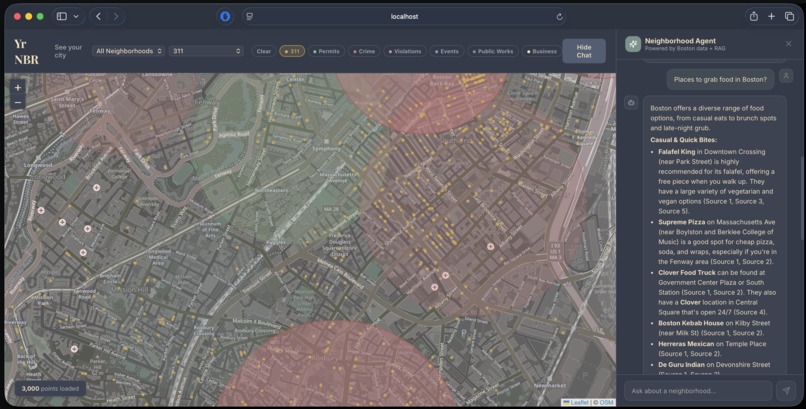
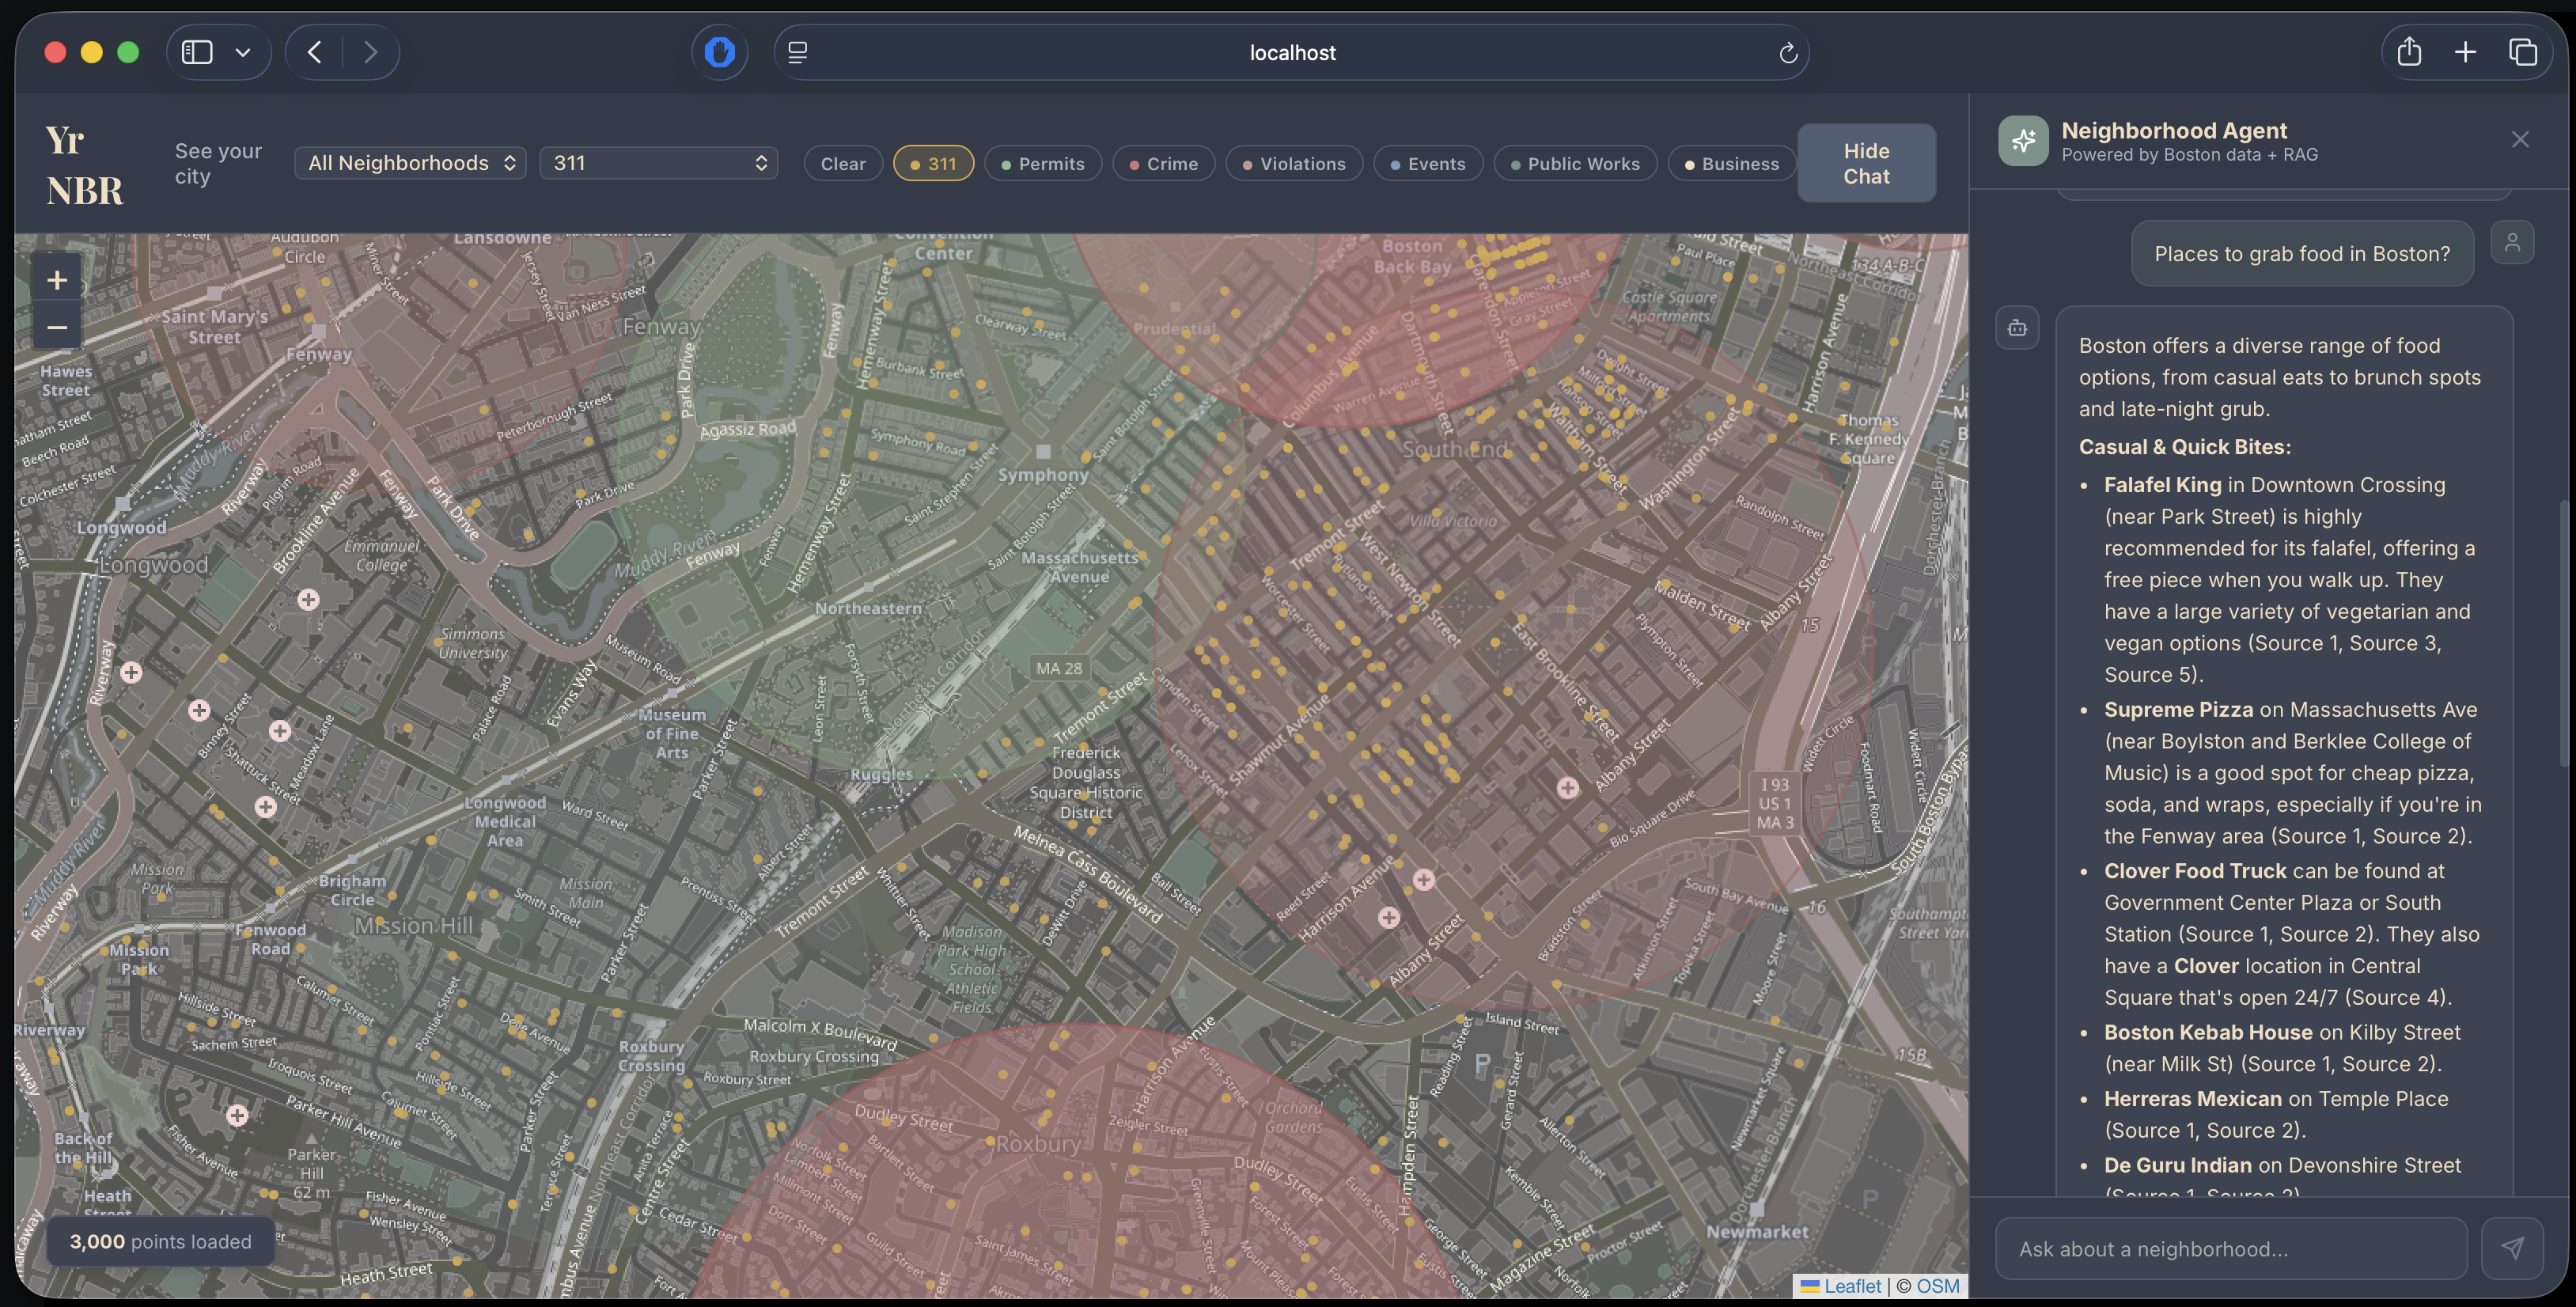
Our React frontend
-
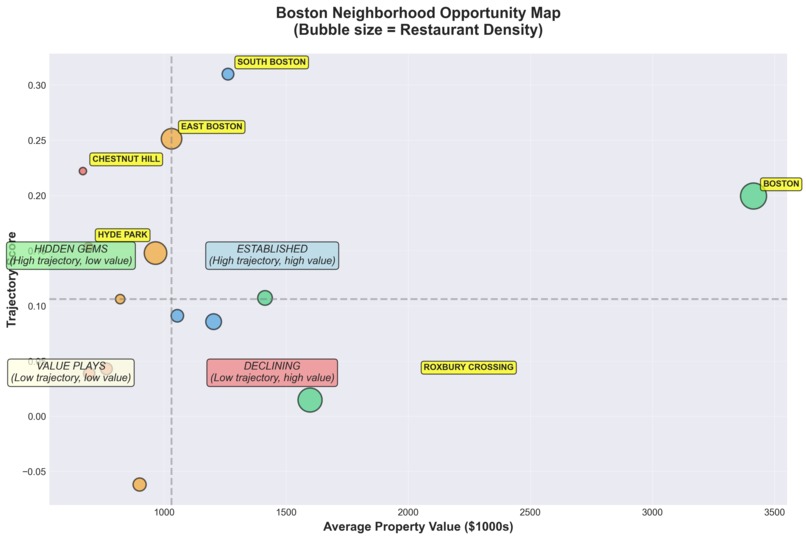
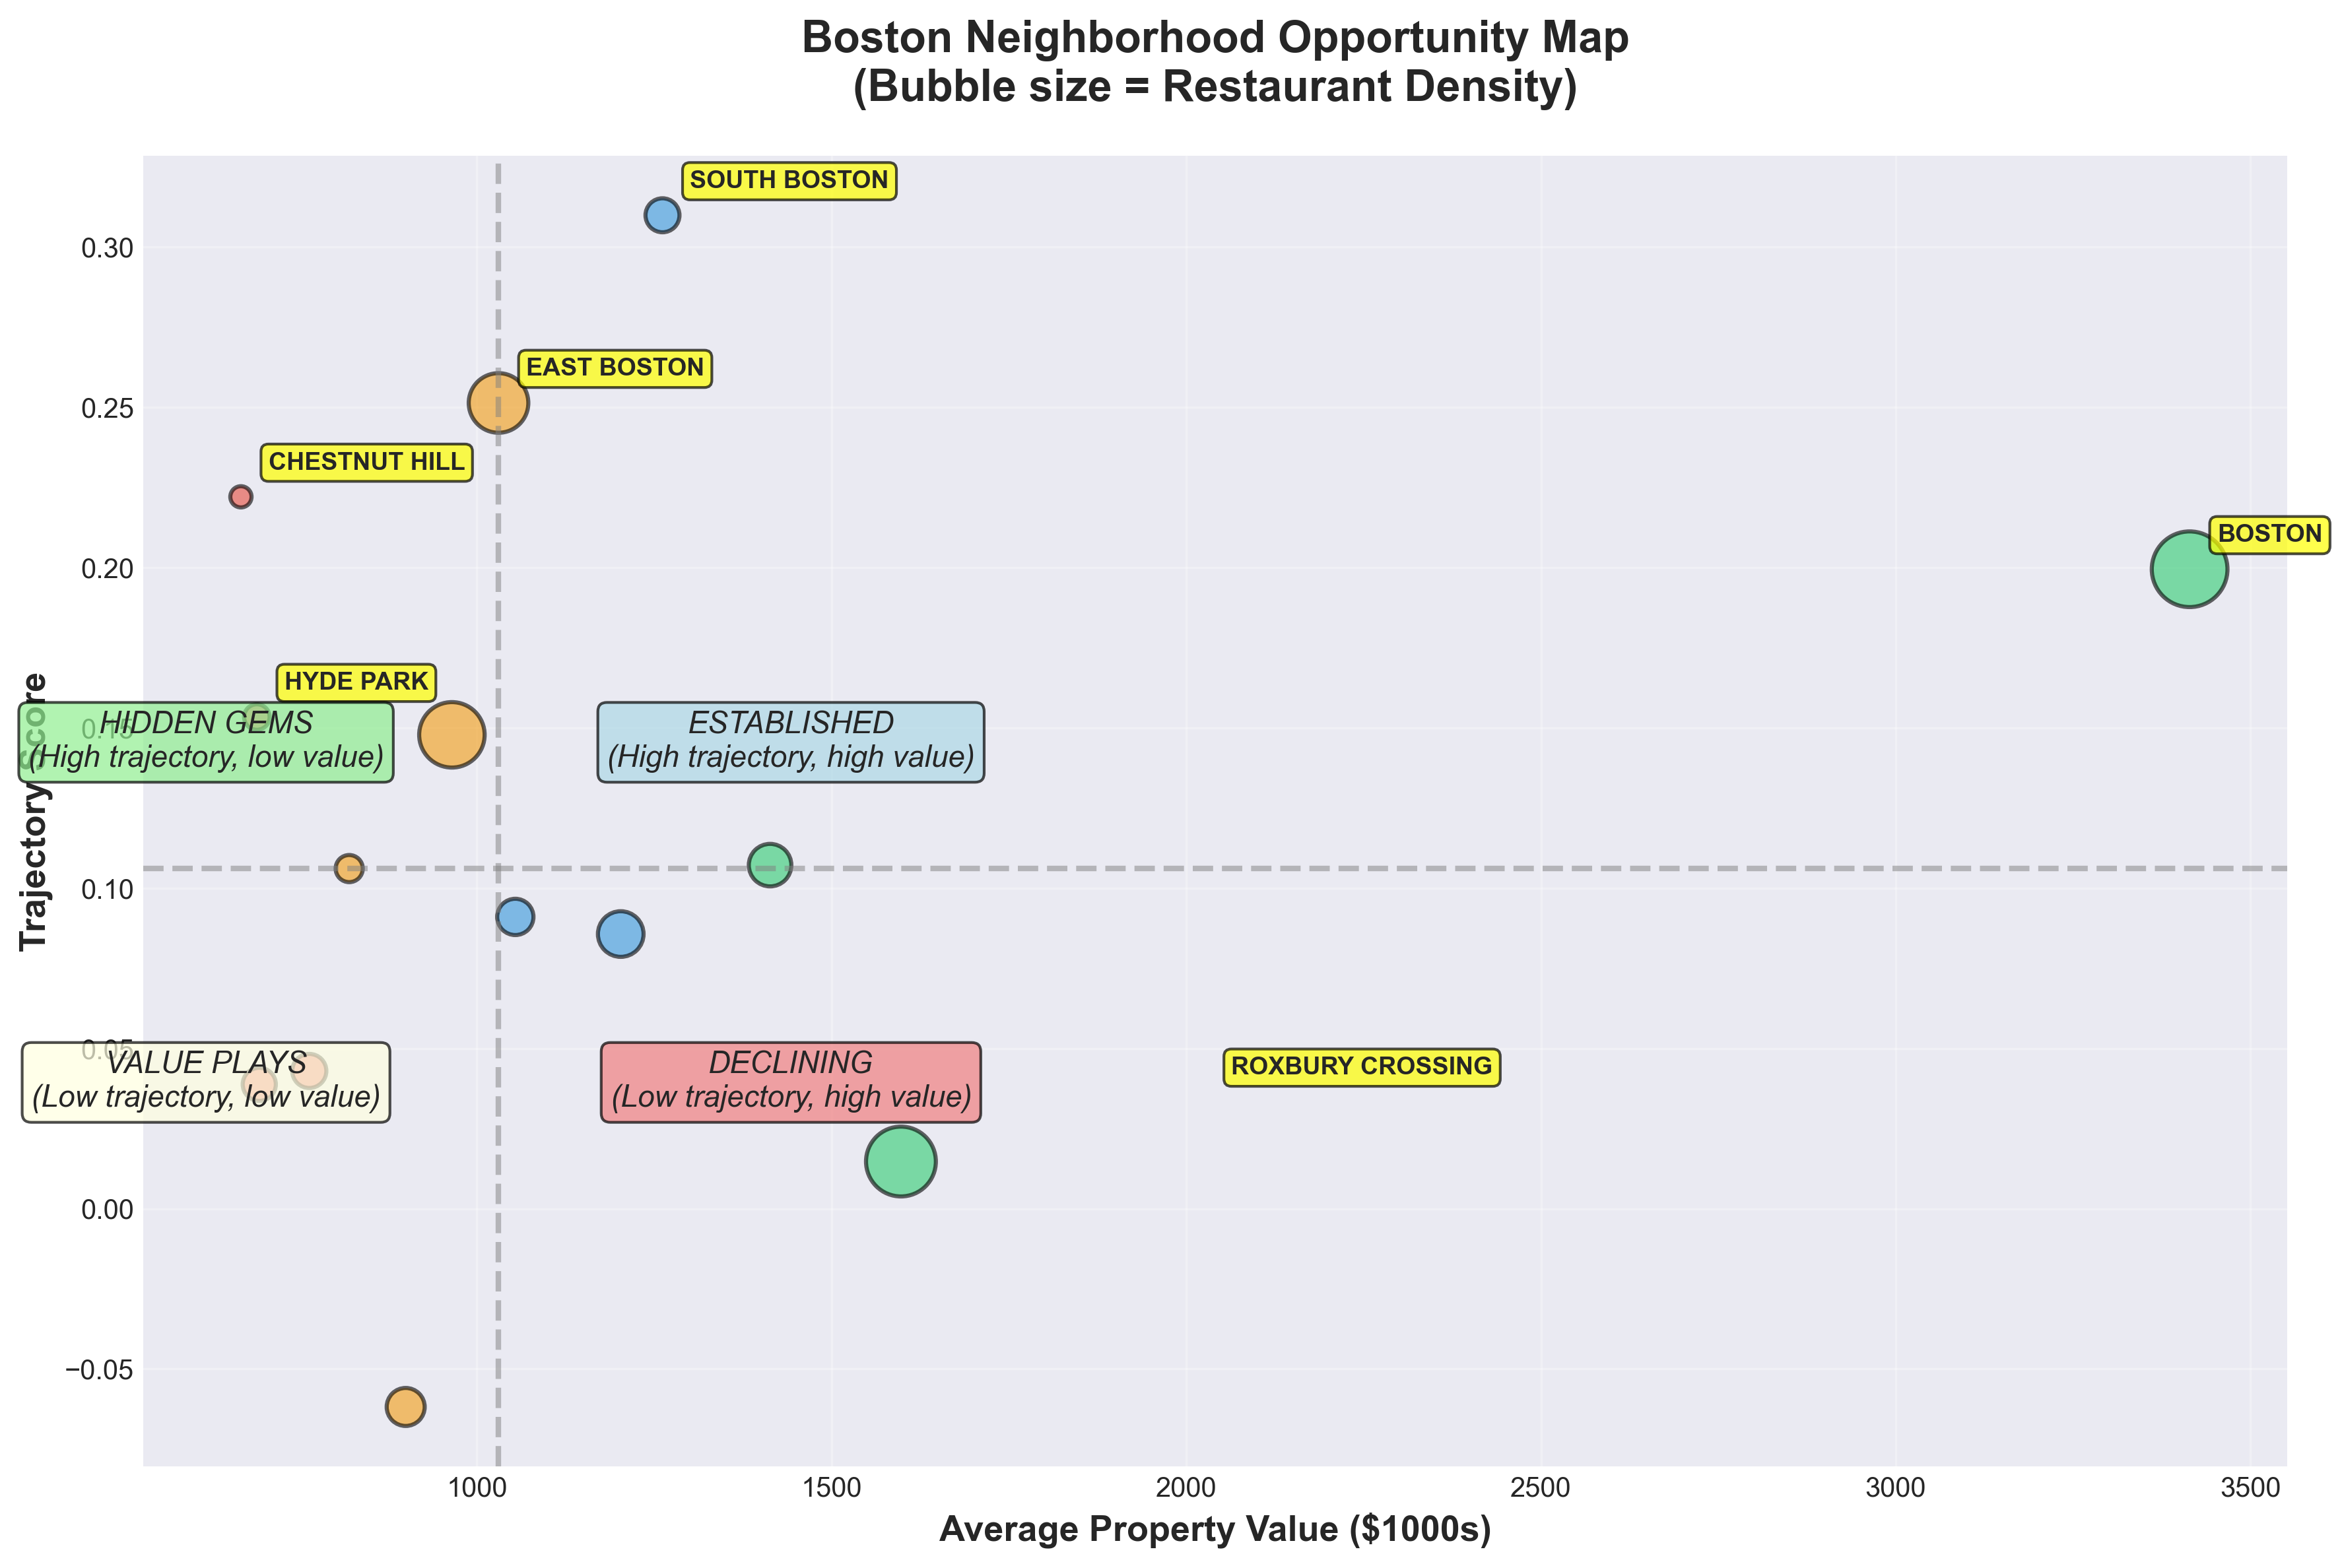
Some promising results
Inspiration
As first-years at Brown, we realized we knew almost nothing about the trajectory of Providence. We had no way to understand how neighborhoods were changing, which areas were emerging, or where opportunity existed. For someone wanting to start a family or a small business, that analysis would be impossible without capital. Yr NBR closes that gap.
Cities are built by whoever can see the future first. When Starbucks or Walmart picks a location, they have teams running correlation analysis across demographics, permits, foot traffic, and zoning. When you pick where to live, open a business, or what bars are getting the most traction, you get Google Maps, Zillow and vibes.
The data is public. The analysis isn't.
What it does
Yr NBR synthesizes municipal data with community intelligence to predict neighborhood trajectories. Rather than measuring absolute levels, we compute momentum scores: the rate of change across permits, 311 complaints, code violations, crime reports, events, and business activity.
The system classifies each record with a signal value (-1.0 to +1.0) and priority weight, then aggregates by neighborhood to identify which areas are emerging, stable, or declining. A RAG pipeline supplements this with Reddit posts, local news, and events to capture what municipal data misses. What people are actually talking about, what they feel, and what they're thinking about doing next.
Knowing when to buy. Knowing what to start. Knowing who to support.
How we built it
Data Processing: Nine municipal datasets flow through type-specific processors inheriting from a base class. Each record is normalized into a unified schema with signal classification, priority weighting, and geolocation. Output: a single 135MB Parquet file (6x compression from raw CSVs).
Momentum Scoring: Split neighborhood data by date, compute pre/post annual rates for each signal type, calculate clamped change rates, then produce weighted averages. This captures the neighborhood's trajectory.
RAG Pipeline: Reddit wiki pages and social media posts are chunked (1K characters) and passed to an AWS Bedrock Knowledge Base. Queries hit Bedrock with Claude 3 Haiku for retrieval-augmented generation with citation tracking. If the data processing is configured to run prioritizing local computing and not through the cloud, the data is embedded via SentenceTransformers (all-MiniLM-L6-v2, 384-dim), and stored in ChromaDB, and then fed through Gemini 3 Flash, which generates a bulleted summary and citations.
Stack: Python 3.12, AWS (S3, Bedrock, Knowledge Bases), ChromaDB, pandas/NumPy/PyArrow, matplotlib/seaborn.
Challenges we ran into
Address format inconsistency across municipal datasets caused our neighborhood extraction to fail a lot. We debugged this, and found out that different city departments use different address conventions, requiring parsing logic specific to the dataset.
Working with 1,800,000+ records meant processing time and memory management became real constraints. We moved to Parquet early and implemented streaming where possible.
Accomplishments that we're proud of
We backtested against Boston property values between 2024 and 2026. 311 complaint totals show strong inverse correlation (Spearman ρ = -0.407) with property value changes. Code violations show real predictive power, which was an "eureka" moment for us.
Our analysis surfaced neighborhoods where high opportunity signals coexist with high neglect scores, revealing the complexity that simple "good/bad" classifications miss.
Adding a new municipal dataset requires only implementing a processor class. The unified schema handles the rest.
What we learned
- Neighborhood-level aggregation provides more meaningful investment signals than street-level correlation.
- Municipal data quality varies wildly: mixed types, timezone, inconsistent formatting.
Nevertheless, the signals are there. Public data contains real, actionable information about neighborhood trajectories, and our prototype breaks down the barrier of entry to nothing.
What's next for Yr NBR
- Working with different, diverse cities, like Providence.
- Extend RAG to capture resident perspective alongside government data.
- More rigorous backtesting.
- Add ground-truth verification using aerial imagery change detection.
- A confidence indicator measuring how often permitted projects actually complete.

Log in or sign up for Devpost to join the conversation.