Inspiration
We wanted to try something simple for our first exposure to data science and data visualization, so we decided to try something that interests all of us.
What it does
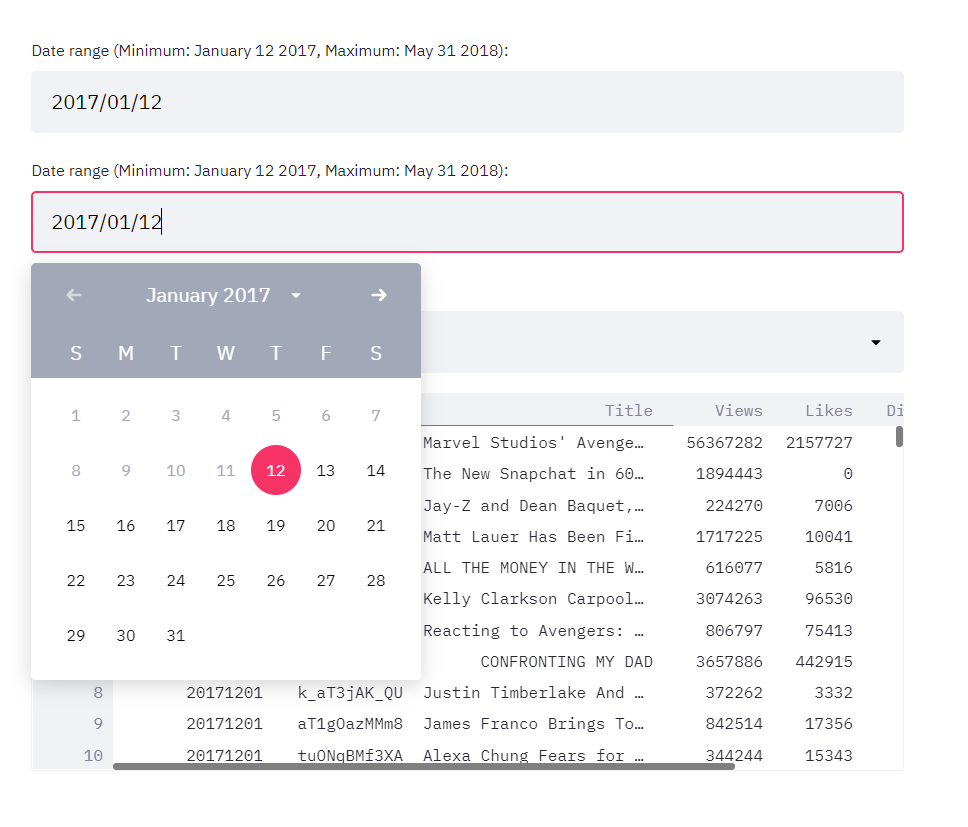
Our program prints out trending YouTube videos from the start of 2017 until mid-2018. It prints certain metrics such as the number of views and the number of dislikes on a table.
How we built it
We built it in PyCharm, with the help of streamlit and other data libraries such as Pandas.
Challenges we ran into
We were beginners, so we spent a lot of time trying to understand all the new syntax and functions, instead of actually adding new features.
Accomplishments that we're proud of
We were able to get a streamlit app running, and even displayed a table properly! We also learned how to use Pandas to read in CSV files, even larger ones too. We weren't able to finish our project, unfortunately. This is mainly due to our lack of experience.
What we learned
We learned that we should come prepared with a project idea, so that when the hackathon rolls around we can get to to work immediately.
What's next for Youtube Trending Statistics
DISCLAIMER
We didn't have time to use OS or Path objects to help with finding the 'USVideos.csv' file, so if you want to run our program, you will have to download the csv file from our GitHub page, which is linked down below, and save it in an easy to find location. You will then replace your directory on the lines that have directories. Mine is 'C:/Users/ongad/OneDrive/Desktop/CruzHacks Data/USvideos.csv', for example.


Log in or sign up for Devpost to join the conversation.