-
-
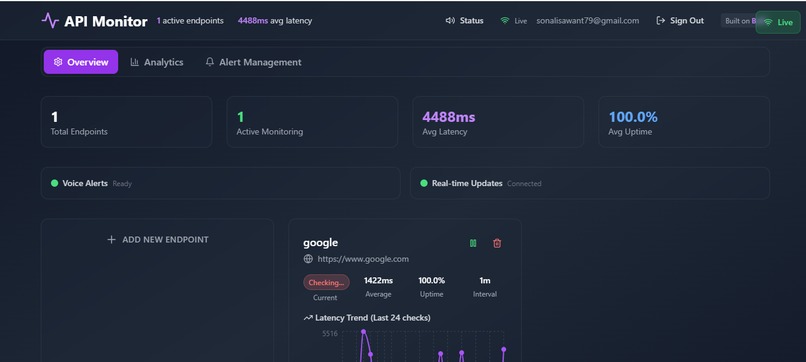
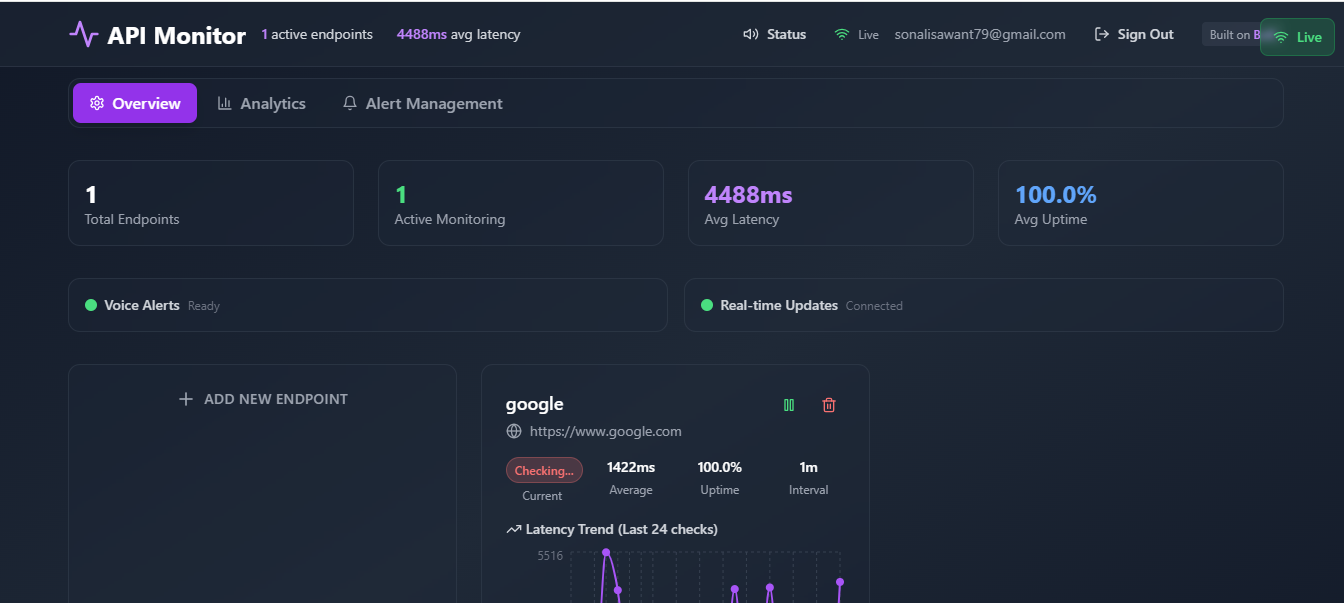
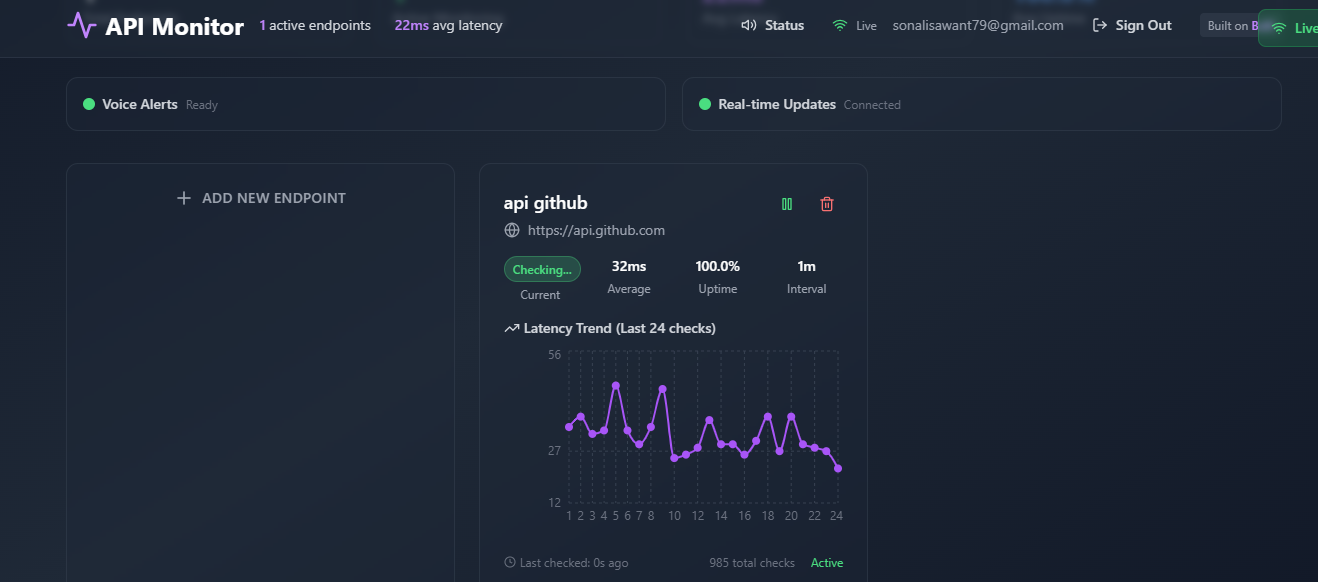
api latency dashboard
-
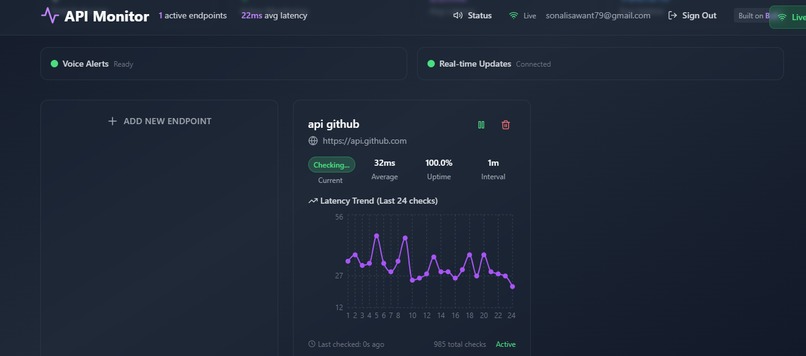
api latency dashboard
Inspiration
Our idea was sparked by a common frustration faced by developers and DevOps teams: “Why is my API slow, and where’s the bottleneck?” Whether building a SaaS platform or integrating services like Stripe, GPT, or Google Maps, API latency often becomes a blind spot. We realized there was no unified tool that could: • Track latency across all endpoints in real-time • Provide historical performance trends • Alert developers before users feel the impact
What it does
API LATENCY DASHBOARD is a real-time API latency dashboard built to help developers quickly identify, understand, and resolve API performance issues. In a world where digital products rely on dozens of third-party APIs, even a few milliseconds of delay can degrade user experience or stall workflows. This dashboard aims to bring visibility, speed, and intelligence to API monitoring, all in one intuitive platform.
How we built it
we built this app on bolt.new Frontend: React, JavaScript, Tailwind CSS, Recharts, Lucide Icons Backend: Supabase (PostgreSQL, Auth, Realtime) APIs: ElevenLabs (Voice AI), Fetch API, Performance API Deployment: Netlify, Vite Core Platform: Bolt.new
Accomplishments that we're proud of
we could build and deploy the app within 2 days.
What we learned
This project taught us how crucial real-time observability is in modern development. We explored: • Network-layer debugging and response time breakdowns • How to architect scalable, event-driven dashboards using web sockets • Best practices for alert management and API health scoring We also learned to design for clarity, making the UI intuitive for both engineers and product managers.
What's next for API LATENCY DASHBOARD - See your API performance clearly
• Team collaboration features • Machine learning to predict failures before they happen • Mobile app for monitoring on the go • Integration with incident management tools • AI-based root cause analysis

Log in or sign up for Devpost to join the conversation.