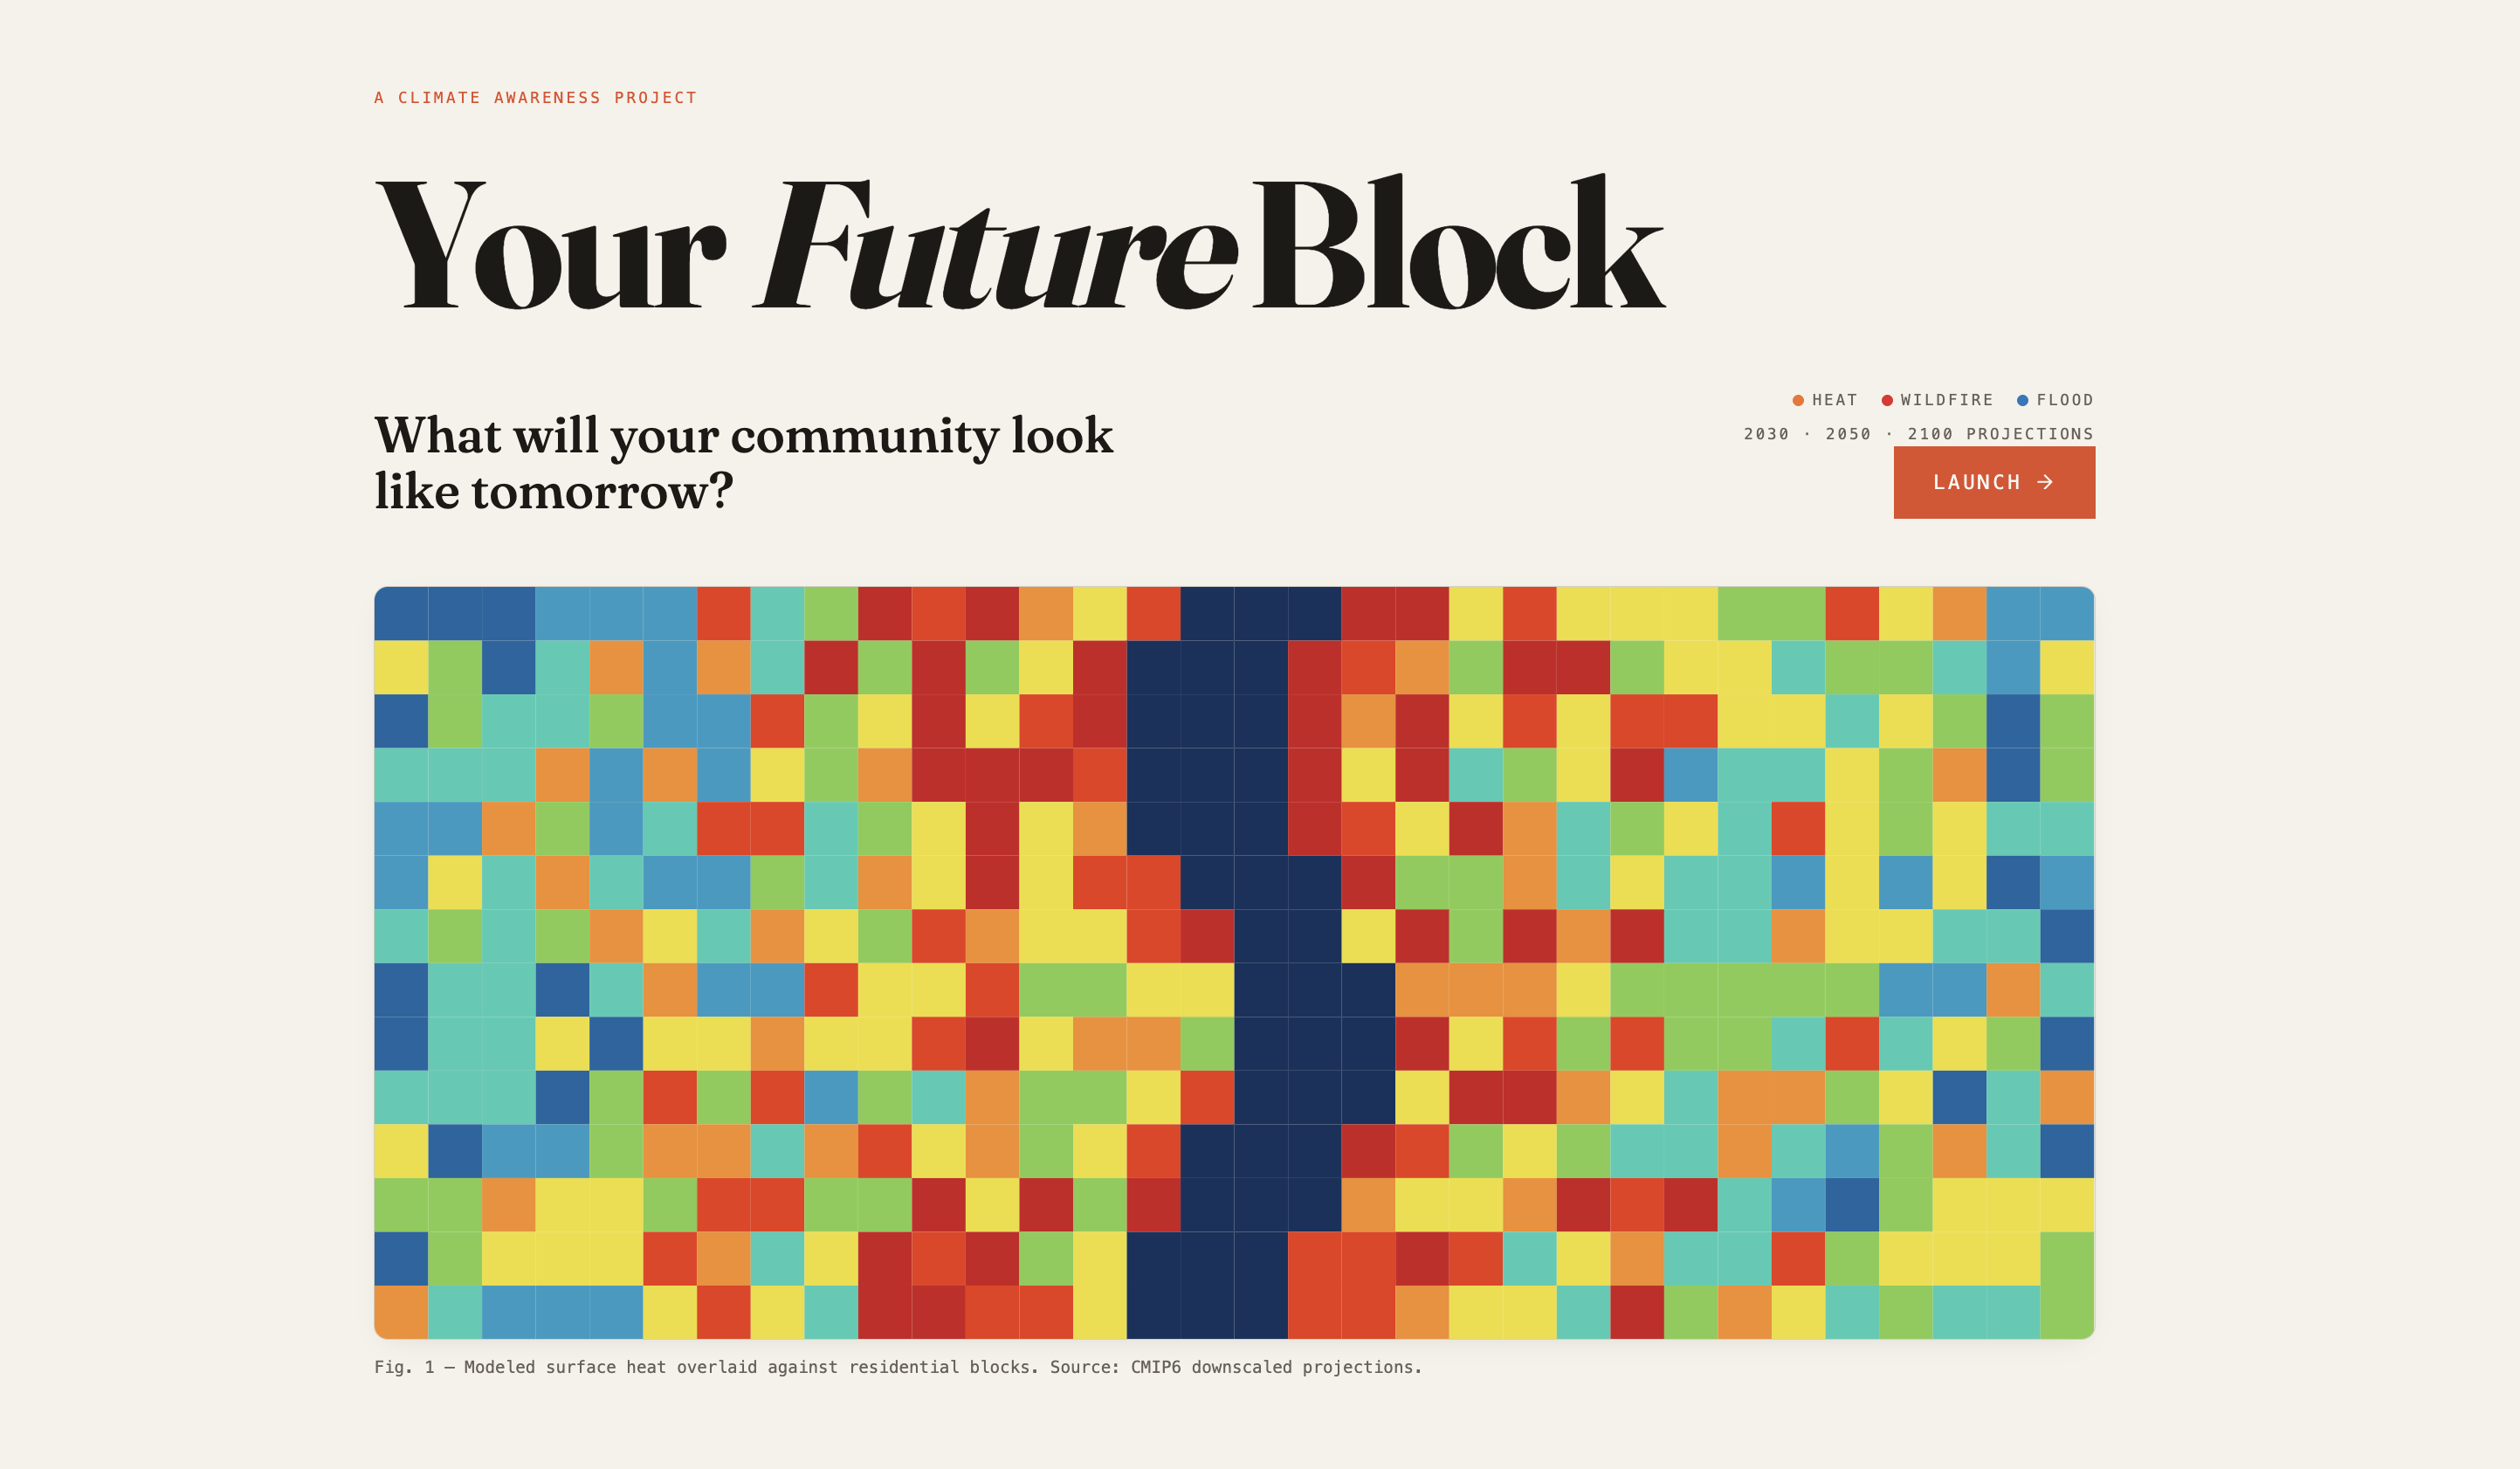
Your Future Block
Pitch Deck: https://canva.link/7diuta24ax8o7l1'
Demo Links:
https://yourfutureblock.vercel.app
Your Future Block is an interactive climate-risk visualizer that helps people understand how climate hazards may affect their own communities over time. Instead of presenting climate change through abstract statistics, long reports, or difficult-to-read maps, Your Future Block lets users enter an address and explore projected climate risks around that block through a clear, visual, and local interface.
Inspiration
As a Caltech student studying Computer Science and Environmental Science + Engineering, I am passionate about scientific communication. I wanted to make climate risk easier for the public to understand.
Climate risk is often discussed at a global or regional scale, but people experience it locally: in their homes, neighborhoods, commutes, schools, and workplaces. Many people underestimate how hazards like extreme heat, flooding, and wildfire could affect the places they live, work, and travel through.
Your Future Block was inspired by a simple question:
What if anyone could type in an address and immediately see how climate risk around that block may change over time?
What It Does
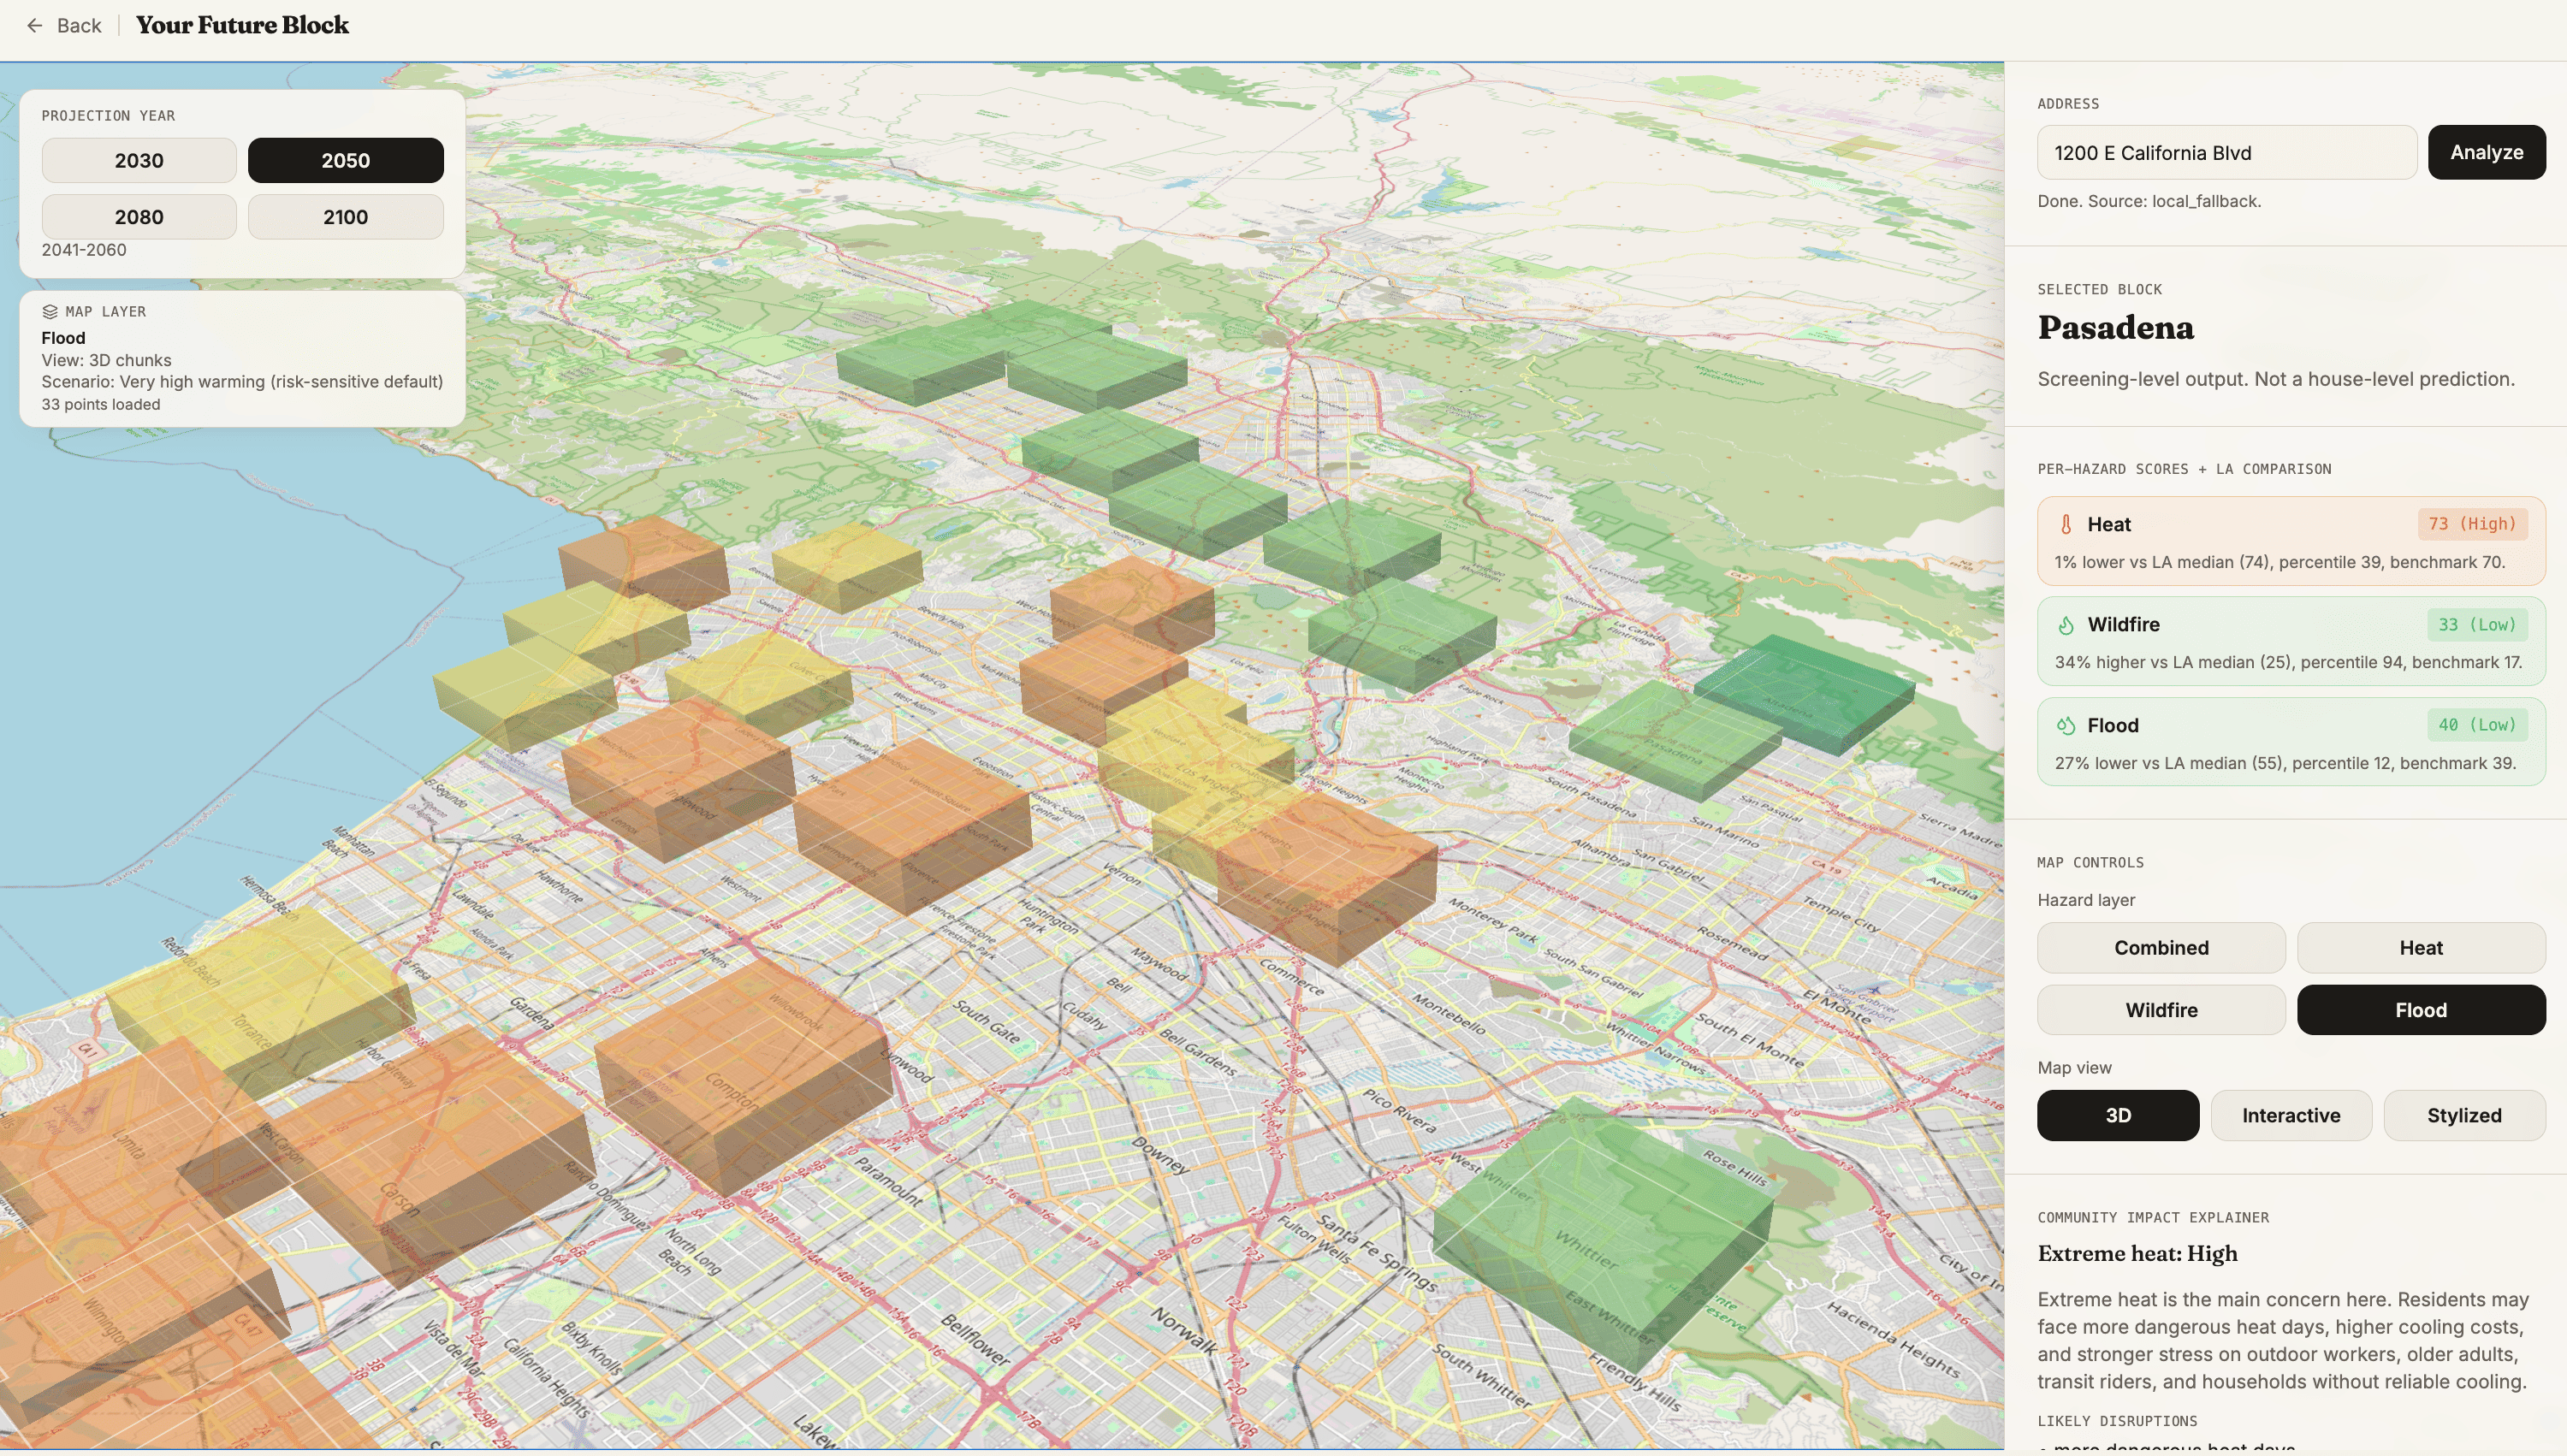
Your Future Block allows users to enter an address and explore projected climate risks for that area through a map-based interface.
The app visualizes multiple climate-related hazards, including:
- Extreme heat
- Flooding
- Wildfire exposure
Users can move a future-year slider from the near future toward the end of the century to see how projected risk changes over time.
Rather than presenting raw scientific data, the platform translates climate projections and public hazard datasets into:
- Clear risk scores
- Visual map layers
- Plain-English explanations
- Localized climate-risk insights
The goal is not to predict the exact future of a single house, but to help people understand neighborhood-level climate exposure in a way that is accessible, transparent, and actionable.
Why It Matters
Most people do not fully understand their vulnerability to climate-related risks until disaster strikes.
We often hear about cities that could be underwater by the end of the century, increasing extreme weather events, and long-term global climate projections. But many people remain disconnected from how climate interactions will shape their own communities.
Your Future Block closes that gap by making climate risk personal.
How I Built It
Approach to Design + Front End : I used Figma and Canva to design the mission, visualizations, key parts of the platform. I provided our designs to Lovable and utilized this to create a clean front end that embodied our mission and goals. I was able to extend our Lovable front-end code to connect it to our data rich backend. I am proud to say that Lovable carried a lot of the front end engineering work.
Approach to Functionality: I built Your Future Block by combining public climate, hazard, and vulnerability datasets into a local risk-scoring pipeline.
- Geocoding user-entered addresses into latitude, longitude, and local geographic regions
- Using climate projection data to estimate future changes in heat and precipitation
- Incorporating emissions scenarios to compare possible climate futures
- Adding local physical risk layers such as flood zones, wildfire hazard areas, elevation, tree canopy, and impervious surface
- Including social vulnerability indicators to better represent how climate hazards affect communities differently
- Creating normalized risk scores for heat, flood, wildfire, and overall climate exposure
- Building an interactive frontend with a map, risk cards, and a future-year slider
The front end is mostly Typescript and Javascript libraries, the backend is hosted on Fly.io.
Key Features
Address-Based Search Multi-Hazard Risk Scoring Future-Year Options Interactive Map Layers Plain-English Explanations Transparent Model Design
Climate Risk Scoring
Your Future Block combines broad climate projections with higher-resolution local datasets to estimate neighborhood-level exposure.
The model considers factors such as:
- Projected heat change
- Projected precipitation change
- Flood-zone exposure
- Wildfire hazard exposure
- Elevation
- Tree canopy
- Impervious surface
- Local land cover
- Social vulnerability indicators
These inputs are normalized into risk scores for:
- Heat risk
- Flood risk
- Wildfire risk
- Overall climate exposure
Challenges Ran Into
One major challenge was balancing scientific accuracy with hackathon scope. Climate models are powerful, but they are not designed to make exact predictions at the scale of a single house or block. I had to think carefully about how to communicate uncertainty while still making the experience useful and engaging. Another challenge was data resolution. Climate projection datasets are often coarse or extremely large, while users expect local, block-level results. To address this, I combined broader climate projections with higher-resolution local datasets like land cover, tree canopy, flood zones, and wildfire maps.
Lastly, I struggled mostly with connecting my backend, front-end, and custom domain together. I had never really edited DNS records and worked with this many tools to connect each piece, but I learned so much.
Accomplishments
I am proud that Your Future Block turns complex climate data into something people can understand in seconds.
I am especially proud of:
- Creating a clear, address-based user experience
- Designing a transparent climate-risk scoring system
- Combining multiple types of climate hazards into one interface
- Making scientific projections feel local and personal
- Communicating uncertainty responsibly
- Building a project that connects technical modeling with public education
Most importantly, I built something that could help people better understand the future risks facing their own communities.
What I Learned
Firstly, a lot of deployment tools and how they connect with each other.
I also learned that communication is just as important as computation. A technically accurate model is not useful if people cannot understand what it means. Initially when outputting the data without thinking about how to convey the community impact elements, the site felt void of helpful or useful information. A lot of thought was put into helping non scientists think about their communities. The way information is visualized, explained, and framed has a huge impact on whether users trust and act on it.
What's Next
Next, I would like to expand Your Future Block beyond into a more robust local climate-risk platform that takes into account policy and detailed climate scenarios.
Future improvements include:
- Adapting to policy changes and climate related news
- Supporting more cities and regions
- Adding more detailed climate scenarios
- Improving the scoring model with expert-reviewed weights
- Incorporating evacuation routes
- Adding cooling centers, hospitals, schools, and transit stops
- Adding uncertainty ranges instead of single risk scores
- Providing personalized preparedness recommendations
- Making the tool useful for homeowners, renters, city planners, and community organizations
Long-Term Vision
Our long-term vision is for Your Future Block to become a public-facing climate communication tool that helps people understand not just global climate change, but what it could mean for their own block.
Built By
Caltech student passionate about climate science, public education, and accessible scientific communication.
Built With
- duckdb
- fastapi
- fly.io
- git
- github
- javascript
- leaflet.js
- maplibre-gl-js
- node.js
- npm
- openstreetmap-tiles/api
- python
- react
- react-leaflet
- tailwind-css
- typescript
- vite


Log in or sign up for Devpost to join the conversation.