

Inspiration
As a team of two data scientists and two software engineers, we wanted to collaborate and create something meaningful involving one another's skills sets. The JetBlue challenge in YHack caught our attention as it provided an challenge which we could equally contribute to and push the limits of what we can accomplish. The challenge was to crawl any/all public domain/social media data to get customer’s sentiments of JetBlue and identify customer painpoints.
What it does
Our web application aggregates and visualizes the data collected from twitter and sentiment analysis in an interactive geospatial/geographical user friendly interface. We also implemented a graphical depiction of relevant sentiments and topics across the United States and over a specified timeline using machine learning to understand the major topics influencing user sentiments.
How we built it
We used following timeline for our project:
Defining Problem Statement: Text mining tweets based on the keyword #JetBlue to provide insights into social popularity/issues around JetBlue. We wish to target areas of inconsistent and negative customer experience to improve JetBlue's customer satisfaction and service.
Data Preparation: We scrapped #JetBlue tweets from Twitter to fetch tweet text, location, and date of a related tweet.
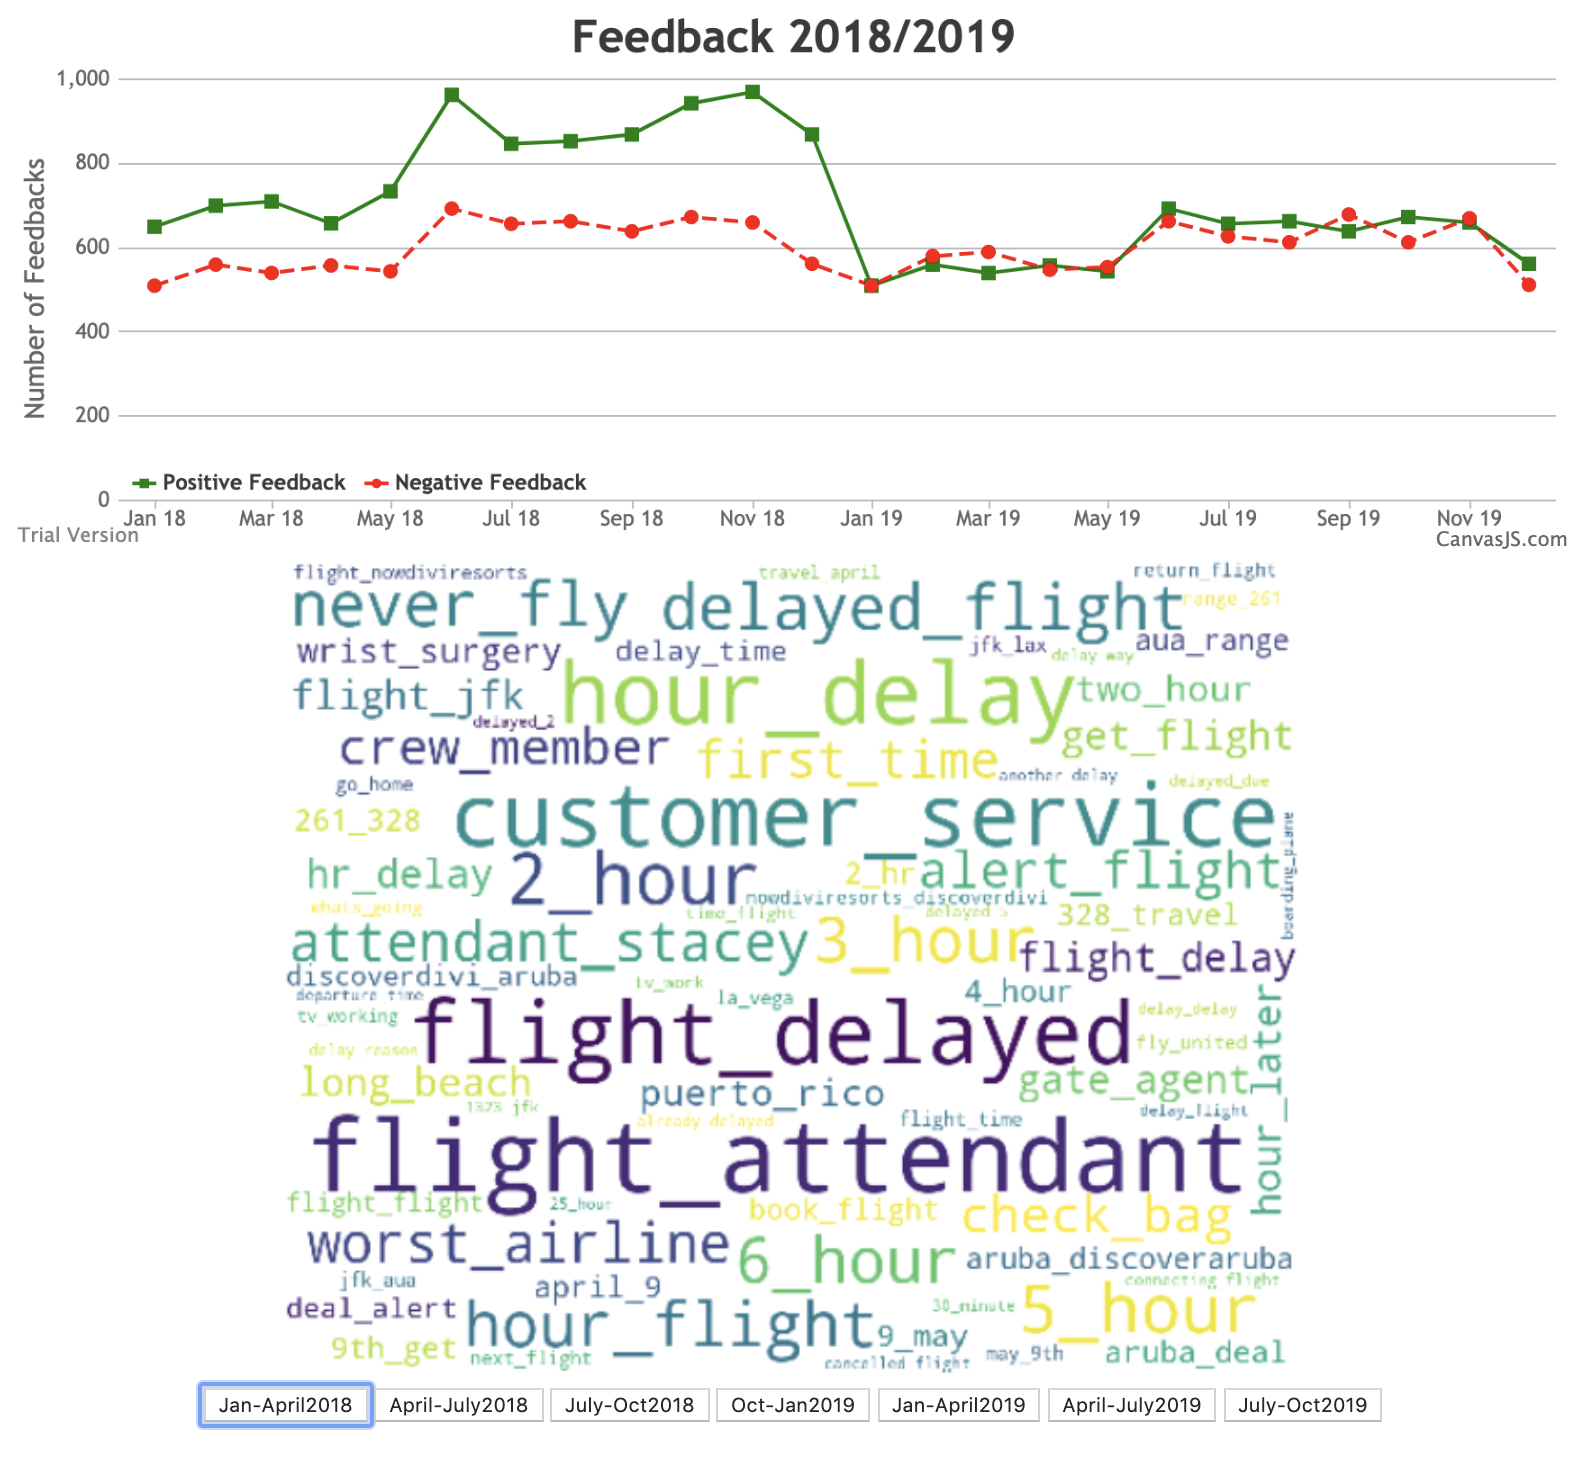
Data Exploration: We performed text mining and created Word Cloud diagrams to identify the frequently occurring subjects in the tweet descriptions.
Modelling: We used Google Natural Language API to fetch the associated tweet sentiment score. Word Cloud was then used to identify the subject of negative and positive tweets. We used LDA for topic modelling.
Deployment: To visualize our findings in an interactive, easily understandable, and visually appealing manner, we created a web application. The application was developed using javascript, html, and css. It features an interactive geospatial map which highlights the overall positive/negative sentiments and also provides the option to drill down into the specifics of each state (overall sentiment score, average positive/negative score, positive/negative feedback).
Challenges we ran into
We initially struggled with fetching/scraping the data as Twitter has several limitations as to how we could fetch the public data for free. Additionally, it was quite challenging to develop an interactive visualization platform in such a limited time period.
Accomplishments that we're proud of
As a team, we are proud of collaborating and putting our strengths forward while supporting each others weaknesses to problem solve and ultimately complete this project. We came out inspired to innovate and test our skills further with an increased skillset, and a renewed perspective.
What we learned
Web-scraping, Javascript, HTML, CSS, Machine Learning - Topic Modelling, Google Cloud API, the challenges of gathering data in the desired format.
What's next for YJB
We will continue updating our system as we gather more data and gain more insight into customer service.
Built With
- css
- data-visualization
- google-colab
- google-natural-language-api
- html5
- javascript
- machine-learning
- natural-language-processing
- python
- sentiment-analysis
- topic-modeling

Log in or sign up for Devpost to join the conversation.