-
Logo
-
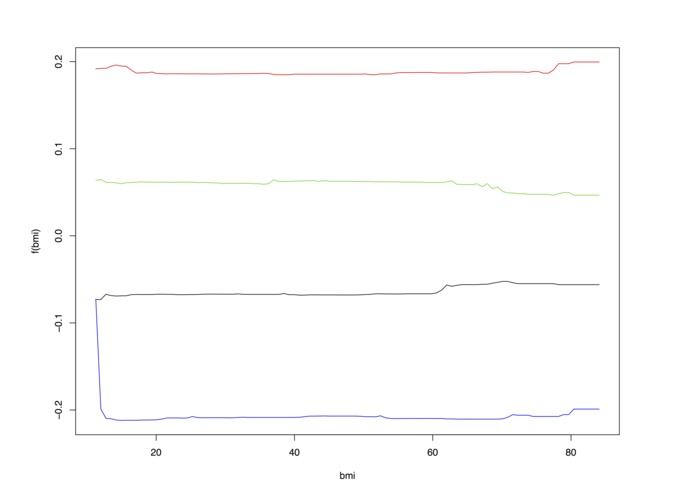
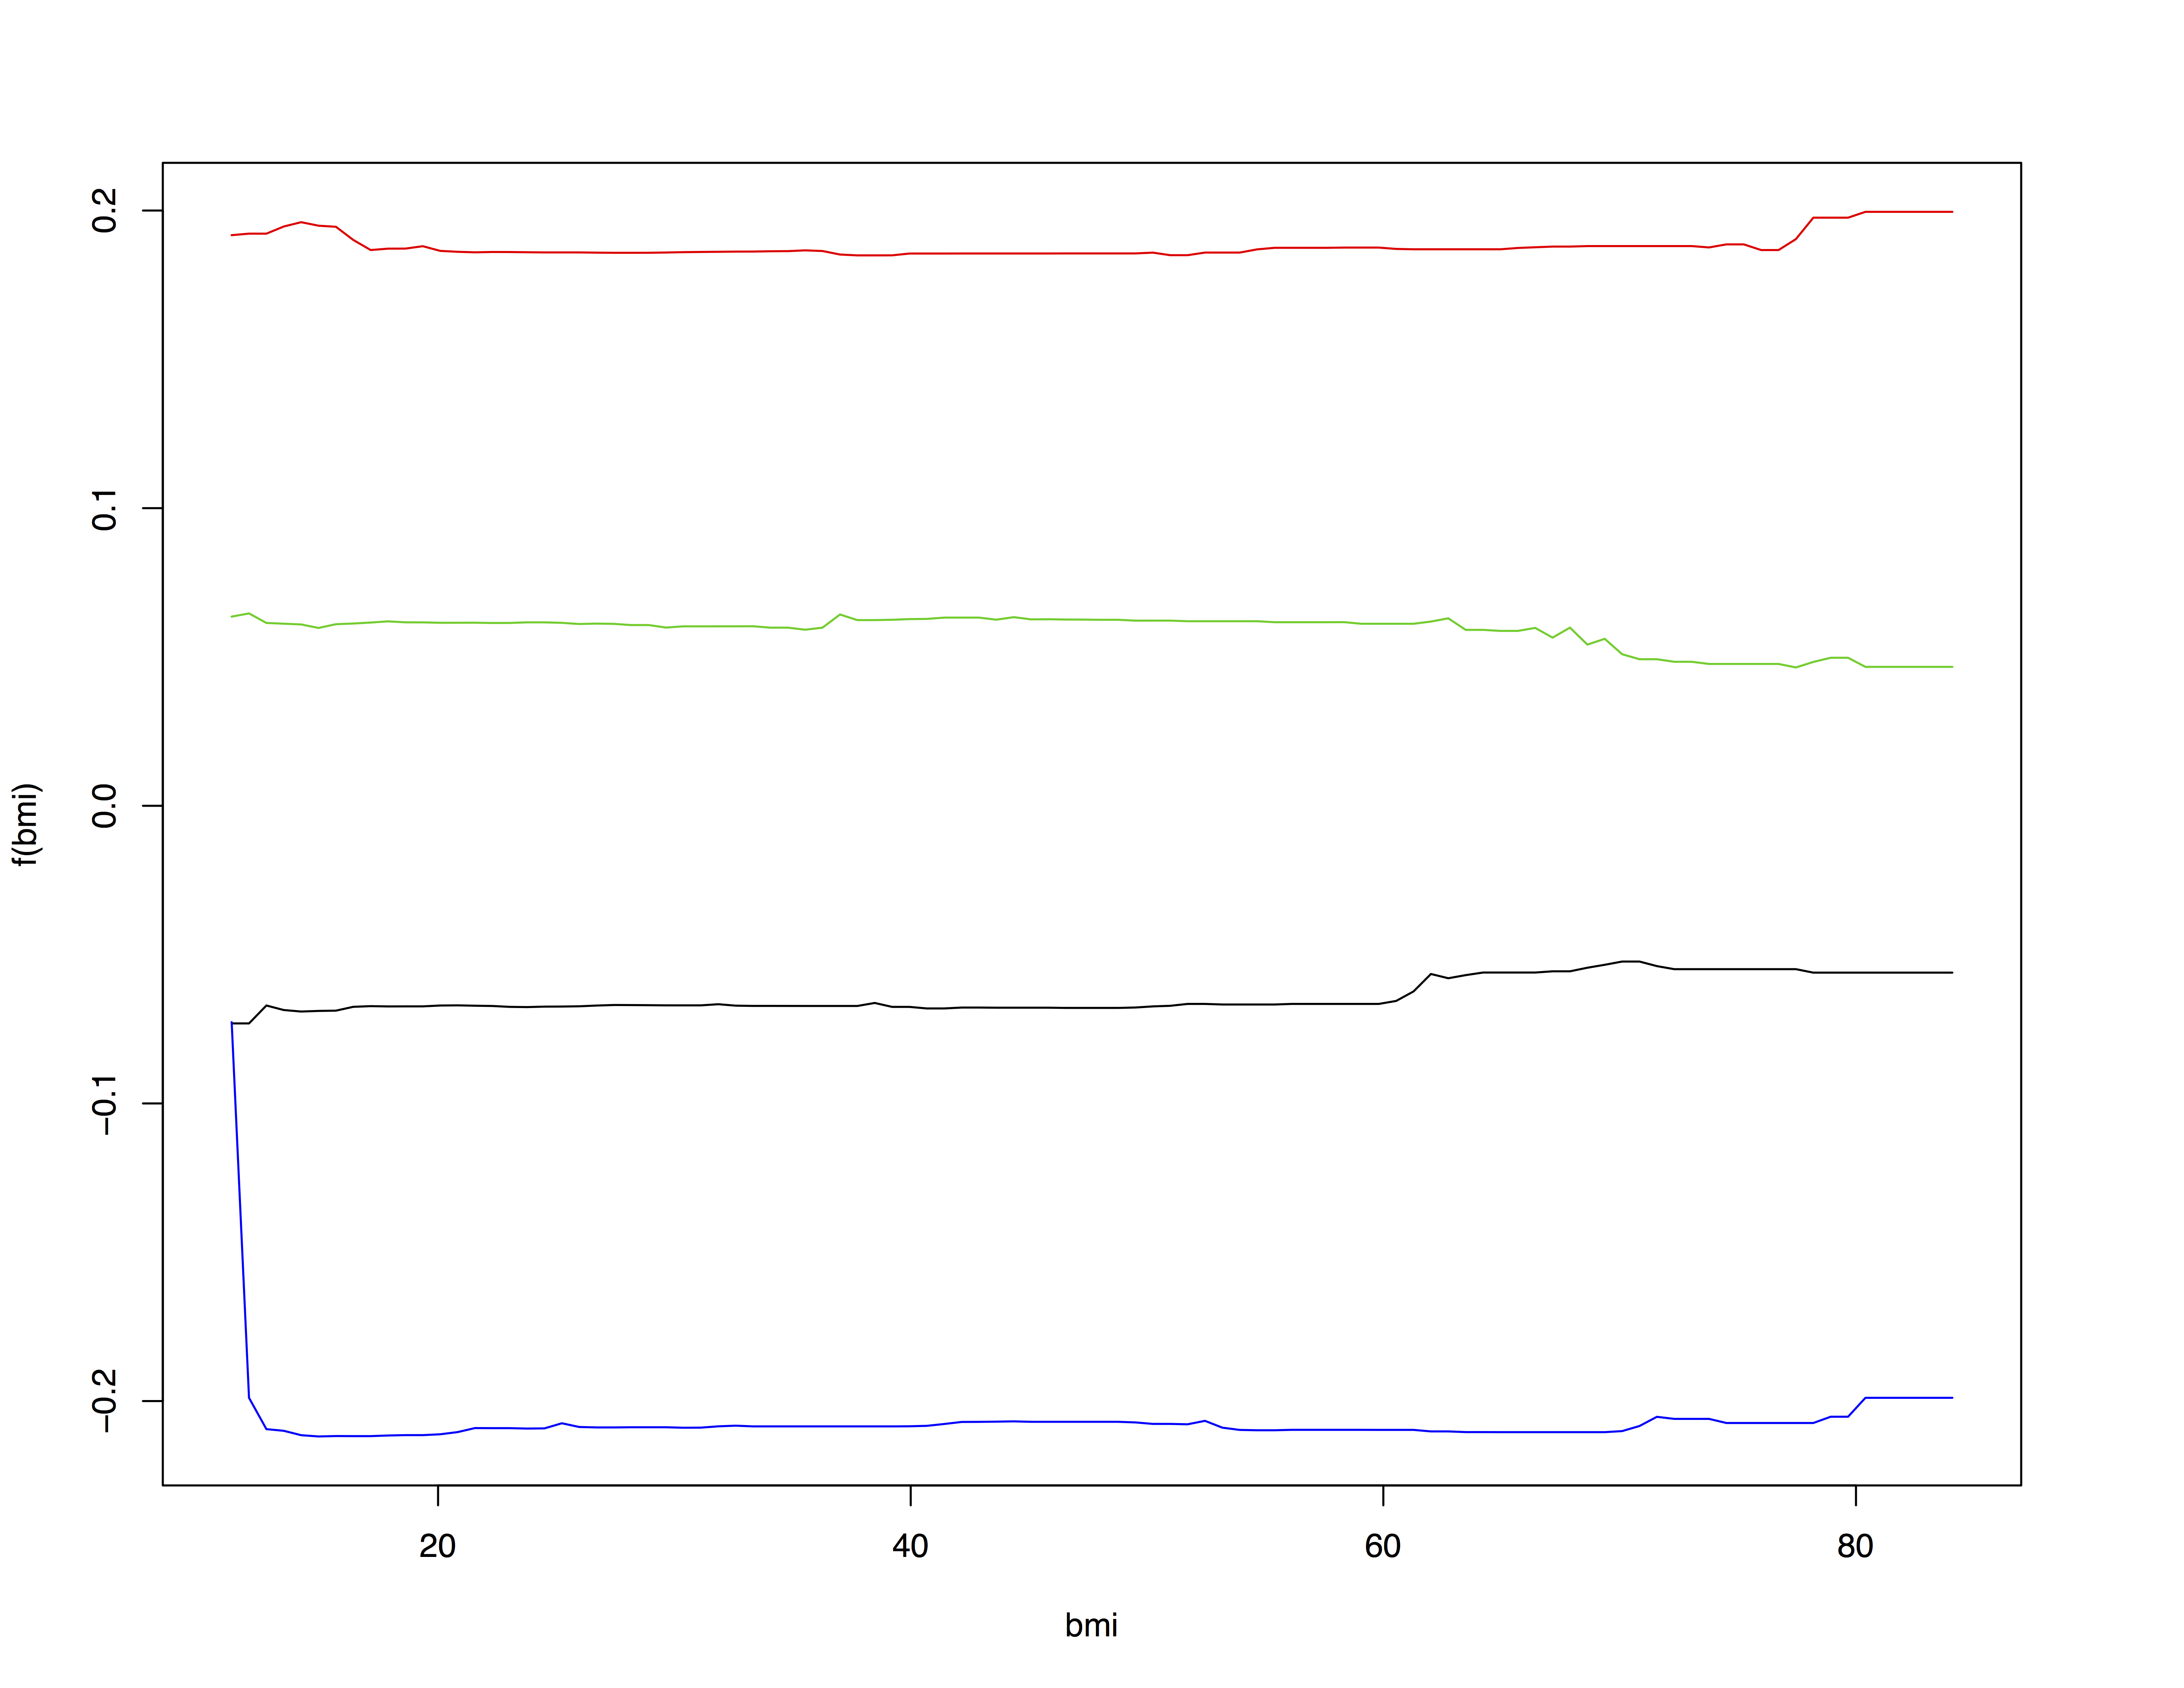
BMI
-
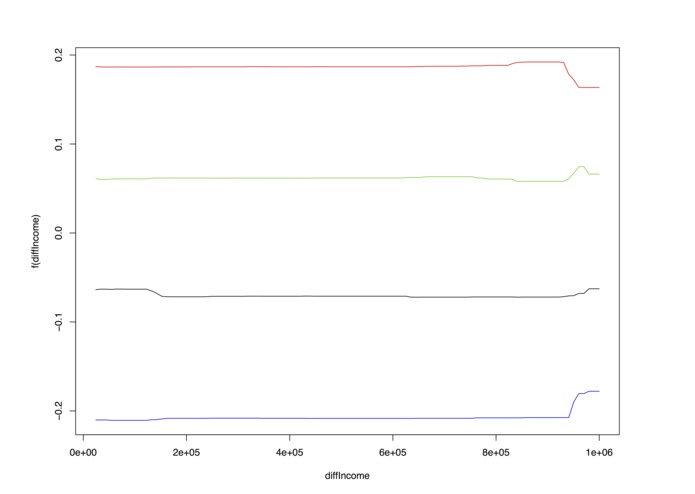
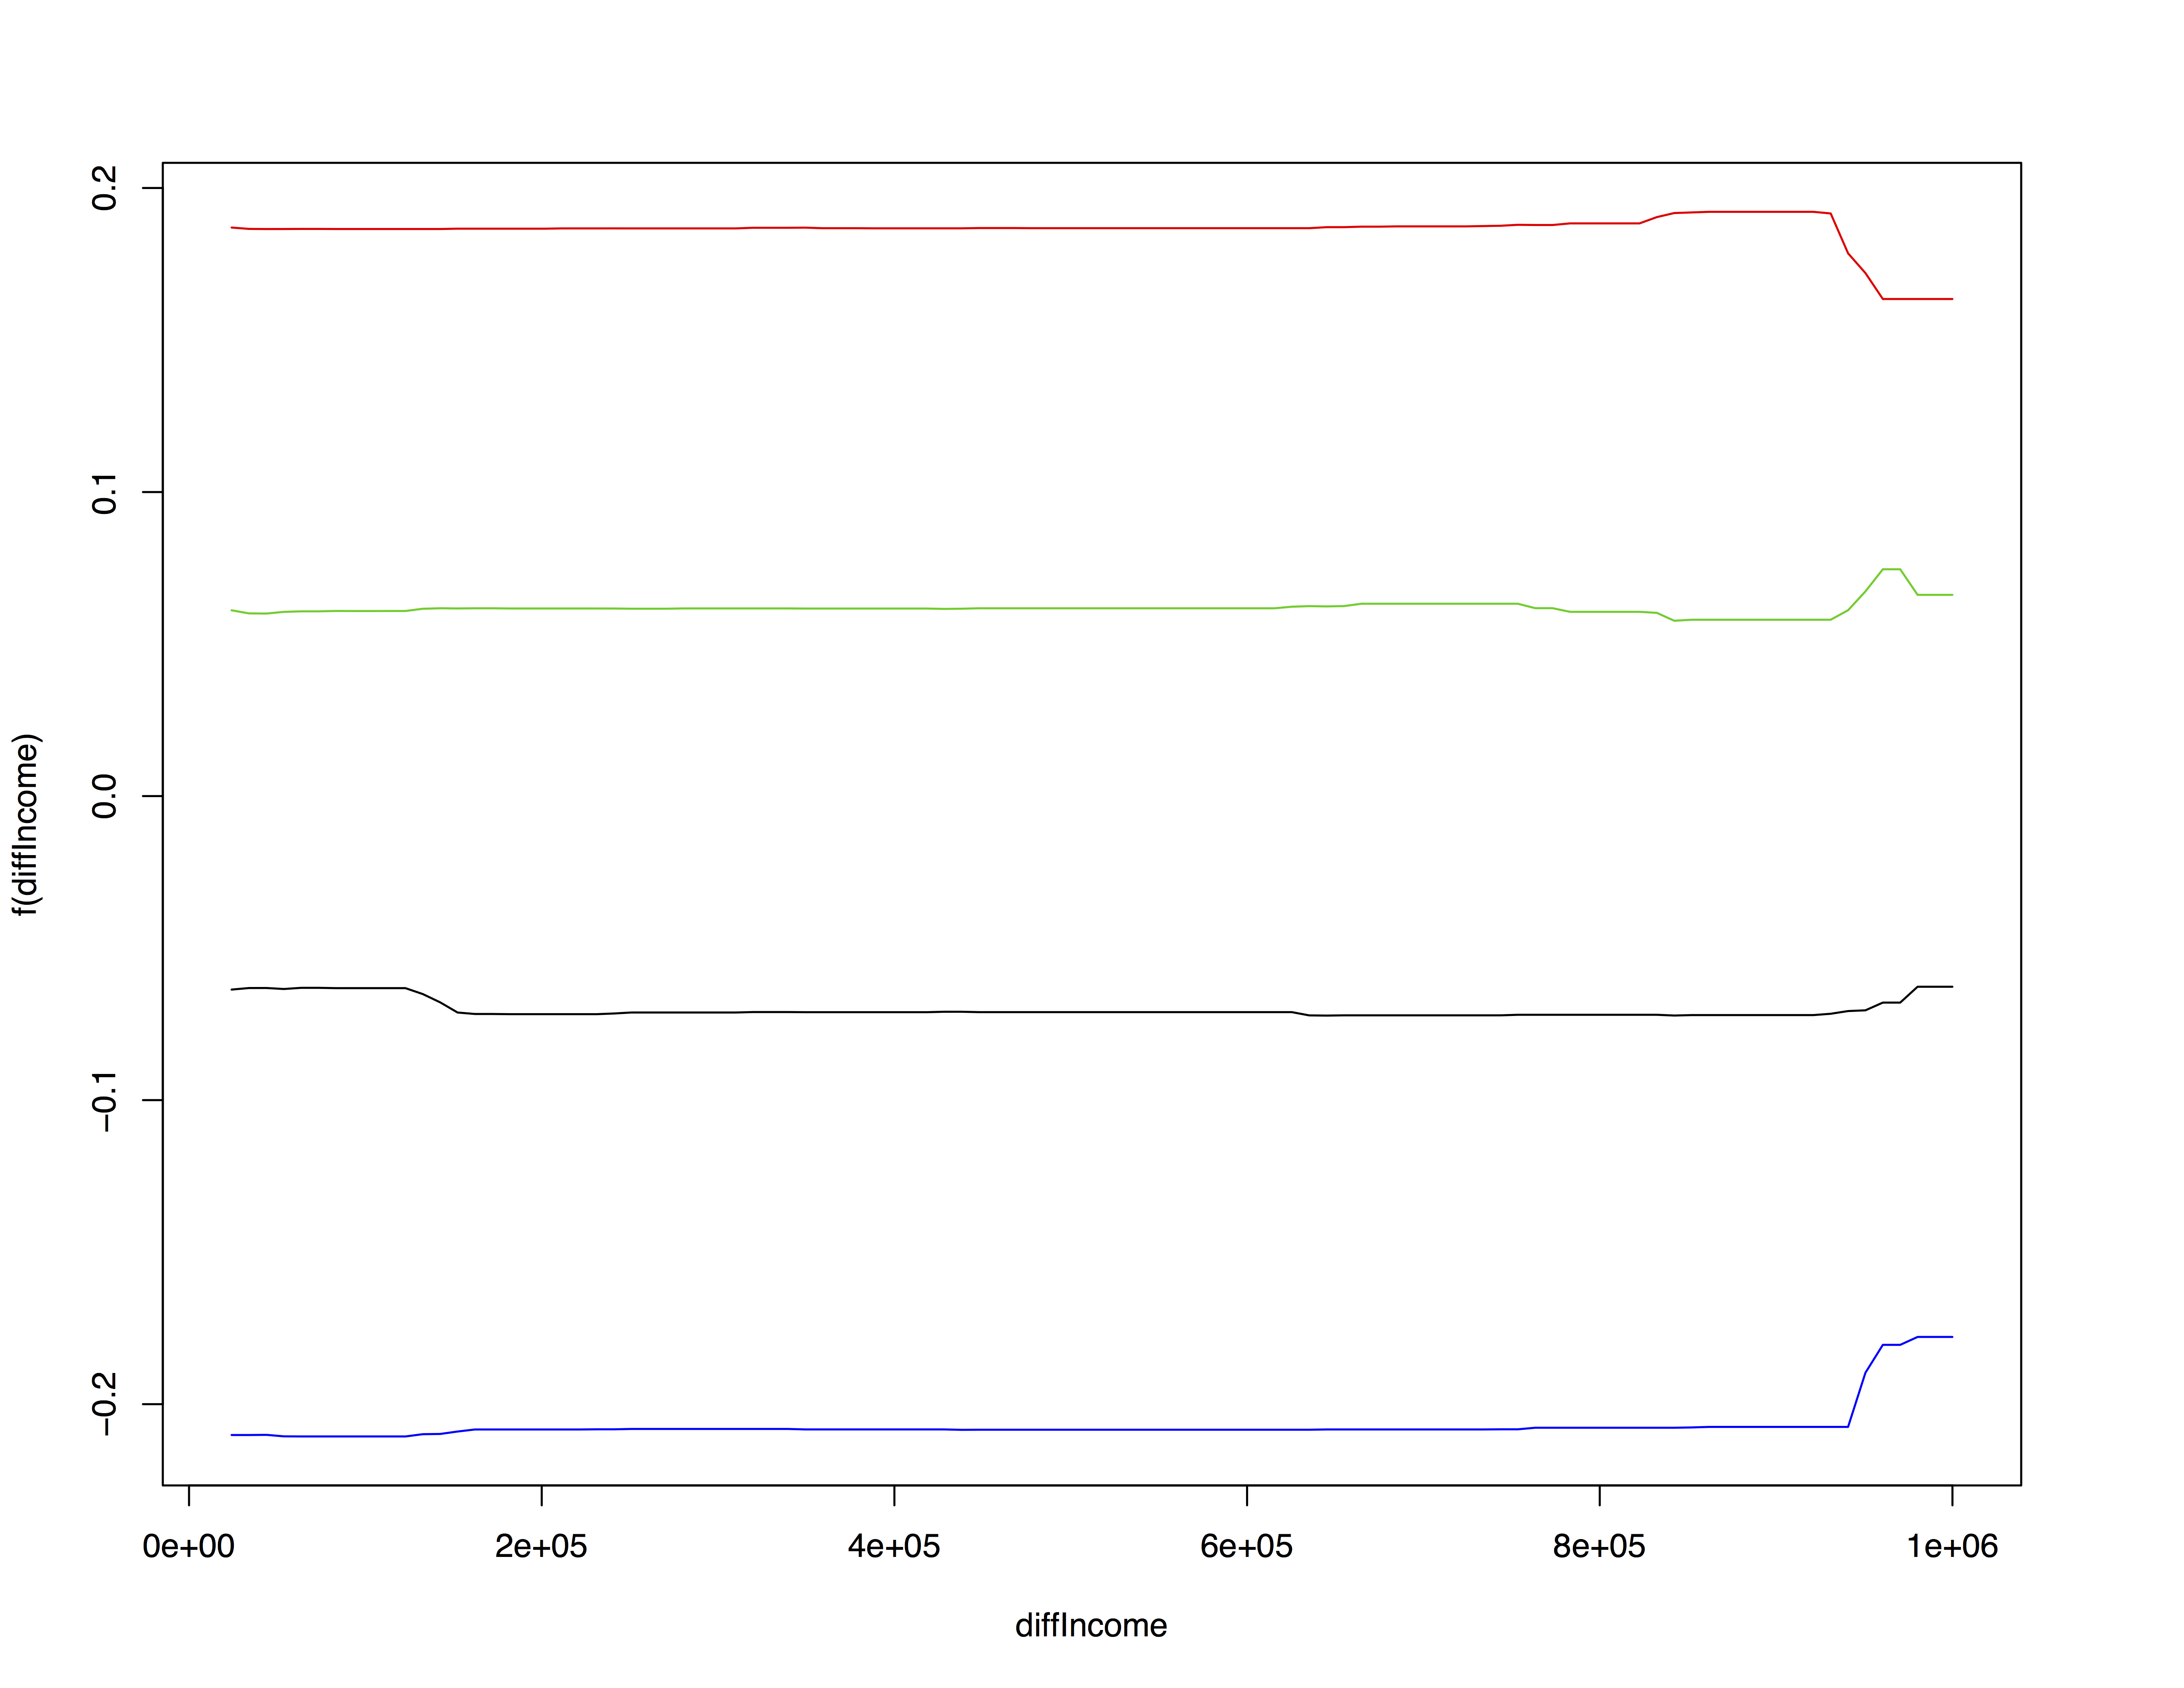
Income vs. State Average
-
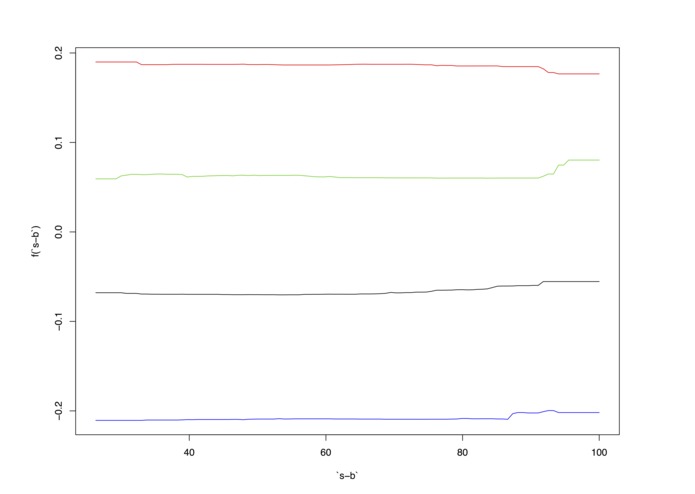
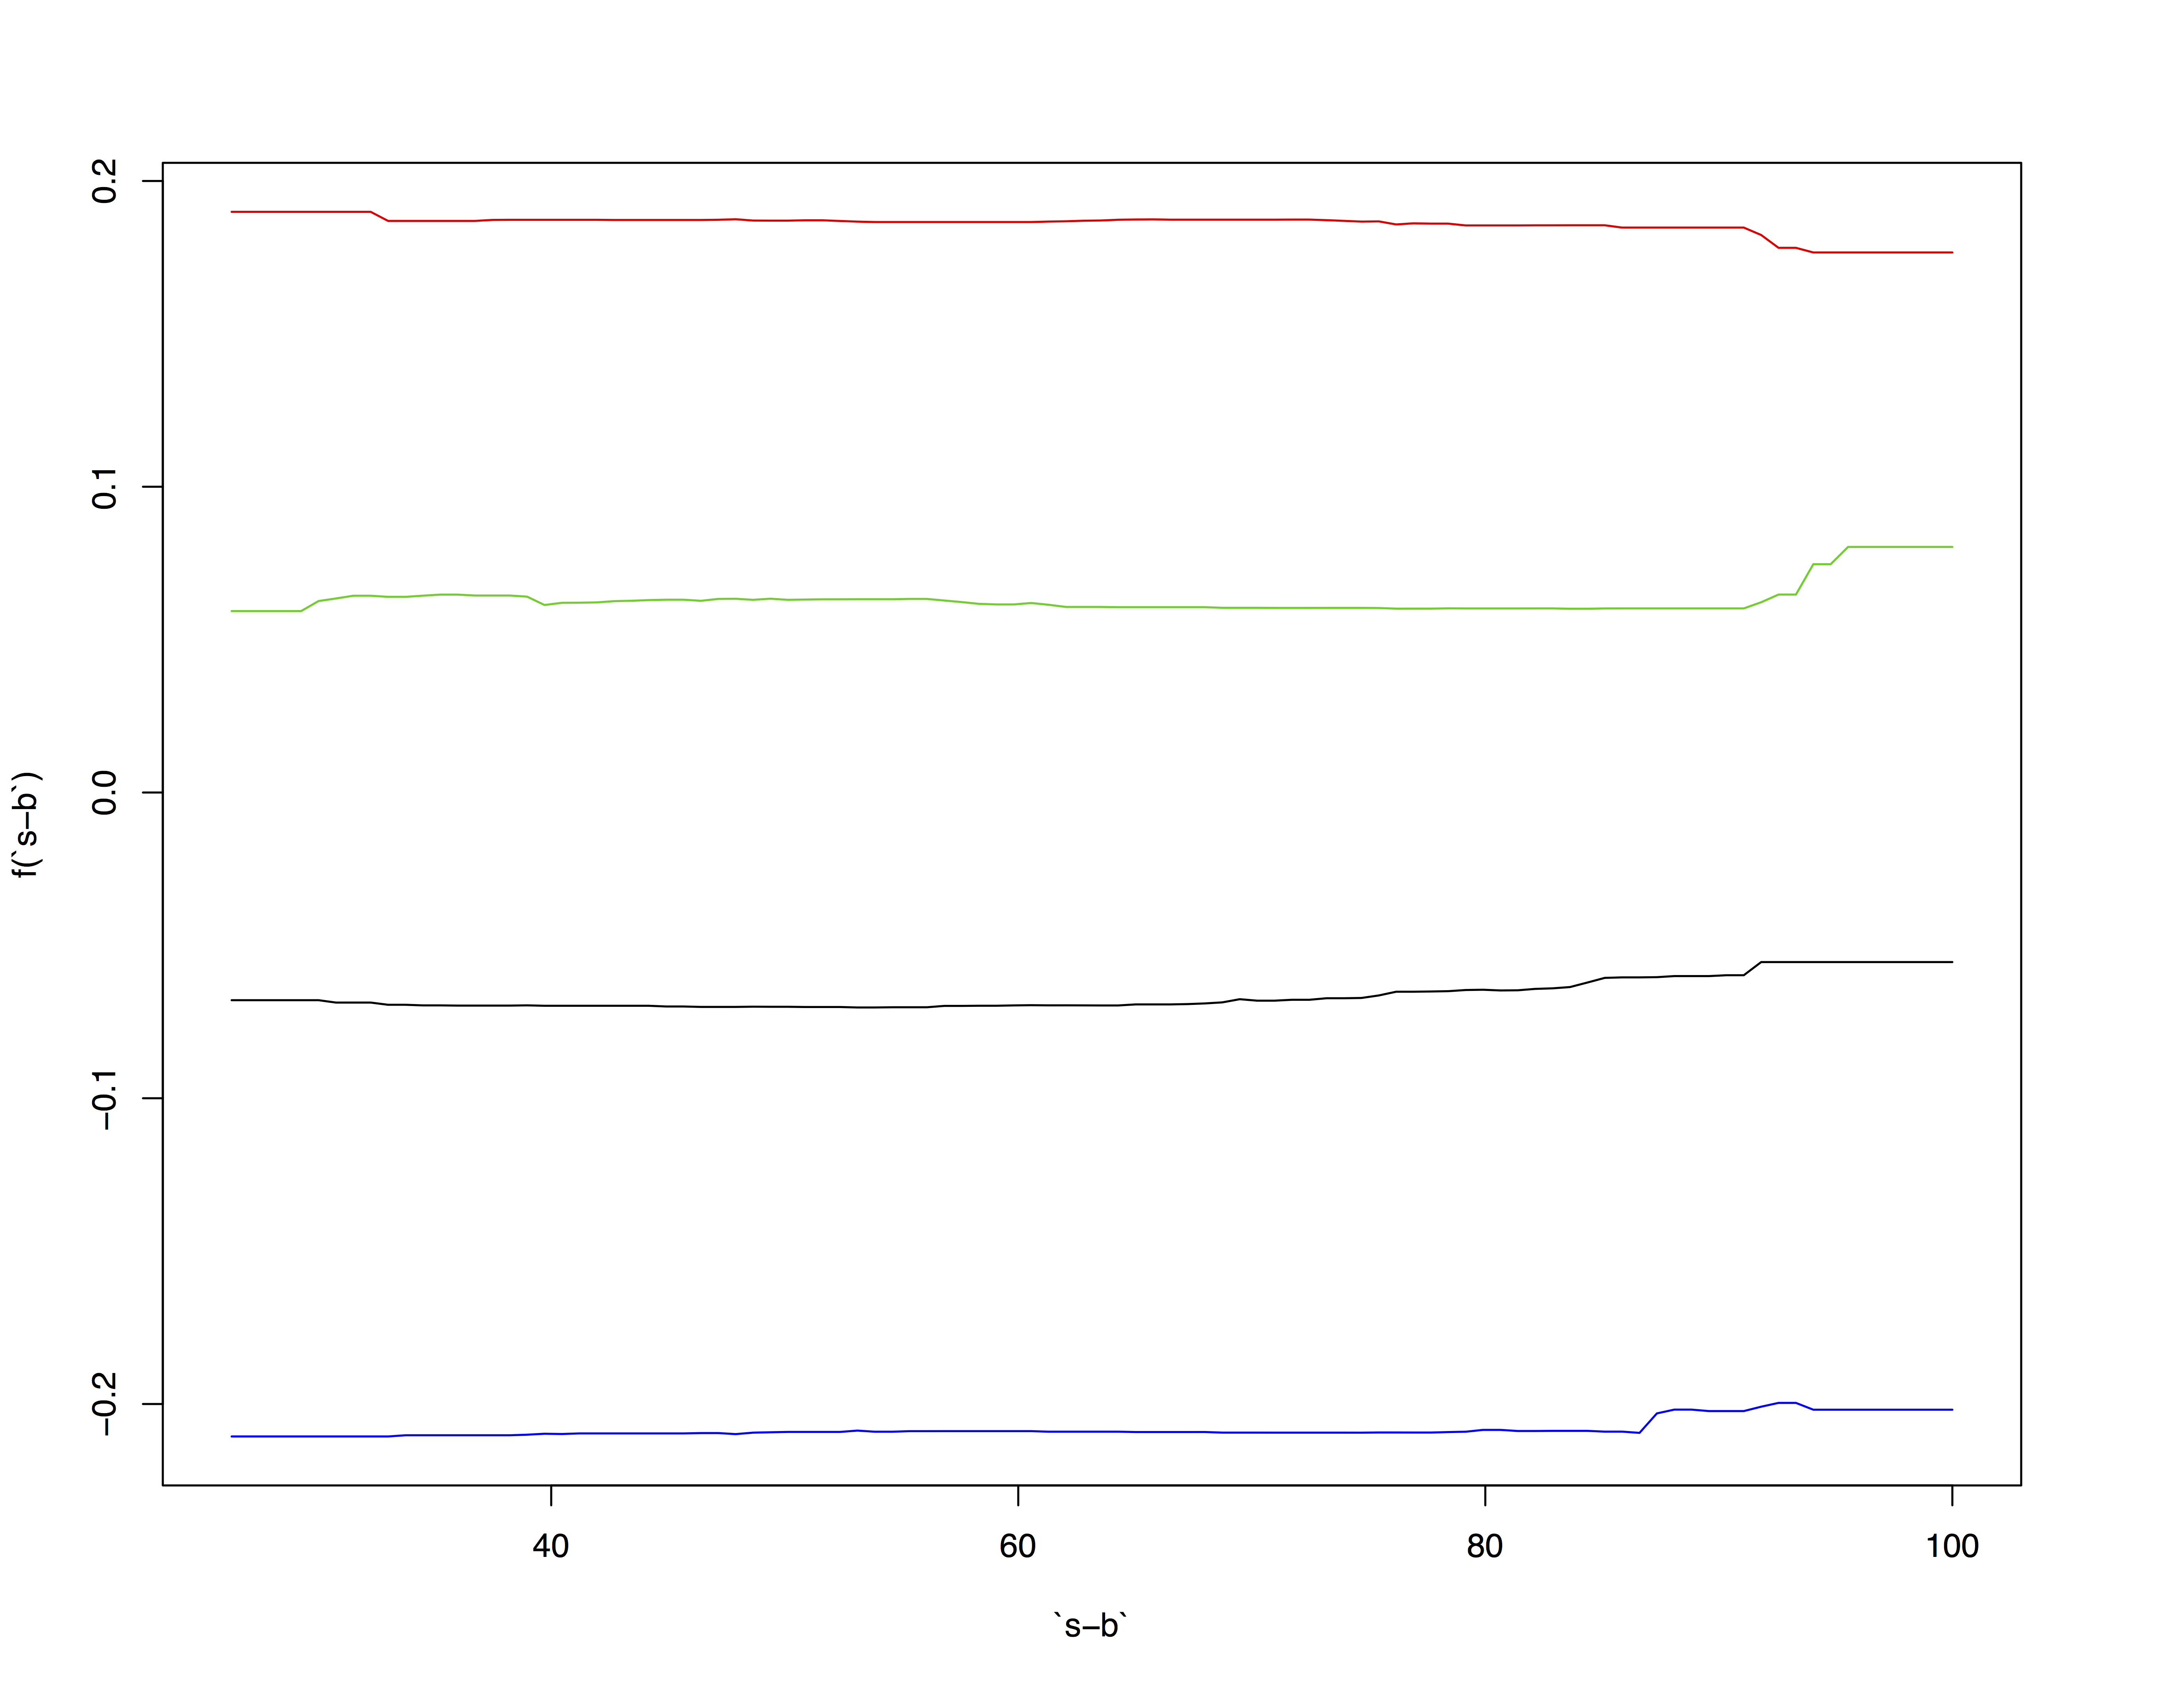
Silver-Bronze Difference
Inspiration
Vitech's Life Insurance challenge appealed to our group's interest in learning about data mining and machine learning.
What it does
A user inputs information such as their age, gender, height, weight and medical conditions into the web form, which will return a recommended plan for the consumer. We also created a document that has graphs and statistics that are useful for the life insurance company to understand their customers' purchasing habits.
How we built it
Using a Node.js application, we scraped Vitech's API to get data, which was parsed and stored in a CSV. This CSV was then imported into RStudio, where we used Generalized Boosted Regression (GBM) model to predict the insurance plan mostly likely to be purchased by a particular customer. The web form was built using Shiny, a web framework for R projects.
Challenges we ran into
- Getting the data from the API was a struggle due to the slow Internet speeds
- Figuring out how to use RStudio and Shiny
Accomplishments that we're proud of
- Learning how to do basic data mining and classification with RStudio
- Brainstorming how to parse complex data for information that produced useful models
What we learned
- Data mining and machine learning is hard
- Need to think deeply about data and continuously iterate on new information to draw out insights
Built With
- csv
- excel
- javascript
- node.js
- r
- rstudio
- shiny

Log in or sign up for Devpost to join the conversation.