-
-
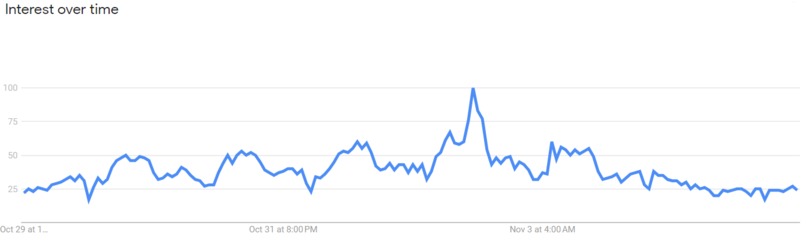
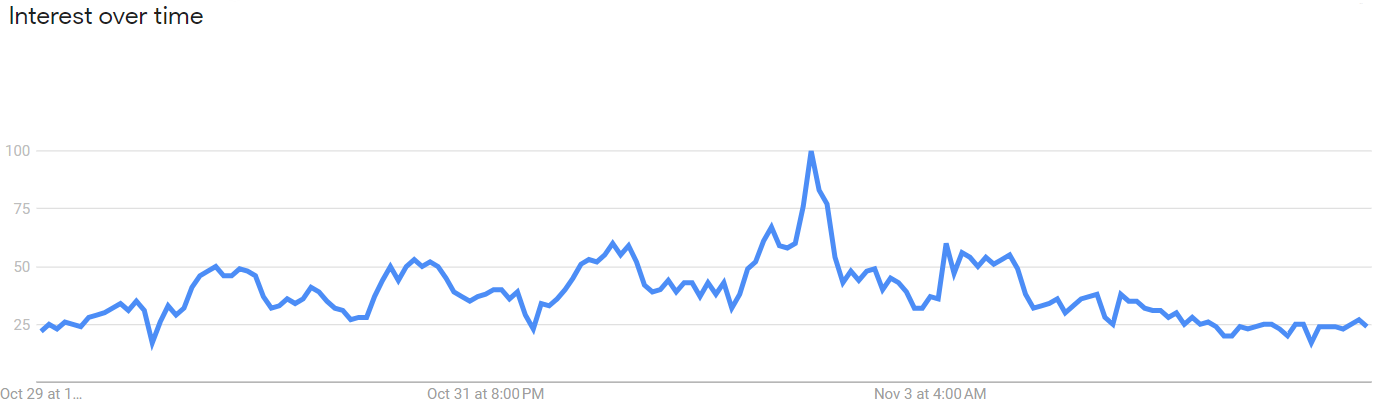
Trend analysis for goldman Sachs
-
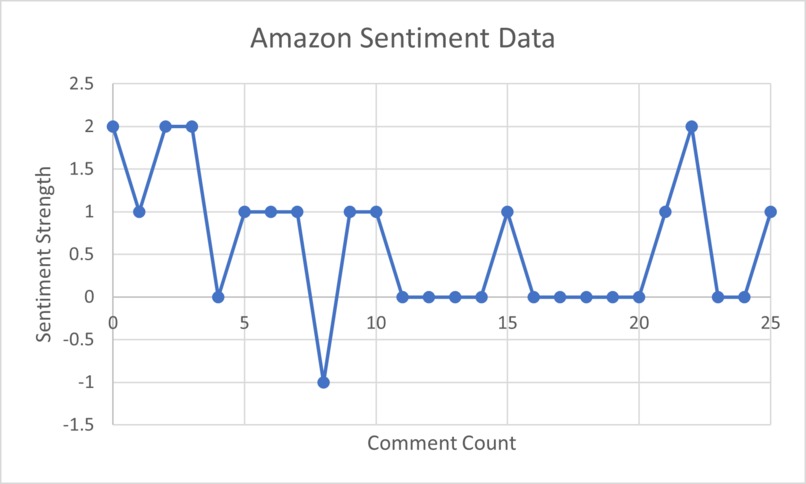
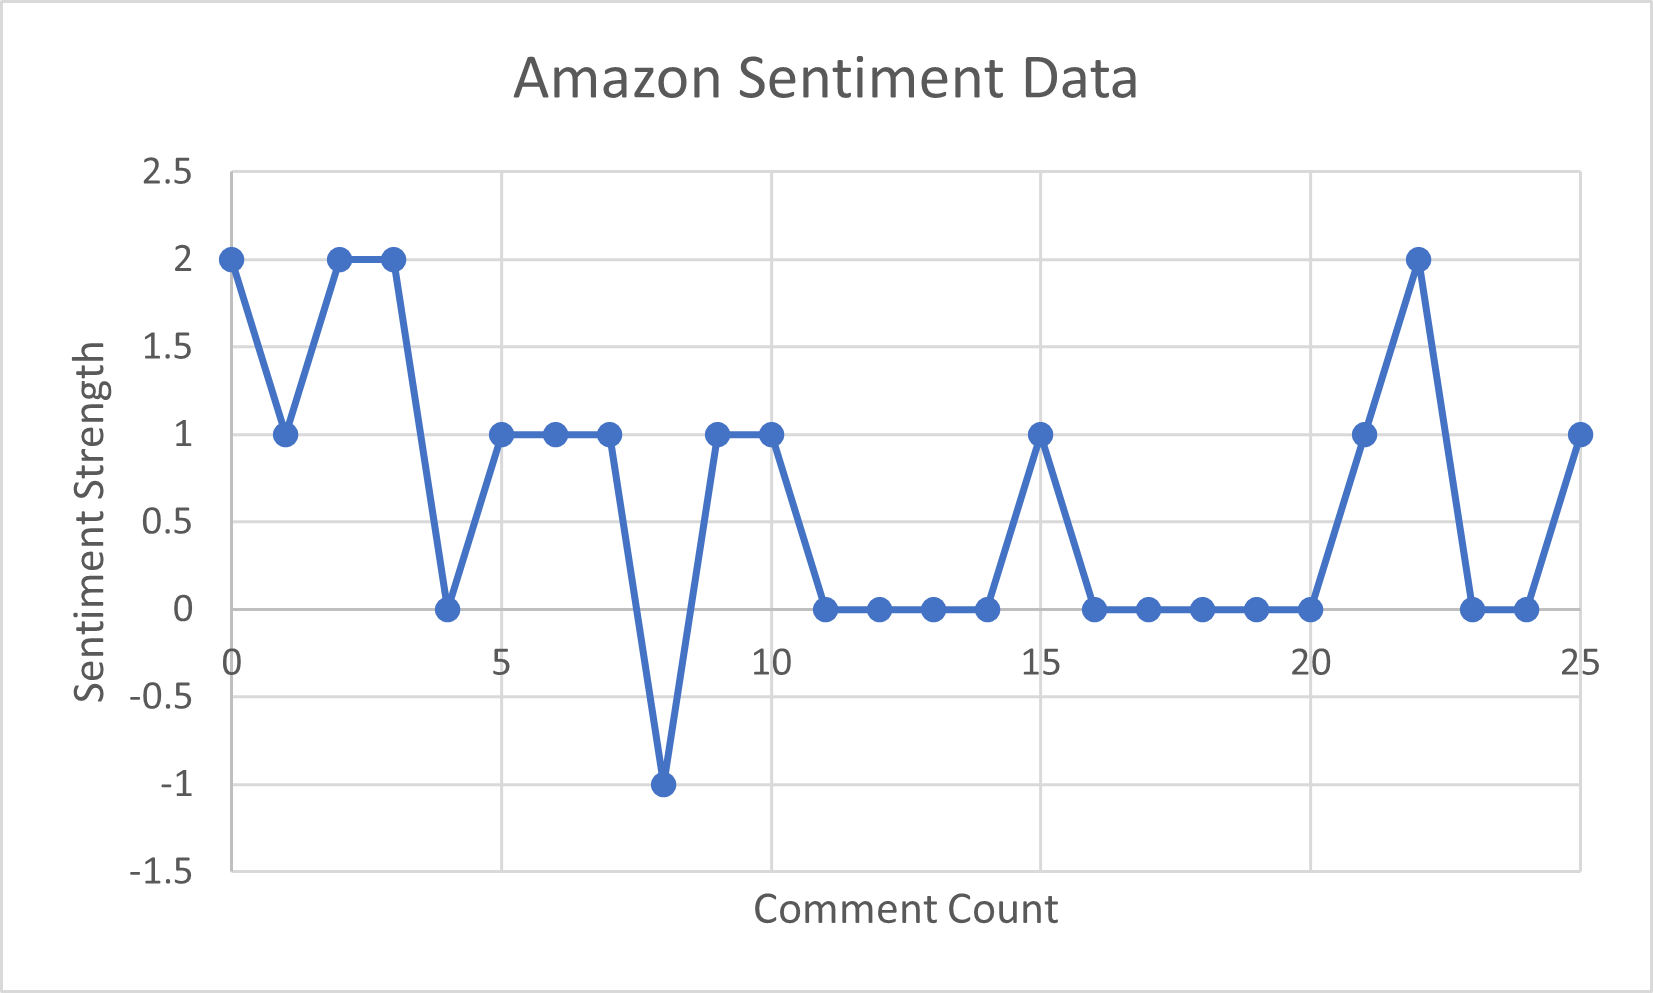
Sentiment analysis for Amazon
-
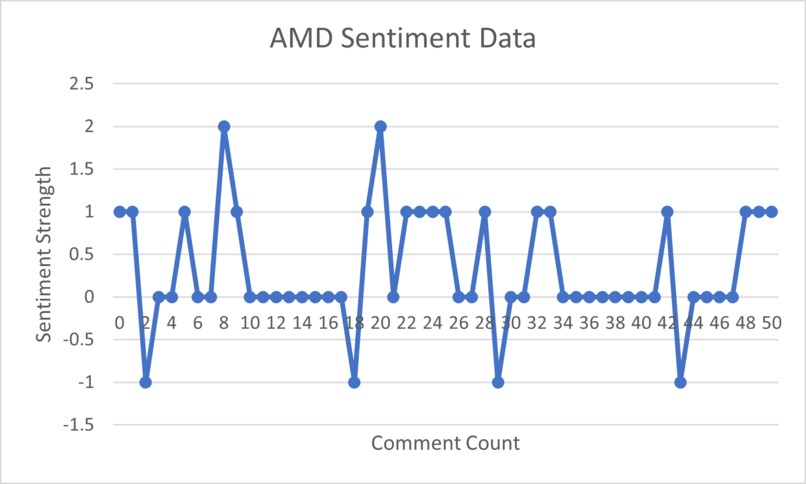
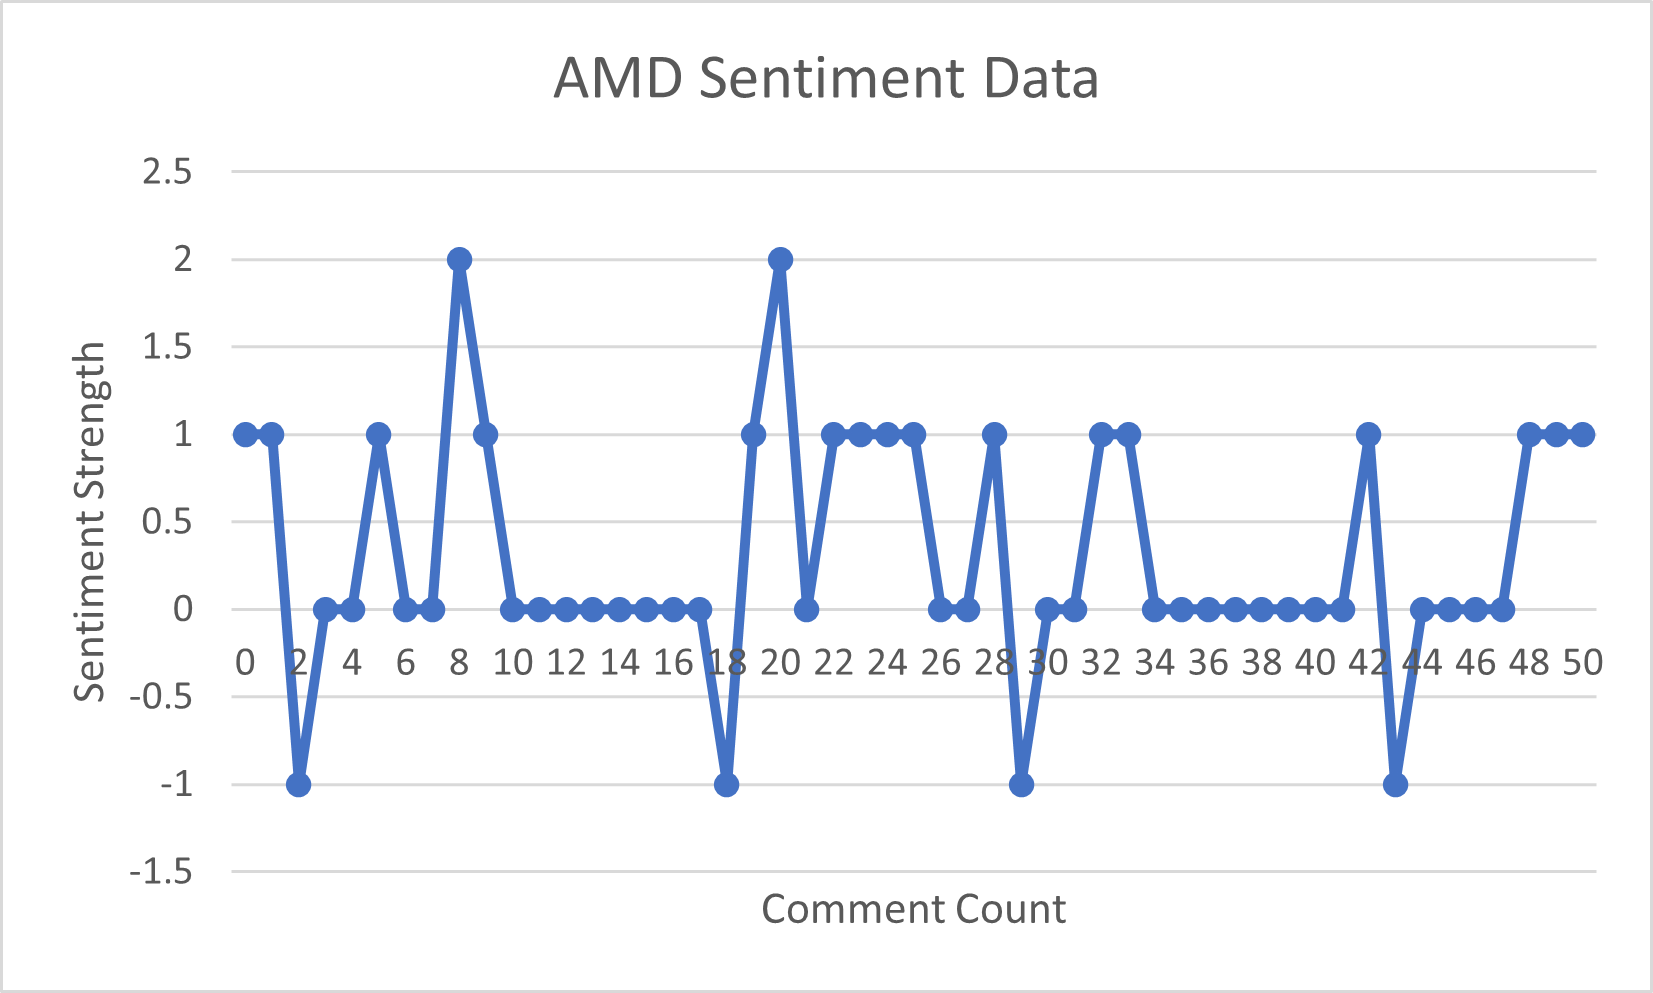
Sentiment analysis for AMD
-
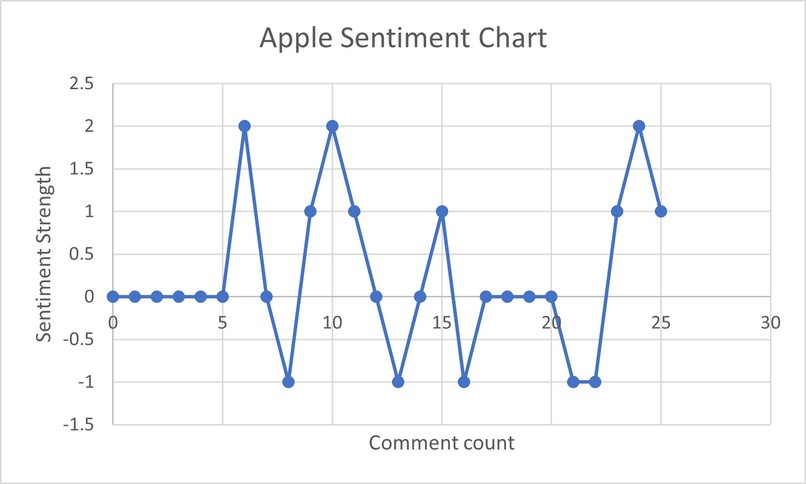
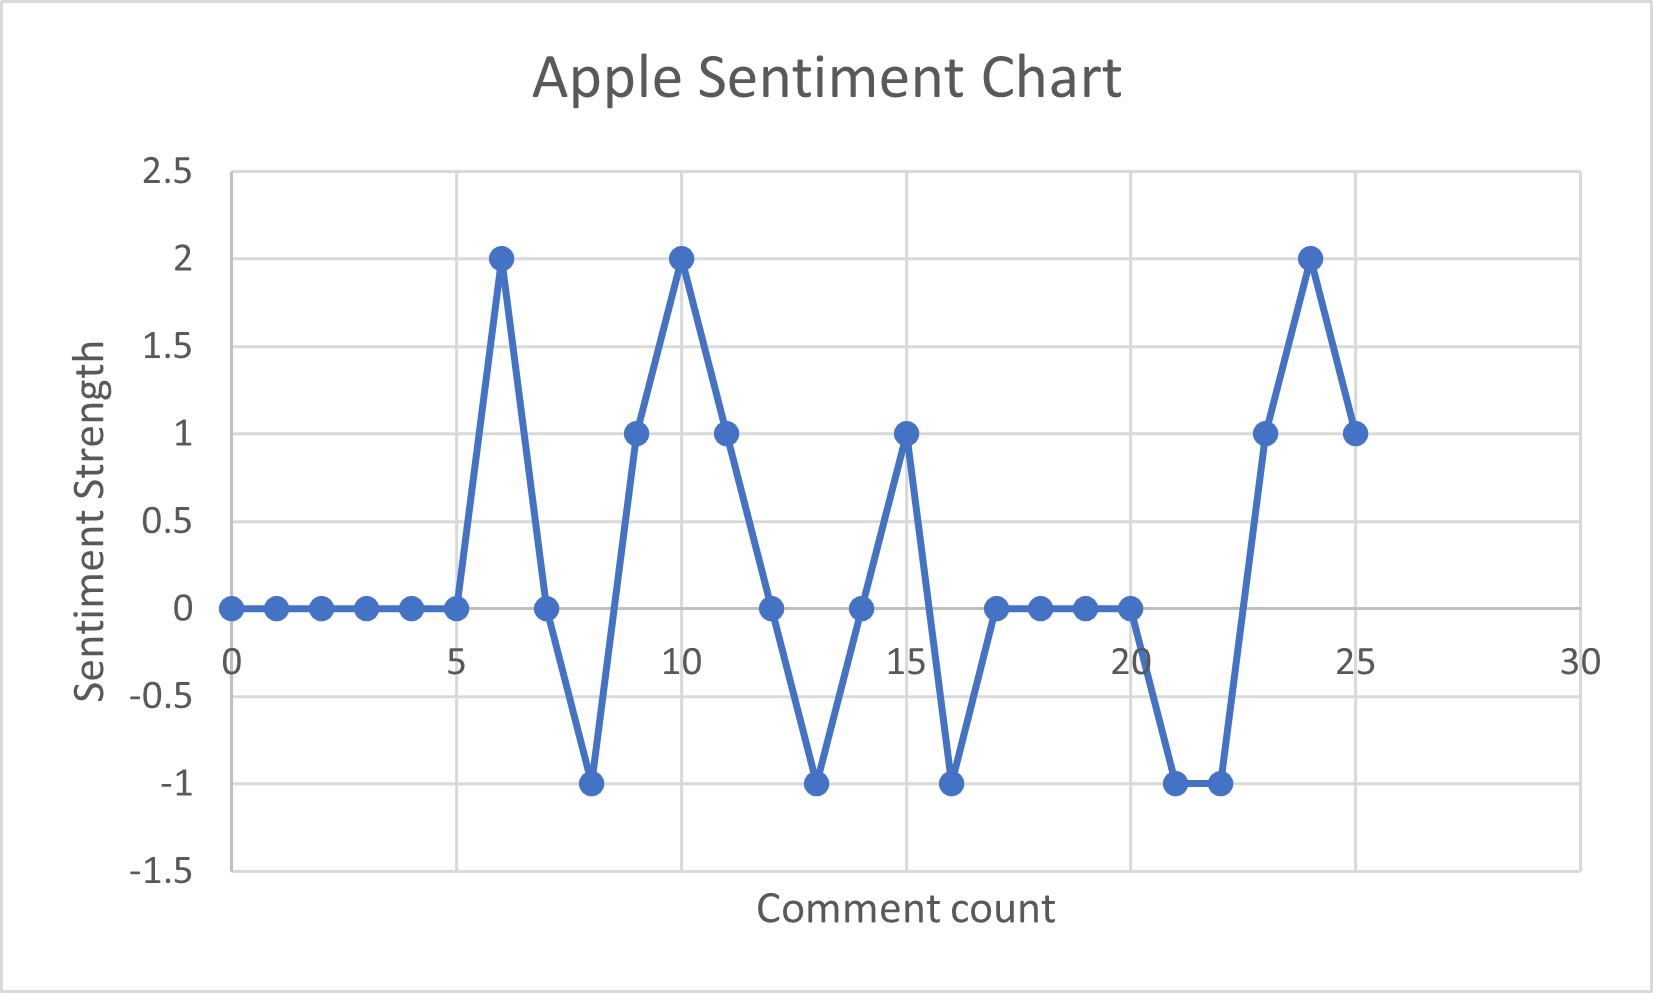
Sentiment analysis for apple
HackUTD-2023-Project
FinPredict - AI-based Algorithmic Earnings Forecasting
What Inspired Us: We were inspired by the potential of AI to revolutionize financial forecasting, using open-source models and alternative data sources to make more accurate predictions. The opportunity to combine technology and finance motivated our project.
What We Learned: Throughout the project, we gained a deep understanding of sentiment analysis, machine learning, and data scraping techniques. We also learned to collaborate effectively as a team, turning diverse skills into a cohesive project.
How We Built Our Project: Our project was built using a combination of Python libraries and APIs, including VaderSentiment, Matplotlib, BeautifulSoup, and GNews. We integrated sentiment analysis, real-time data, and Google Trends to develop a comprehensive AI-based forecasting tool.
Challenges We Faced: The main challenges revolved around data quality and accuracy. Integrating and cleaning data from various sources while maintaining model consistency presented difficulties. Additionally, optimizing the AI algorithms for faster performance was a persistent challenge.
Challenge Question: AI-based Algorithmic Earnings Forecasting
Challenge: Develop an AI application that leverages the power of open-source generative AI models, natural language processing, sentiment analysis using NLP, and machine learning for financial forecasting. Utilize alternative data sources such as news sentiment and social media trends to predict company earnings and financial performance.
Project Description
FinPredict: Leveraging sentiment analysis, real-time data, and the Google Trends API for actionable insights. Analyzing news sentiment, social media trends, and search peaks on Google Trends to predict company earnings and financial performance. The value of a business can be noticeably impacted whenever a document, a dramatic event, or even a press note is released. Regardless of the connotation, whether positive or negative, it is important to notice how it affects the popularity and overall external reviews on a company.
Features and Technologies Used
Sentiment Analysis
- Utilize VaderSentiment for sentiment analysis, with a focus on news sentiment and social media trends, and employ NLP and correlation analysis to gauge market sentiment effectively.
- VanderSentiment will process a user-defined data set and be trained in order to assign a numerical weight for the purpose of binary encoding words into a 'score' system to base off of the popularity for the company mentioned.
Advanced Regression Models
- Utilize VaderSentiment to process NLP and correlation analysis effectively, and analyze textual data to provide the foundation for predictive insights.
- Every comment acquired by accessing the name of a company in a post made on a finance forum. Using categorical encoding, positive, negative, and neutral keywords will map values of 1, -1, and 0 reespectively in order to have weigths to plot.
Real-time Data and Financial Events
- Access real-time financial and economic data, keeping a watchful eye on critical financial events that influence market dynamics.
Visualization with Matplotlib
- Create visually appealing plots and graphs to gain deeper insights into sentiment trends and market behaviors.
- After cleansing the data, we had to come up with a simple yet professional visualization system.
Data Scraping with BeautifulSoup
- Utilize BeautifulSoup to scrape data from various sources, enhancing our dataset for analysis.
- Using the Reddit API, and the most up-to-date web traffic resources from Google Trends, we were able to map, categorize, and display forum sentiments on the chart as a numerical representation.
Data Manipulation with Pandas and NumPy
- Efficiently process and manipulate financial data, ensuring its readiness for analysis.
- All graphs and csv files were created from scratch using data cleansing and data analytics.
News Aggregation via GNews API
- Leverage the GNews API to aggregate and analyze news data, offering real-world context for our predictions.
Google Trends Analysis
- Utilize the Google Trends API to identify key times with search peaks.
- Enhance analysis during these critical periods by incorporating data from news sources.
- We incorporated data collection on a 7-day timeframe in order to get the most recent web traffic data to also limit the number of events that prompted the web traffic changes.
User Friendly Interface via HTML, CSS, and Javascript
- Display visually appealing graphs that are easy for the user to understand.
License
This project is licensed under the MIT License.

Log in or sign up for Devpost to join the conversation.