-
YEG Heat Map
Inspiration
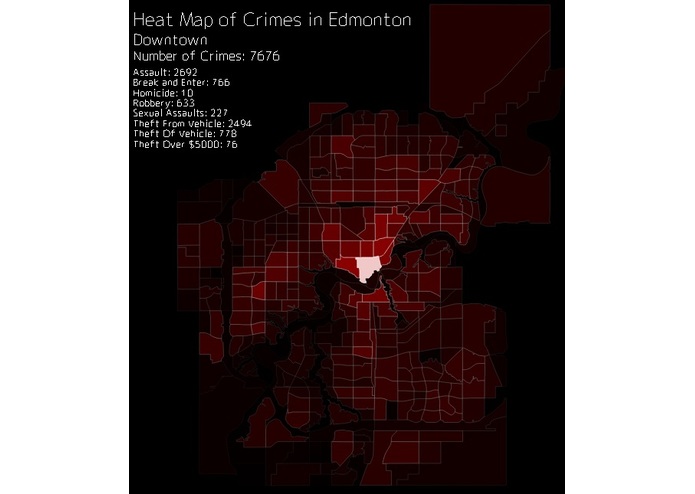
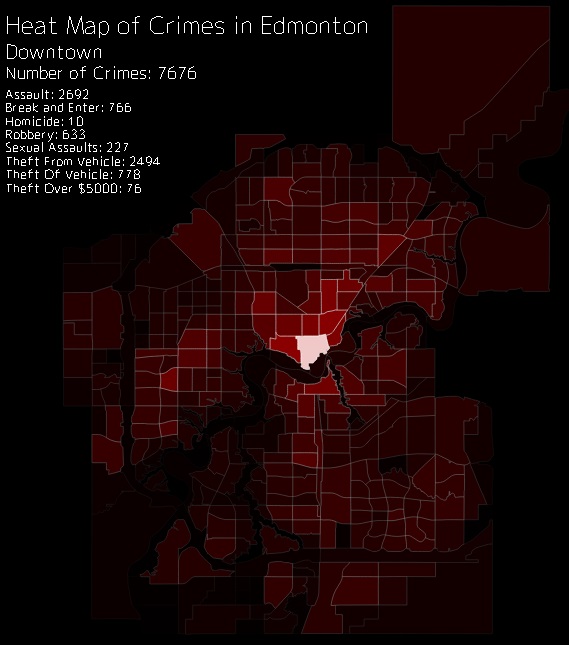
In an attempt to determine the most hood neighbourhood in all of YEG (and to learn data visualzation), we built a heat map!
What it does
Seperates the city of Edmonton based on its neighbourhood borders and creates a heat map of total crimes committed in each neighbourhood from 2009 until now.
How I built it
Using data from the Edmonton Open Data Portal, we were able to extract the information necessary for our heat map. With d3.js, we projected a geojson map of Edmonton (also from the Open Data Portal), while adding the data of each neighbourhood to the map.

Log in or sign up for Devpost to join the conversation.