-
-
dashboard
-
-
-
-
-


Inspiration
The core inspiration behind IntellectiQ Market, is to democratize the power of sophisticated data analysis for organizations and individuals dedicated to creating a better world.
Imagine a small non-profit, a local community initiative, or a social enterprise. Historically, deep market research, understanding public sentiment at scale, identifying emerging social trends, or forecasting needs might have been out of reach due to cost or complexity.
IntellectiQ Market aims to change that. Our inspiration is to provide these vital actors with:
A Louder Voice for the Underserved: By enabling them to use web scraping and sentiment analysis to understand public discourse, pinpoint community needs, and gauge reactions to social campaigns, ensuring their efforts resonate and address real concerns. Smarter Resource Allocation: By using trend analysis and forecasting to anticipate shifts in social needs, donor behavior, or the impact of public health initiatives, allowing for more proactive and efficient deployment of limited resources. Deeper Understanding of Complex Issues: By leveraging topic modeling on public feedback, news articles, or research papers to uncover hidden themes and narratives around critical social issues like climate change, public health, education, or inequality. Evidence-Based Advocacy: By equipping them with tools to segment populations, understand diverse perspectives, and present data-backed arguments to policymakers and funders, strengthening their case for positive change. Ultimately, the inspiration is to level the playing field, providing powerful, AI-driven insights that can help those working on the front lines of social progress to make more informed decisions, amplify their impact, and build a more equitable and sustainable future for all
What it does
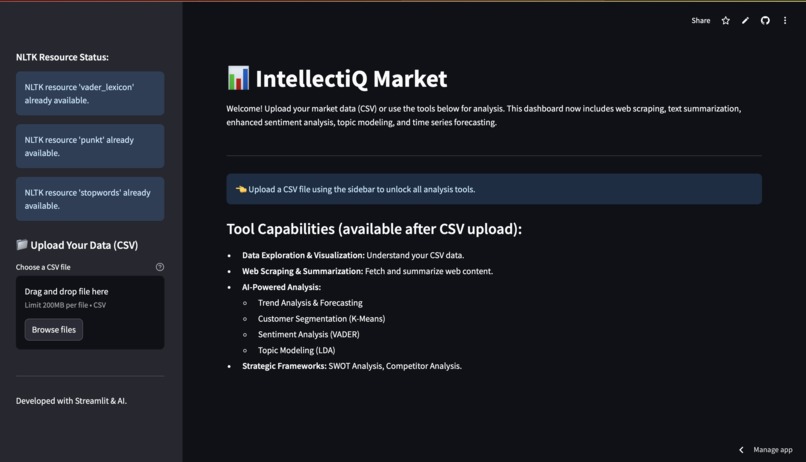
IntellectiQ Market creates a comprehensive Market Research & AI Analysis Dashboard using the Streamlit library. It's designed to help users analyze market data, gather external information, and apply AI techniques for insights.
Here's a breakdown of what it does:
Core Functionality: Interactive Web Application
It uses streamlit to build a web-based user interface, making it accessible through a browser. The page is configured with a title "Market Research & Analysis Tool", an icon, and a wide layout. Data Input:
CSV Upload: Users can upload their own market data in CSV format via a sidebar uploader. The script attempts to read the CSV using various common encodings (utf-8, latin1, etc.) to handle different file types. Data Exploration & Visualization (if CSV is uploaded):
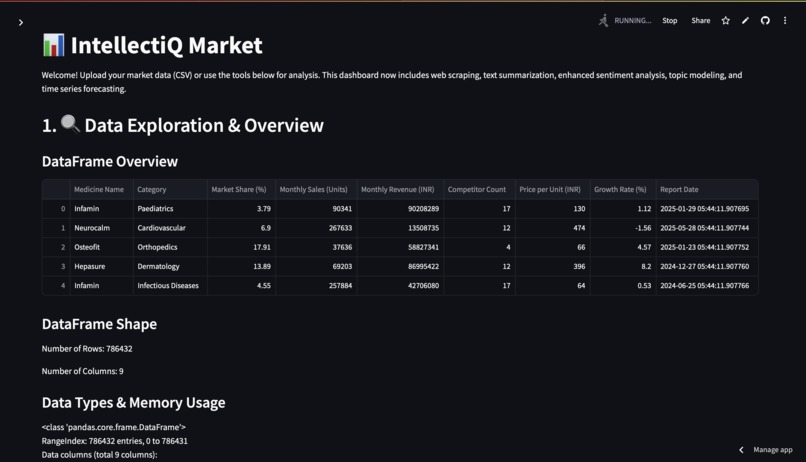
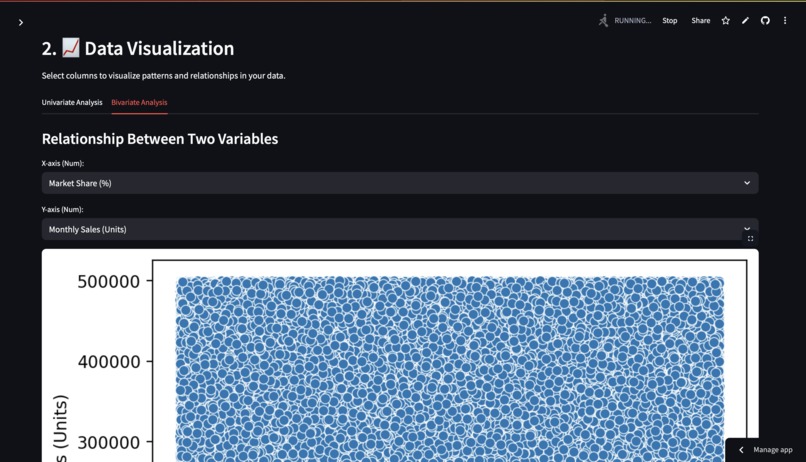
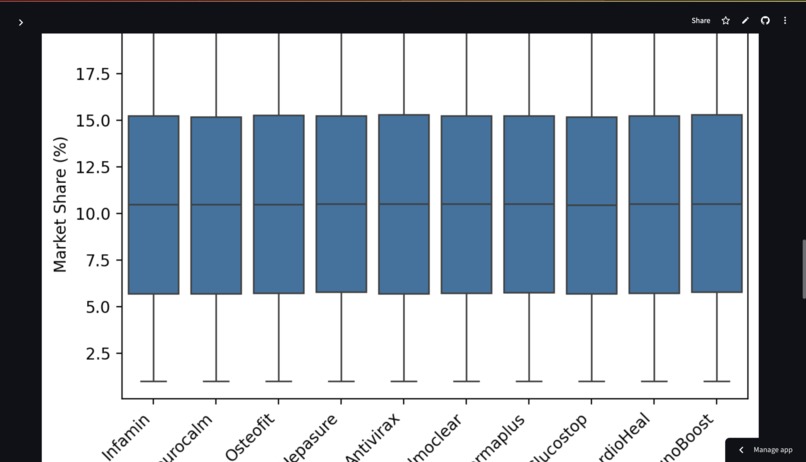
DataFrame Overview: Displays the first few rows, shape (rows, columns), data types, memory usage, descriptive statistics (for numerical and categorical data), and a summary of missing values. Data Visualization: Univariate Analysis: Allows users to generate histograms for selected numerical columns and bar charts for selected categorical columns (showing top 10 values). Bivariate Analysis: Enables scatter plots for two numerical columns and box plots for a numerical column grouped by a categorical column. Web Scraping & External Data Gathering:
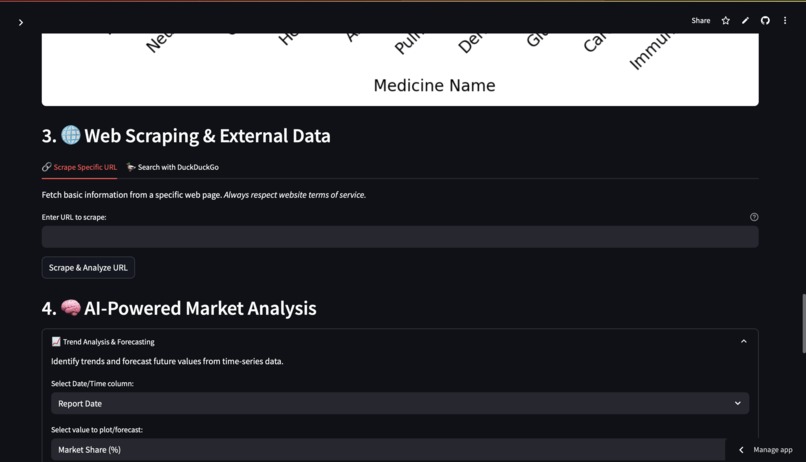
Scrape Specific URL: Users can input a URL. The tool fetches the webpage content (title, paragraphs) using requests and BeautifulSoup. It then displays the scraped title and a preview of the text. Basic Text Summarization: It summarizes the scraped text using a custom summarization function (based on sentence tokenization, stopword removal, and word frequency). Search with DuckDuckGo: Users can enter a search query. The tool uses the duckduckgo_search library to fetch search results. It displays the title, link, and snippet for each result. For each search result, there's an option to directly scrape and summarize its content. AI-Powered Market Analysis Modules:
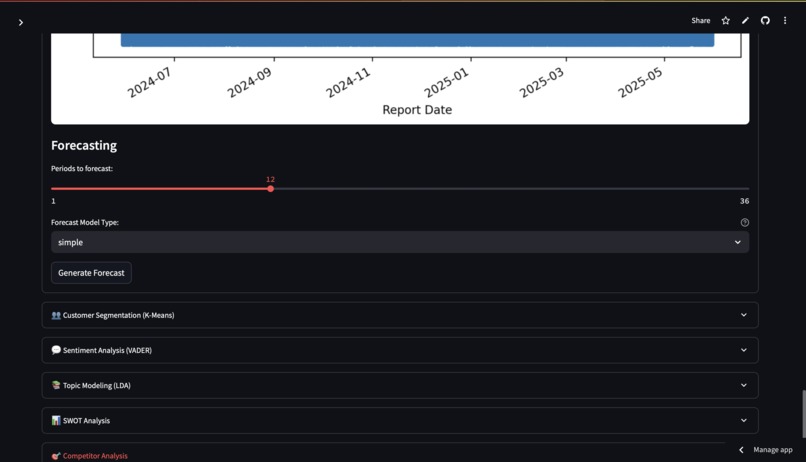
Trend Analysis & Forecasting (requires CSV with date and numerical columns): Users select a date/time column and a numerical value column. The tool plots the time series. It performs forecasting using statsmodels Exponential Smoothing (Simple, Additive, or Multiplicative models, with automatic or custom seasonal period detection). The forecast is plotted alongside the actual data, and forecasted values are displayed. Customer Segmentation (K-Means) (requires CSV with numerical columns): Users select multiple numerical features for clustering. It applies K-Means clustering (after scaling the data) to group similar data points (e.g., customers). The number of clusters (K) is user-configurable. Results are shown with a scatter plot (for the first two selected features) colored by cluster, and a table of cluster profiles (mean values of features for each cluster). Sentiment Analysis (VADER) (requires CSV with a text column): Users select a text column (e.g., customer reviews). It uses NLTK's VADER (Valence Aware Dictionary and sEntiment Reasoner) to analyze the sentiment (positive, negative, neutral) of each text entry. Displays the overall sentiment distribution as a pie chart. Shows summary statistics like average and median compound scores. Presents a sample of texts with their analyzed sentiment and scores. Topic Modeling (LDA) (requires CSV with a text column): Users select a text column. It uses Latent Dirichlet Allocation (LDA) with sklearn to discover underlying topics in the text data. Users can configure the number of topics and the number of top words per topic, as well as advanced parameters like max_df and min_df. The top words for each identified topic are displayed. Optionally, it shows the topic distribution for the first few documents. Strategic Frameworks (Manual Input):
SWOT Analysis: Provides text areas for users to manually input Strengths, Weaknesses, Opportunities, and Threats. Competitor Analysis: If a CSV is loaded, users can select columns relevant for competitor comparison, and the tool displays the head of that subset of data. Helper Functions & Setup:
NLTK Resource Management: Automatically checks for and downloads necessary NLTK resources (vader_lexicon, punkt, stopwords) on startup, displaying status messages in the sidebar. Caching: Uses st.cache_data and st.cache_resource to cache results of computationally expensive functions (like scraping, model loading, forecasting, topic modeling, search), improving performance on subsequent runs with the same inputs. Error Handling: Includes try-except blocks to gracefully handle potential errors during file processing, web scraping, and AI model execution, providing informative messages to the user.
How we built it
I built it using python as a core language and market research as core base knowing the problem every business owner faces due to which business owner with less experience feels it difficult to know what the market is demanding, we built it to solve their problem so that good ideas do not go to waste.
Challenges we ran into
RAM size and resource optimisation is the main challenge with the research done behind it.
Accomplishments that we're proud of
I am proud of helping the businesses to grow
What we learned
I learned many things new like detailed market research and aspects in it
What's next for IntellectiQ Market
enhancing its features like speed of processing and business oriented results also suggestions for businesses
Built With
- beautiful-soup
- matplotlib
- numpy
- pandas
- python
- scikit-learn
- stremlit

Log in or sign up for Devpost to join the conversation.