Inspiration
Natural disasters like earthquakes, floods, and fires have a profound impact on communities, yet there’s often a lack of accessible, visualized information to help people understand the risks in their region. We were inspired to build a tool that not only raises awareness but also provides real-time data to empower individuals and organizations to make better-informed decisions during critical times.
What it does
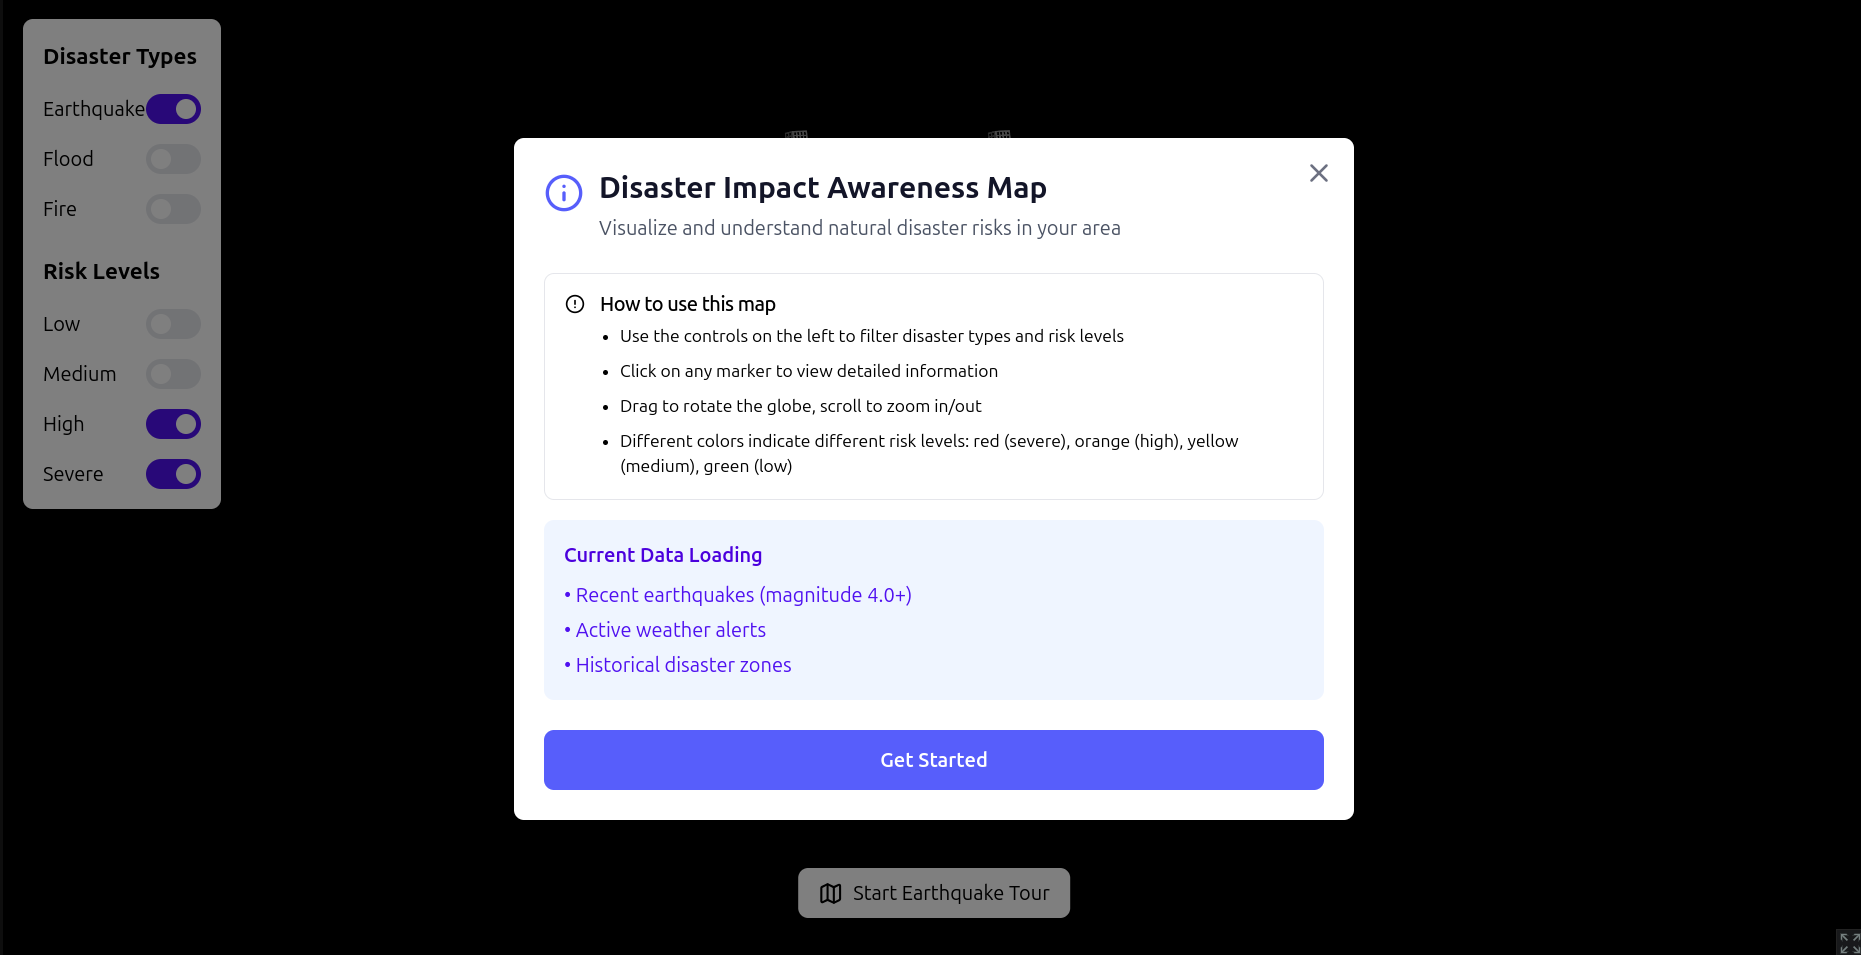
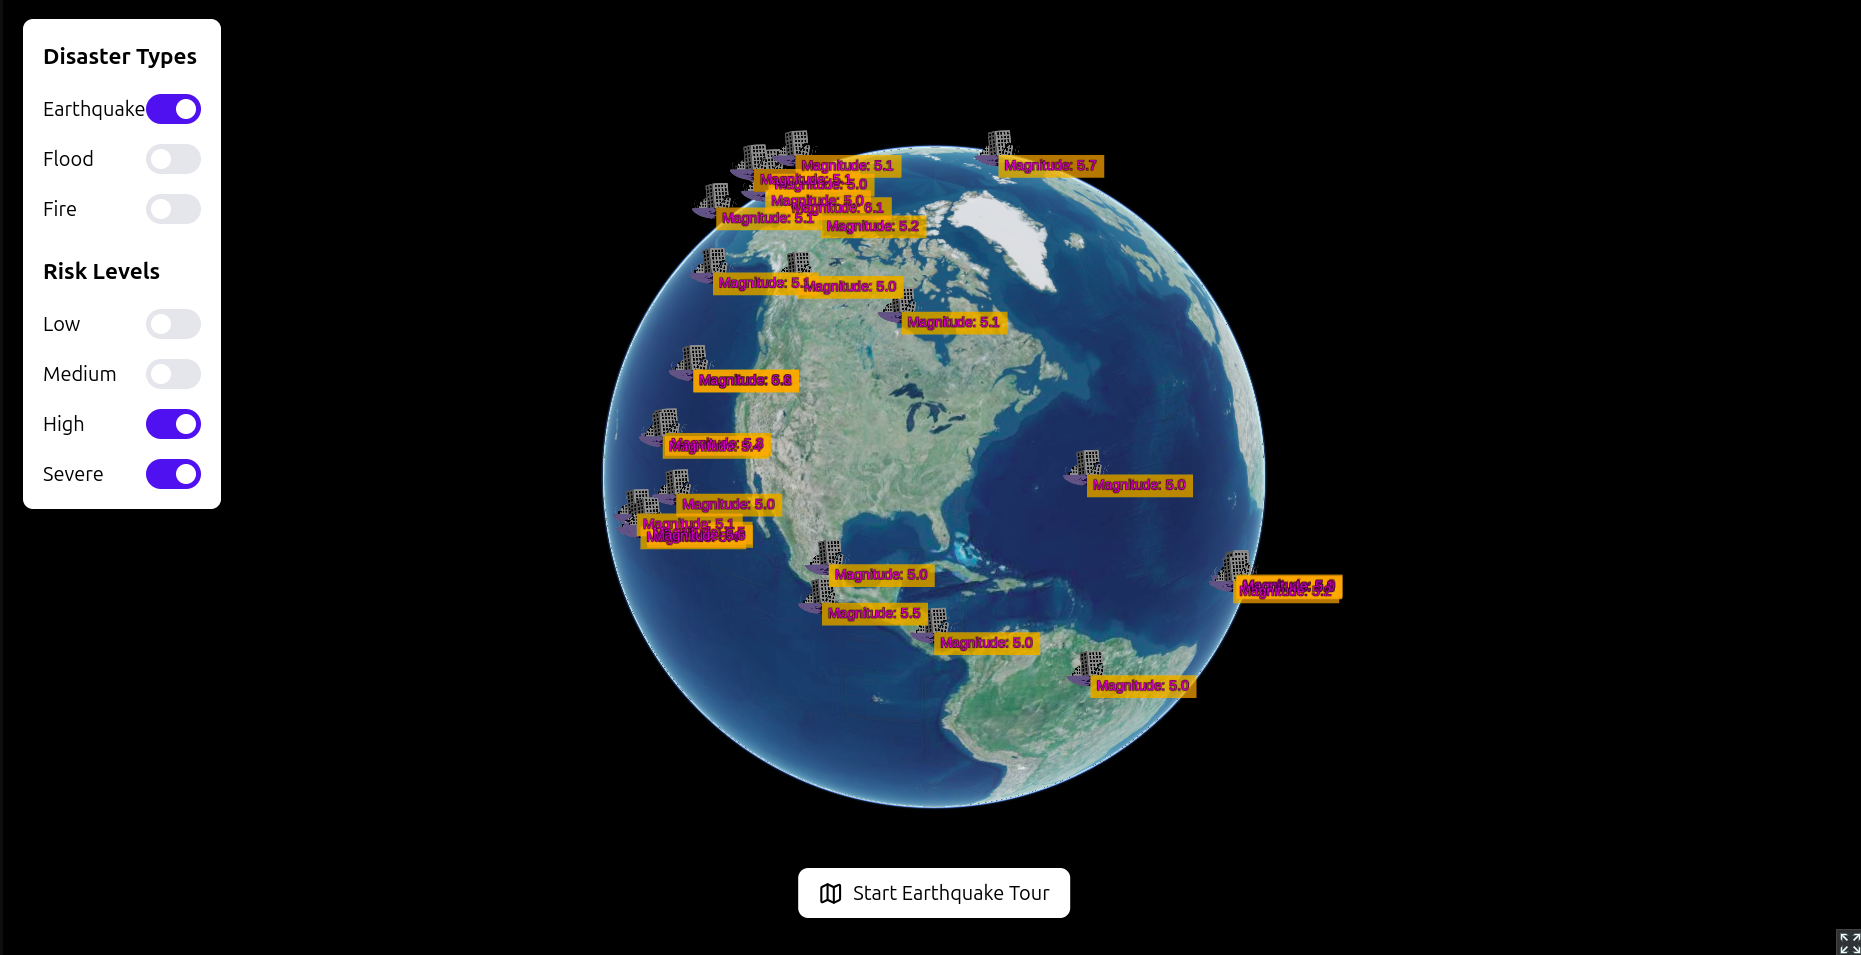
The Disaster Impact Awareness Map is a 3D interactive platform that allows users to visualize and explore natural disaster risks in their area. It provides:
- Real-time updates on recent earthquakes (magnitude 4.0+), wildfires, and floods.
- Risk levels categorized as low, medium, high, or severe.
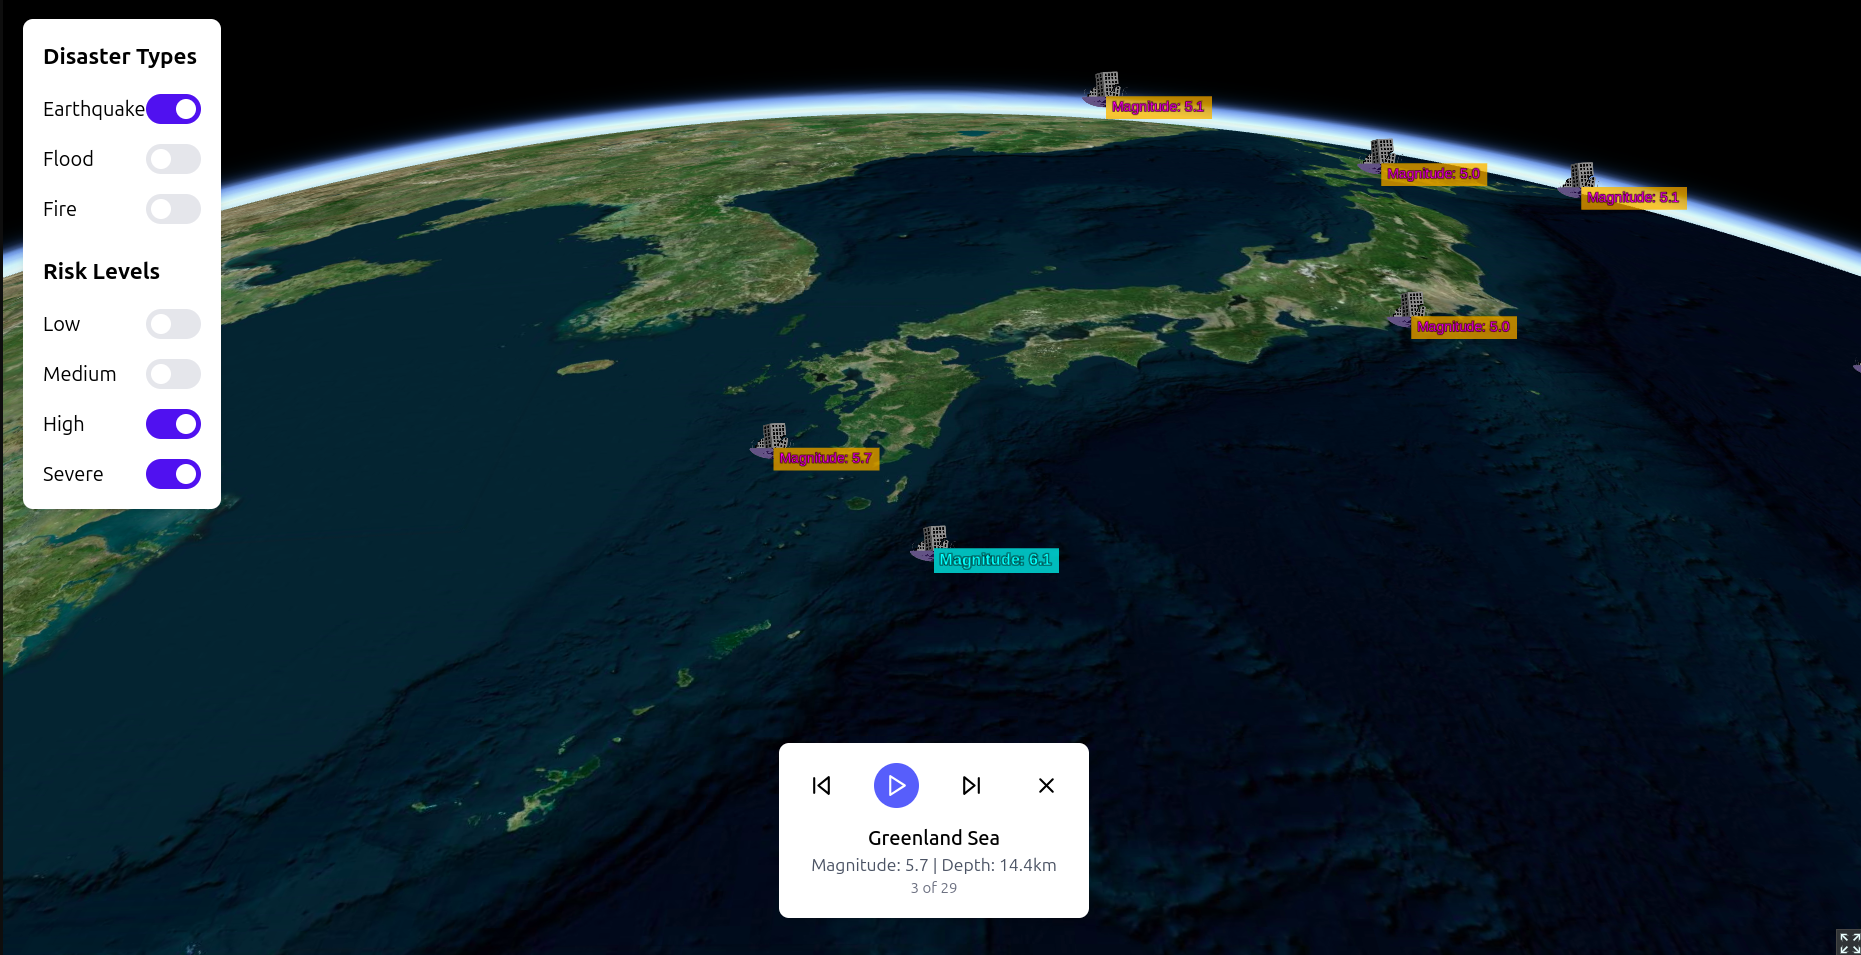
- Disaster markers with detailed data, including the severity, time, and location of the incident.
The tool enables users to filter data by disaster type and understand the geographical and environmental impact, helping them take informed safety measures.
How we built it
- CesiumJS for rendering a photorealistic 3D globe and integrating disaster overlays.
- React for building a user-friendly interface that facilitates seamless interaction with the map.
- APIs for fetching real-time disaster data, including earthquakes, wildfire locations, and flood reports.
The combination of CesiumJS’s powerful 3D capabilities and React’s dynamic interface allowed us to build an engaging, data-rich application.
Challenges we ran into
- Data integration: Integrating real-time data from APIs for floods, wildfires, and earthquakes required handling rate limits and converting inconsistent formats into a unified structure.
- 3D performance optimization: Rendering multiple real-time disaster overlays on the globe while maintaining smooth interactivity was a challenge, especially on less powerful devices.
- Data accuracy: Ensuring accurate visualization of disaster zones and defining thresholds for risk levels required extensive research and testing.
- User experience: Creating an intuitive yet powerful interface required iterative design improvements to balance complexity and simplicity.
Accomplishments that we're proud of
- Successfully integrated real-time data sources for multiple disaster types, ensuring users get the latest information.
- Developed a highly interactive 3D visualization using CesiumJS that enhances user engagement and understanding.
- Designed a clean, intuitive interface for filtering and exploring disaster data.
- Built a scalable platform that can be expanded with additional disaster types and advanced features.
What we learned
- Leveraging CesiumJS for rendering photorealistic 3D environments and handling geospatial data.
- Effective techniques for integrating and visualizing real-time data from diverse APIs.
- The importance of thoughtful user interface design in presenting complex information.
- Advanced methods for optimizing performance in 3D applications.
What's next for Disaster Impact Awareness Map
- Expanding disaster coverage to include tsunamis, hurricanes, and other events.
- Using machine learning for predictive analytics to forecast disaster risks based on historical data.
- Enhancing accessibility with features like voice navigation, offline maps, and mobile apps.
- Partnering with disaster response organizations to offer actionable recommendations to users in high-risk areas.
- Enabling community reporting to crowdsource disaster data for more localized and accurate updates.
Built With
- cesiumjs
- javascript
- react


Log in or sign up for Devpost to join the conversation.