Inspiration
Cities consume enormous amounts of energy, but how much of it is actually necessary? We wanted to explore how cities could track energy consumption, identify waste, and make smarter decisions to reduce it. We were inspired to build NightCity as a way to visualize energy usage across an entire city and demonstrate how proactive planning could prevent unnecessary energy consumption, especially during extreme weather.
What it does
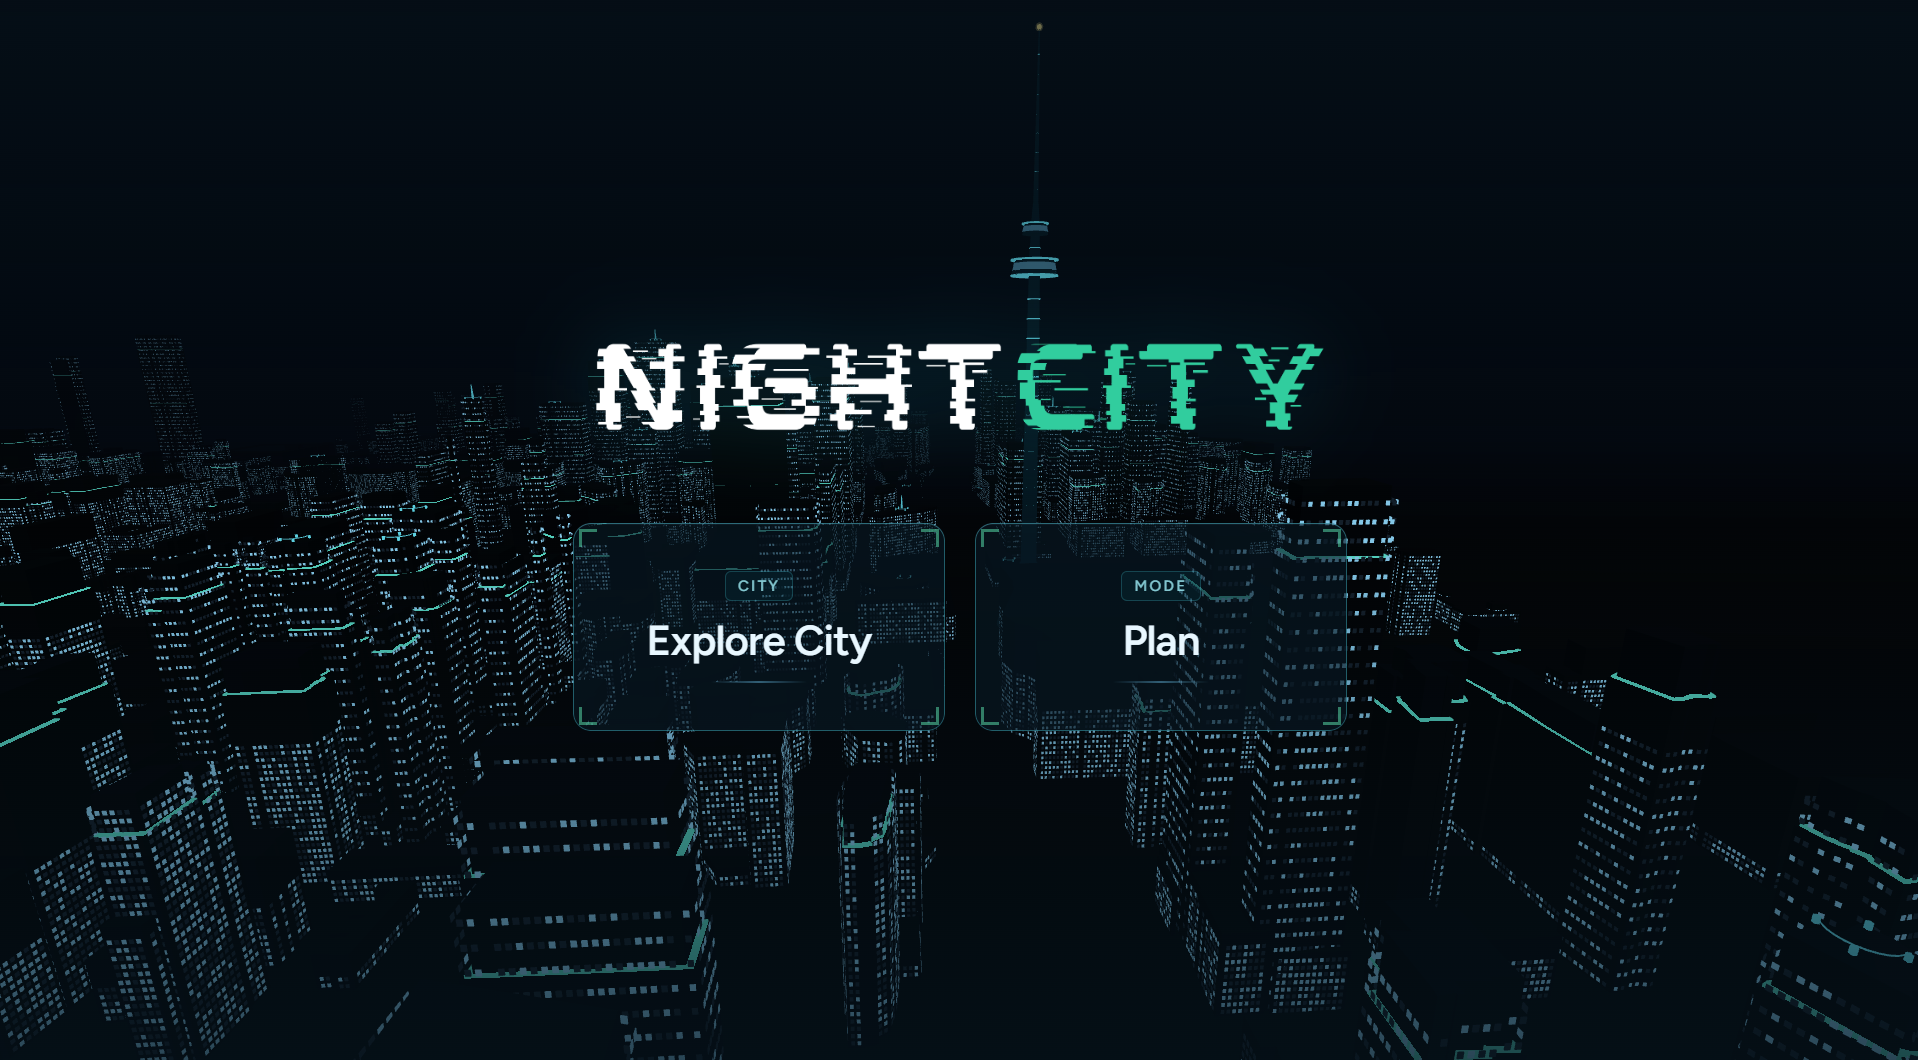
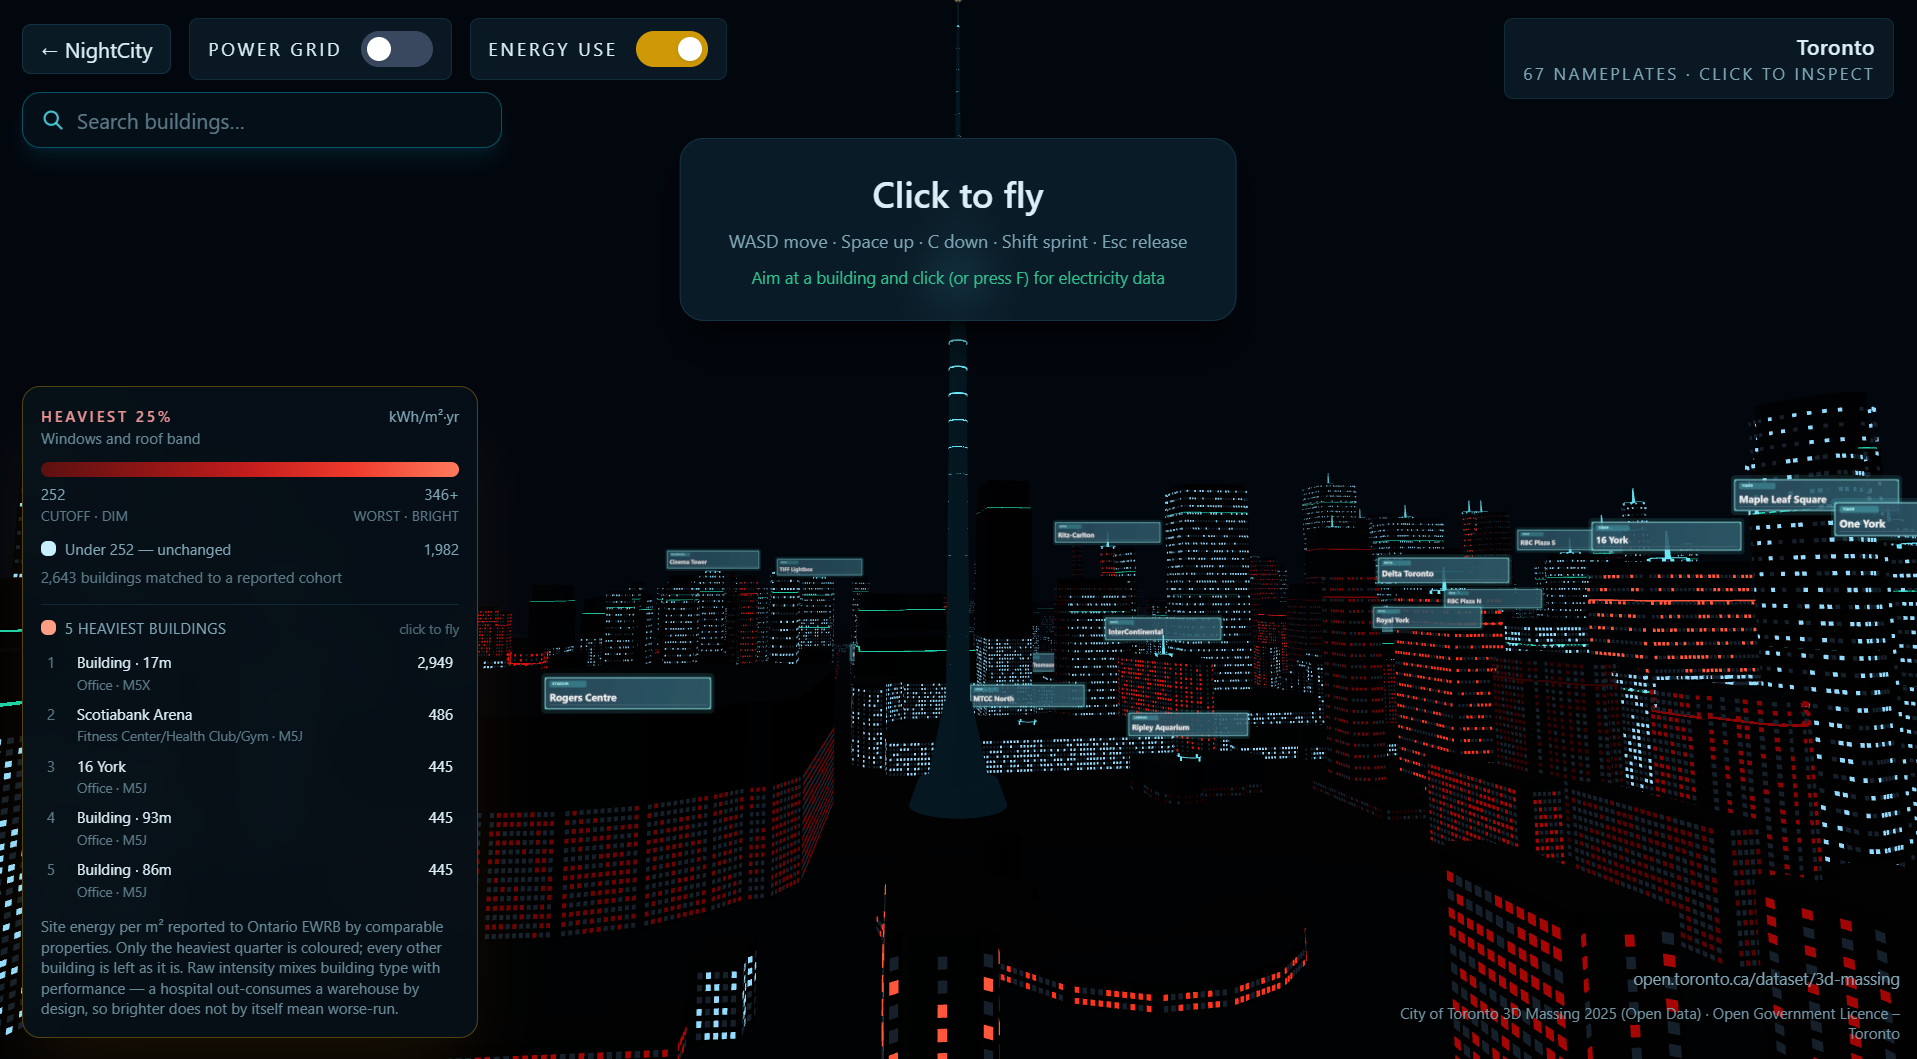
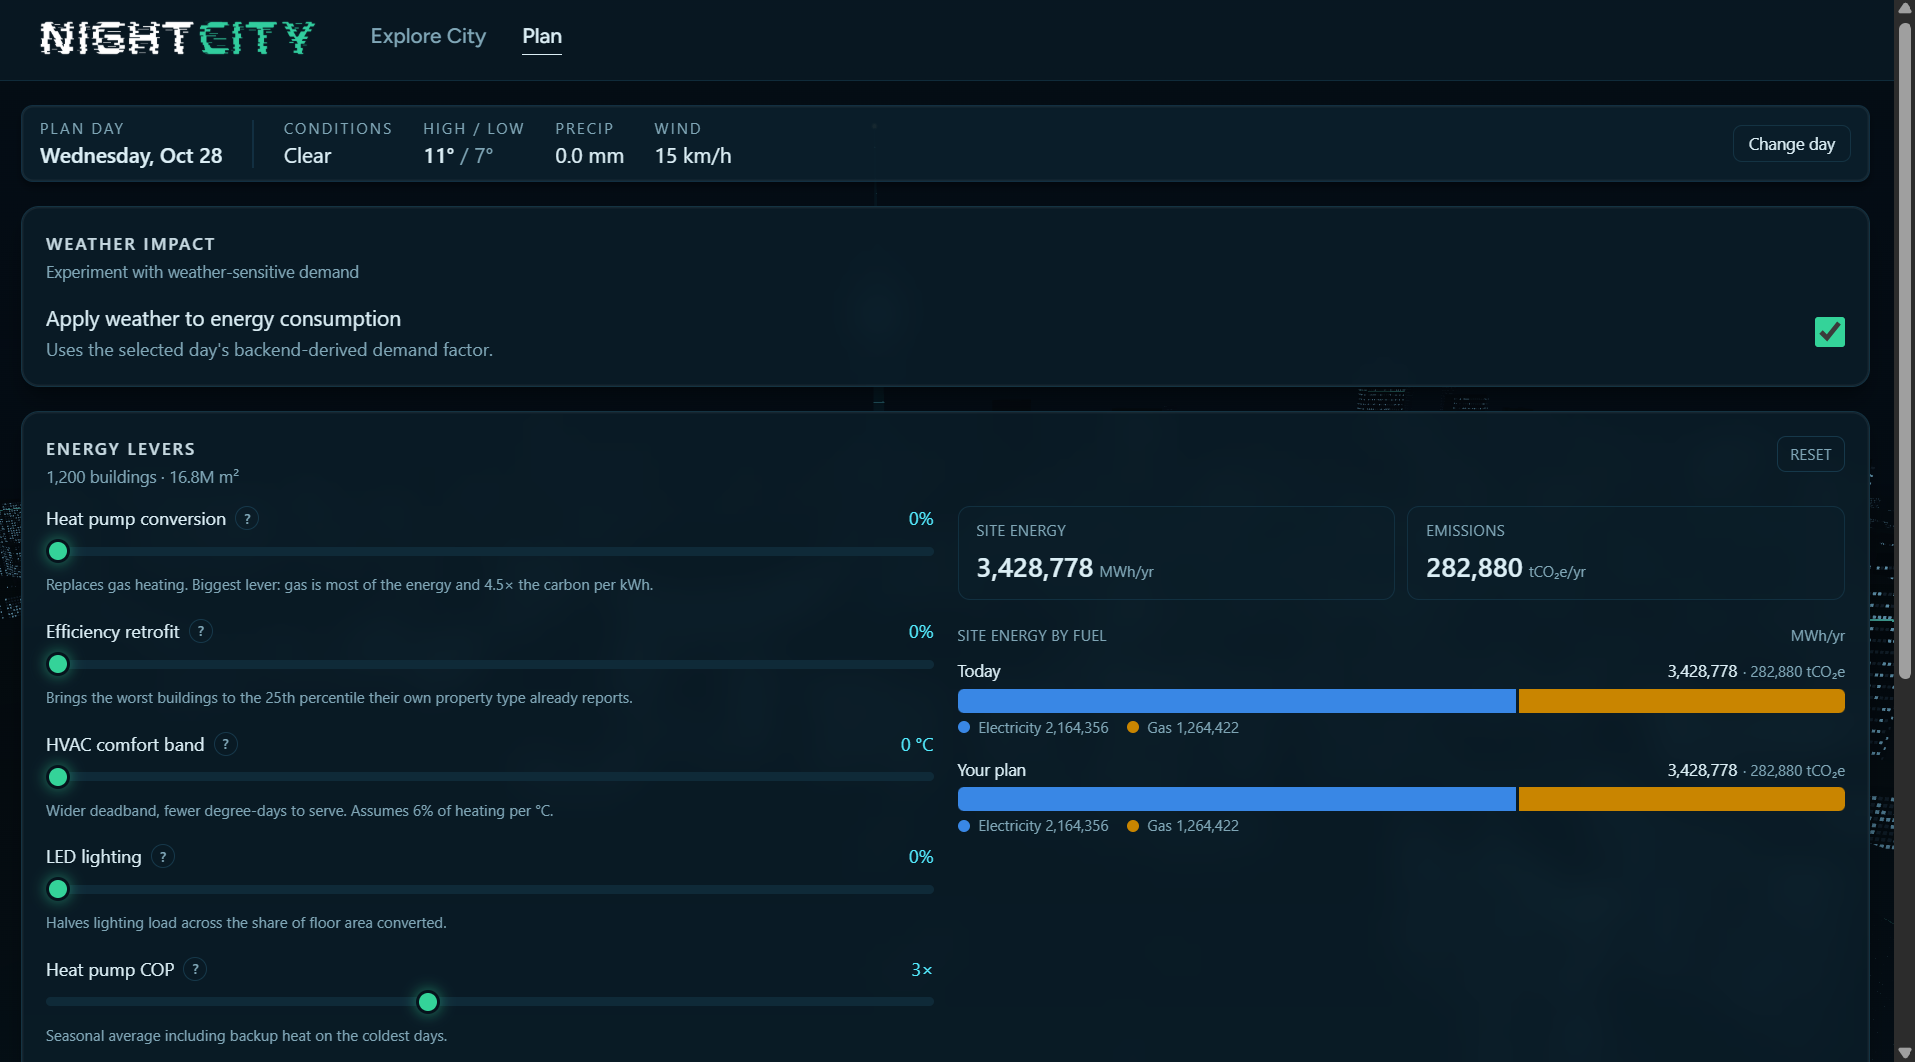
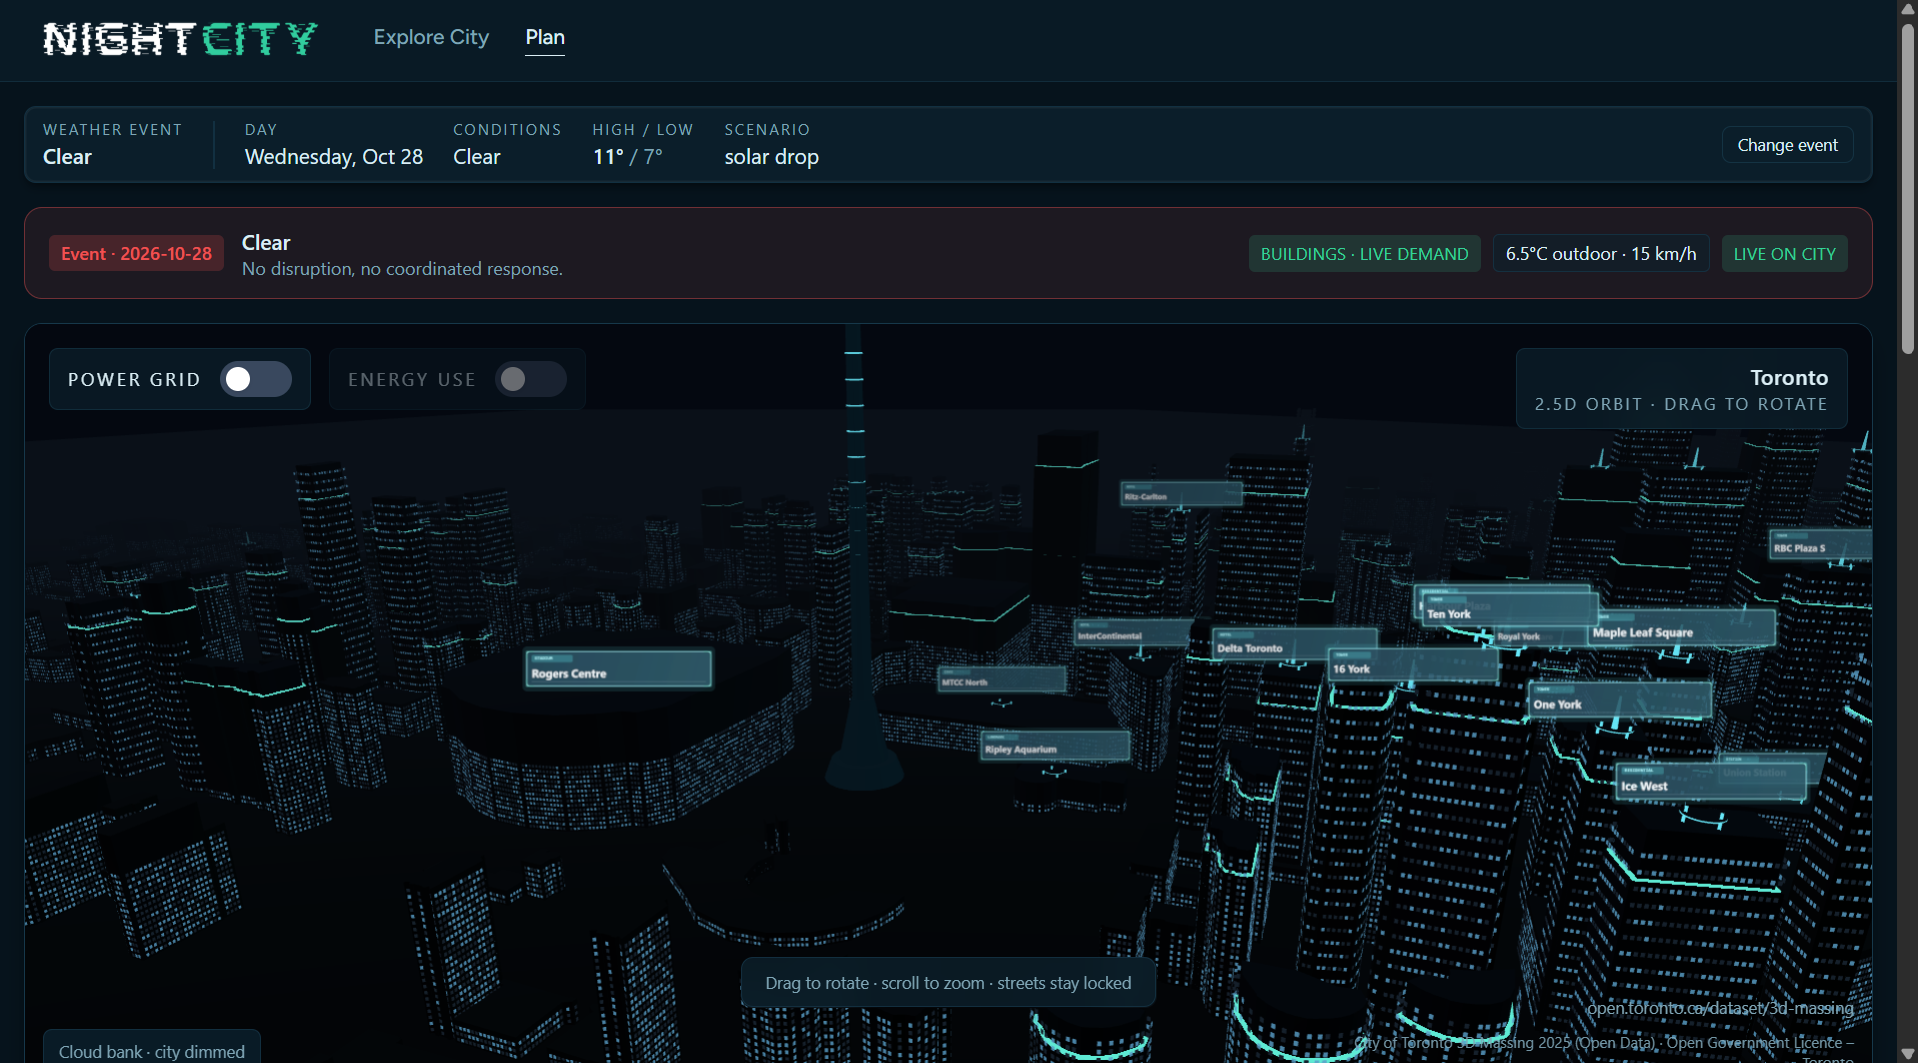
NightCity is an interactive 3D digital twin of downtown Toronto that helps users explore how energy is consumed across buildings and how that consumption could be reduced. Users can inspect buildings, explore energy-use patterns, and adjust energy strategies to compare baseline consumption with a more optimized plan.
Our key feature is simulating disruptions such as heat waves, storms, and sudden demand surges. By comparing a city that prepares ahead of time with one that doesn't, users can see how better energy planning could reduce peak demand, emissions, and energy waste while maintaining indoor comfort.
How we built it
We built NightCity using React, TypeScript, Tailwind CSS, Three.js, and Recharts to create an interactive 3D city and energy-planning interface. Our FastAPI backend connects building information, weather forecasts, and energy scenarios.
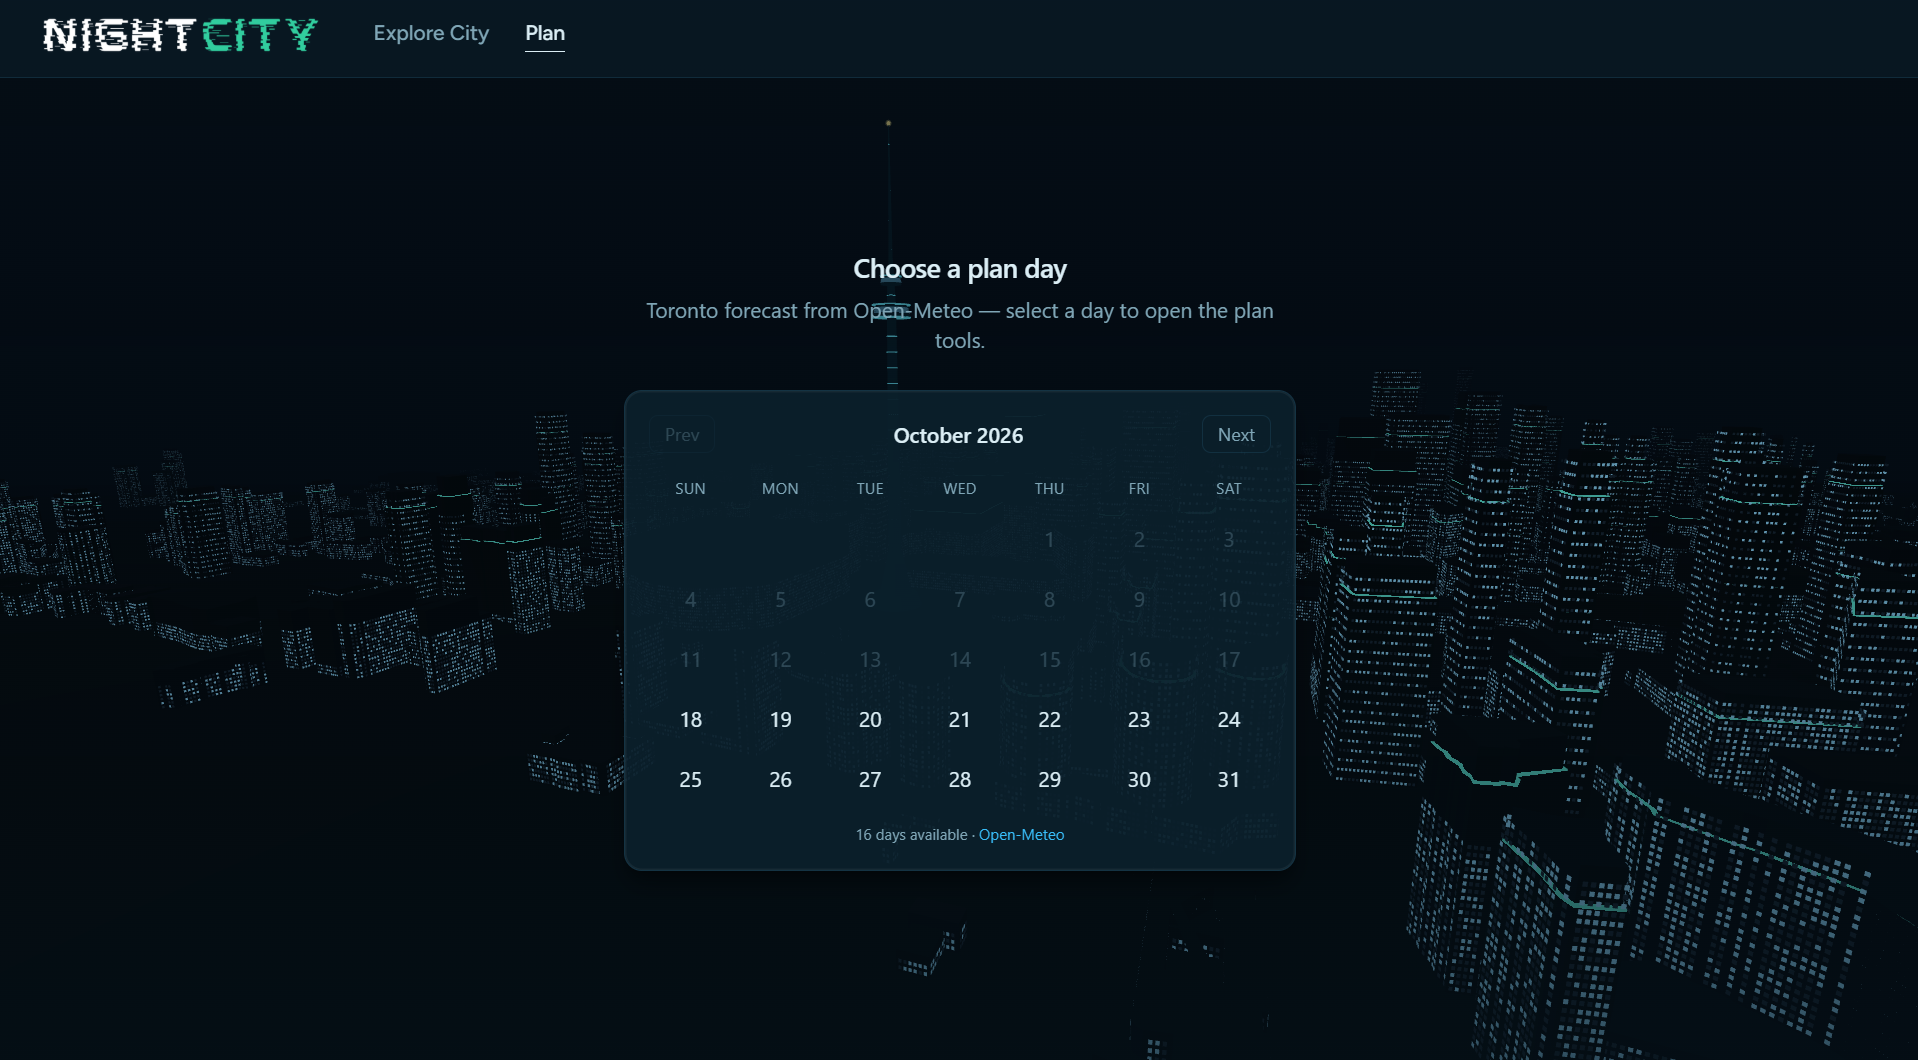
We use City of Toronto open data to visualize building geometry and Ontario's Energy and Water Reporting and Benchmarking (EWRB) data to ground our analysis in real reported building energy-use intensities. Weather data from Open-Meteo helps us explore how changing conditions affect energy demand. Our simulation and heuristic optimization approach models how different energy-management strategies could reduce waste compared with a baseline scenario.
Challenges we ran into
One of our biggest challenges was connecting building geometry, energy reports, weather data, and grid representations into one cohesive model. Real energy reports aren't always available at an individual building level, so we had to distinguish measured data from estimates and simulated values.
We also had to work within hackathon time constraints while building both an immersive 3D experience and the underlying energy-planning logic. This pushed us to prioritize communicating the core idea clearly: showing not just how much energy a city uses, but how better preparation could change that outcome.
Accomplishments that we're proud of
We're proud of turning complex energy-consumption data into an interactive city that people can actually explore. Instead of presenting energy statistics in isolation, NightCity lets users investigate buildings, test different strategies, and compare potential outcomes.
Most importantly, we created a way to visualize the value of prevention over reaction: preparing for a heat wave or demand surge before it happens could help cities avoid unnecessary energy use, reduce emissions, and maintain comfort when conditions become challenging.
What we learned
We learned that reducing energy waste requires more than tracking consumption. It also means understanding what drives demand, anticipating changes, and comparing decisions before they happen. We also learned the importance of data quality and transparency when combining real-world measurements with simulations.
What's next for NightCity
We want to integrate a fully functional simulation engine that quantifies the difference between prepared and unprepared scenarios using consistent assumptions and inputs. We also hope to expand our building-level energy estimates, improve our optimization algorithms, and incorporate richer infrastructure data.
Ultimately, we want NightCity to help cities identify opportunities to reduce energy waste, prepare for changing conditions, and make better use of the energy they already have — building a more efficient and resilient urban future.
Built With
- fastapi
- geminiapi
- python
- recharts
- tailwindcss
- three.js
- tigerdata
- typescript

Log in or sign up for Devpost to join the conversation.