🚀 Inspiration
Every building today is filled with Wi-Fi signals—but most of that data goes unused. We were inspired by the idea of transforming existing infrastructure into something smarter and greener. What if we could estimate occupancy and optimize building operations—using nothing more than the Wi-Fi that's already there?
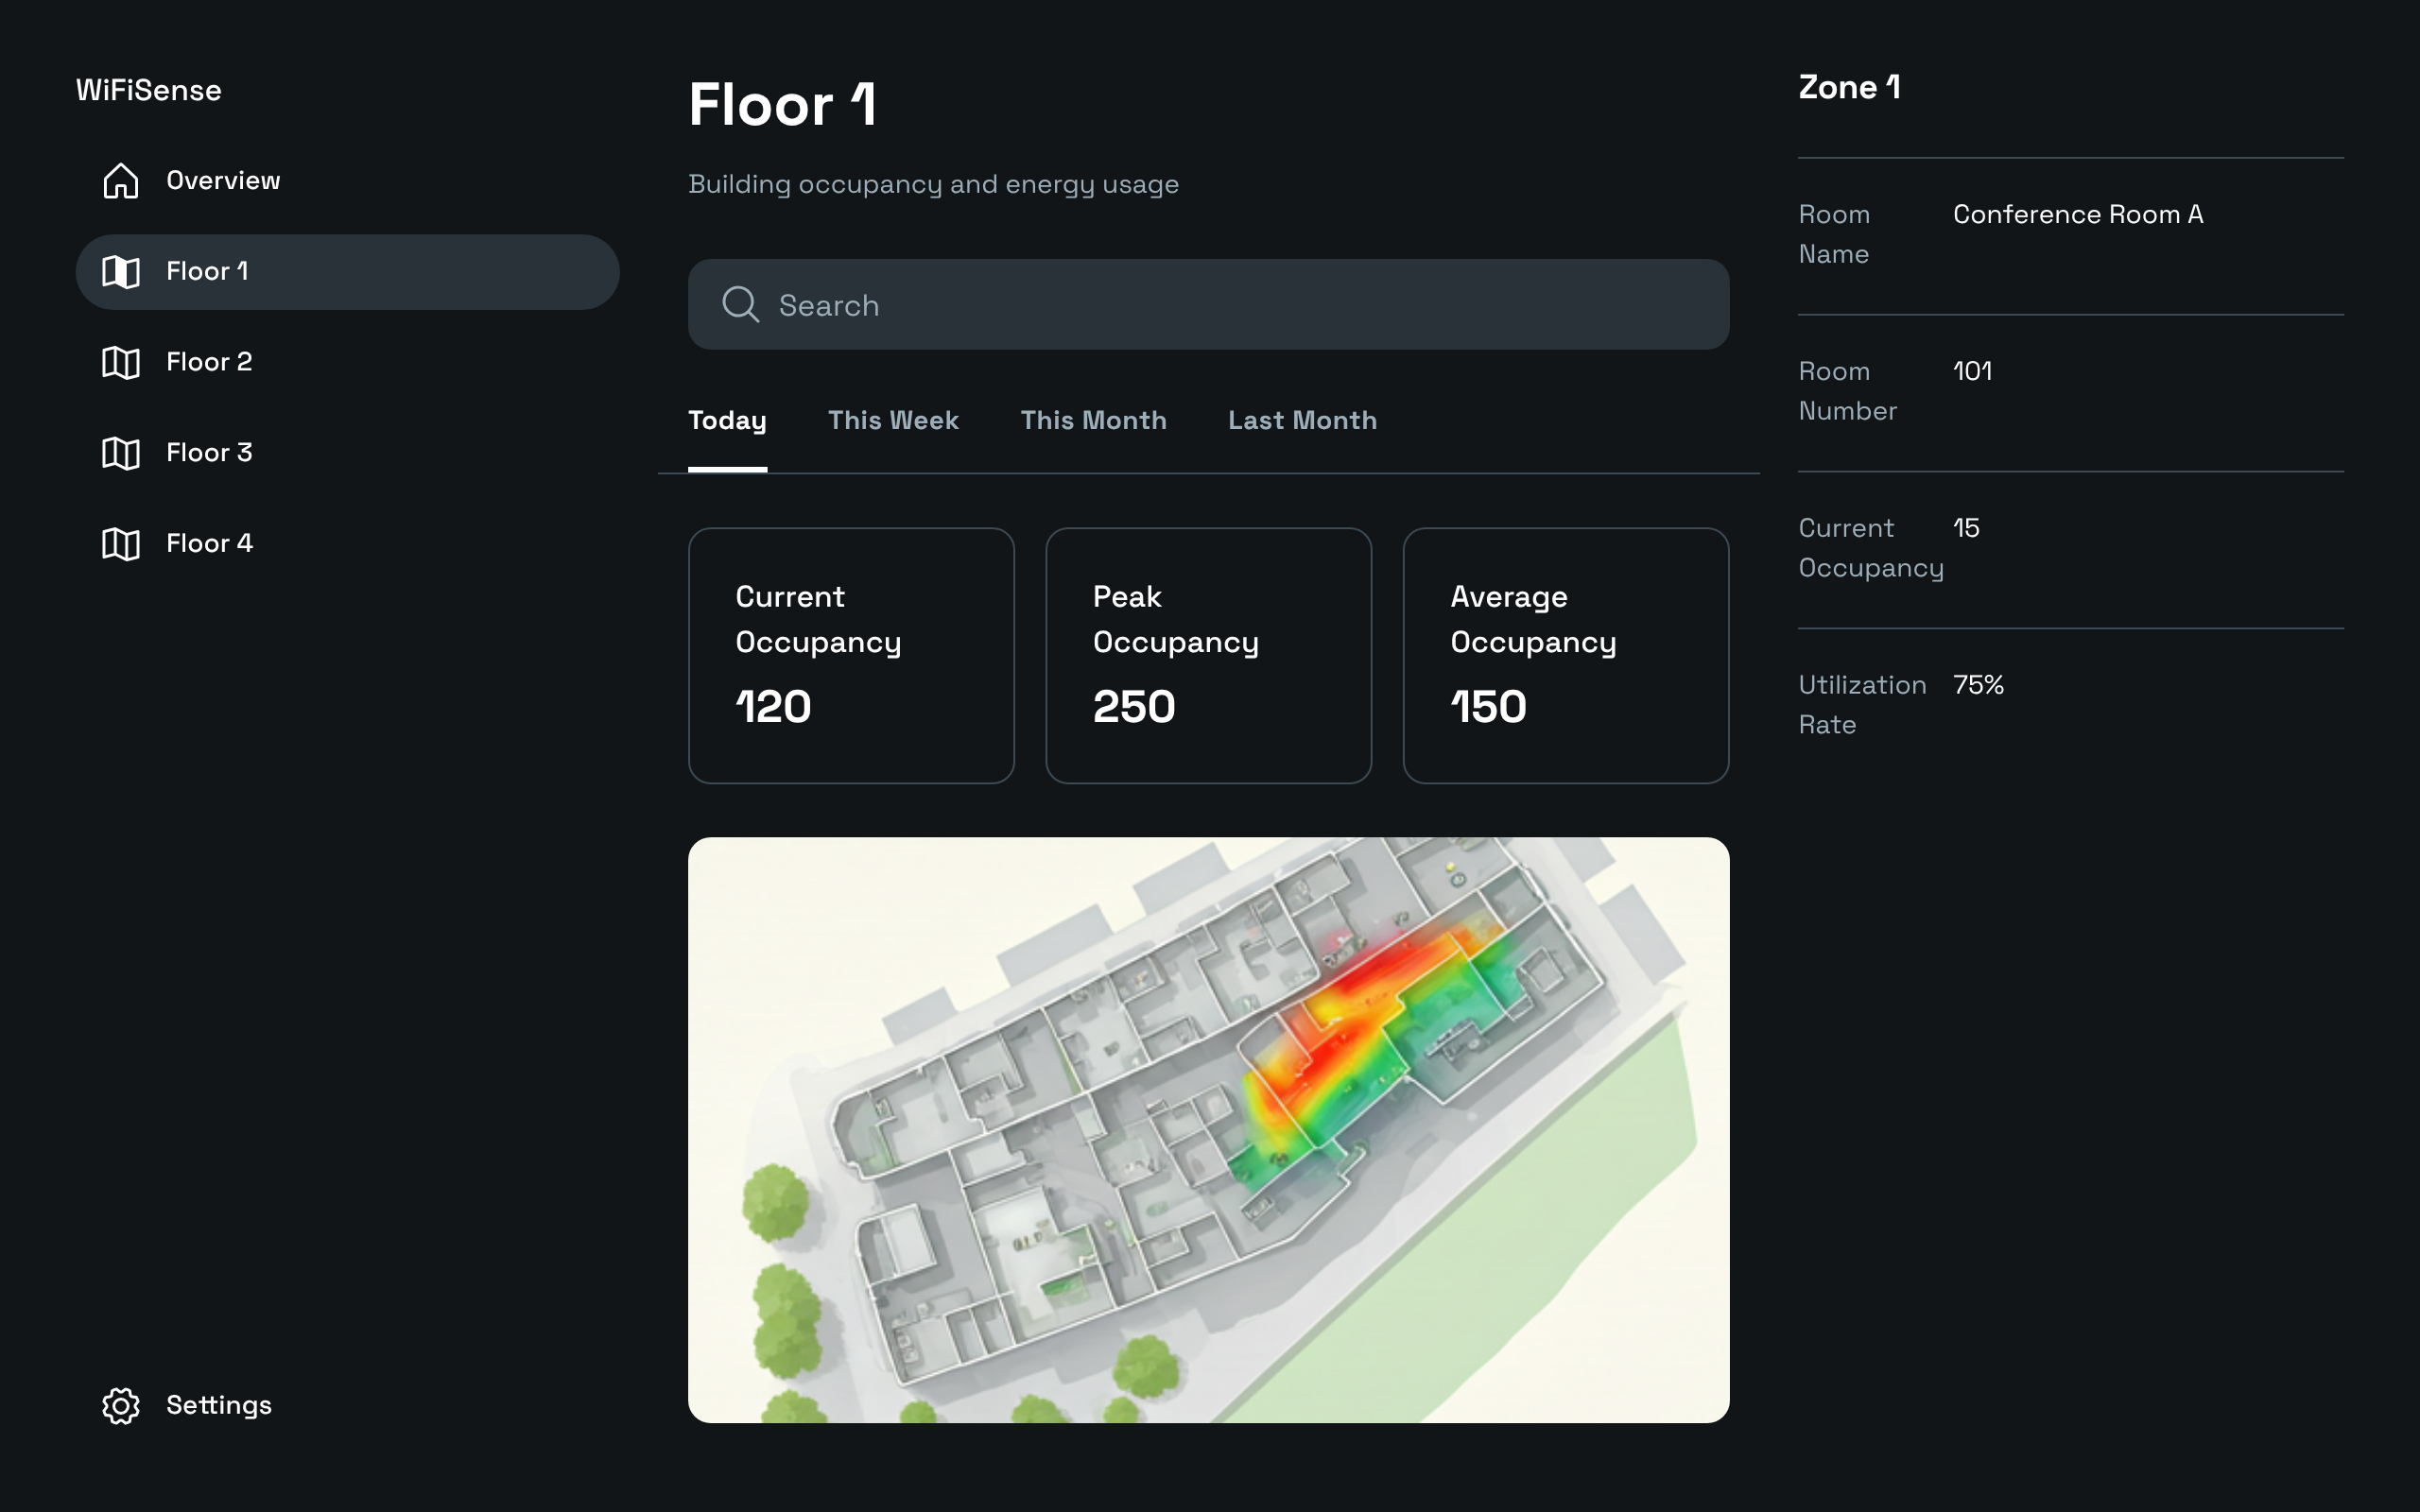
💡 What it does
WiFi Sense passively ingests Wi-Fi device counts from access points, links them to physical zones, and estimates real-time or historical occupancy using machine learning. The result is a zone-level heatmap dashboard that helps optimize energy usage, custodial services, and space management.
🛠 How we built it
- Frontend: Built in Next.js and Konva.js for floorplan heatmap rendering
* Backend: Python-based daily data bridge script + ML model (Linear Regression) in progress
⚔️ Challenges we ran into
- Mapping APs to physical zones was harder than expected
- Creating a frontend that feels live, even with daily batch data
- Scaling prediction models across different types of zones
🏆 Accomplishments that we're proud of
- Built a real-time-feeling dashboard in under 12 hours
- Created a cost-effective, privacy-first alternative to camera-based sensing
📚 What we learned
- Existing infrastructure is gold—if you know how to mine it
- Frontend interactivity (like map overlays) is just as important as backend accuracy
- Designing with privacy in mind from Day 1 is totally doable—and marketable
🔮 What's next for WiFi Sense
- Live-streaming ingestion (not just daily batches)
- Improved ML models with seasonal and contextual awareness
- Admin portal to upload new floorplans and define zones visually
- Pilot deployments with universities and smart building teams
- Sustainability report builder for ESG teams

Log in or sign up for Devpost to join the conversation.