-
-
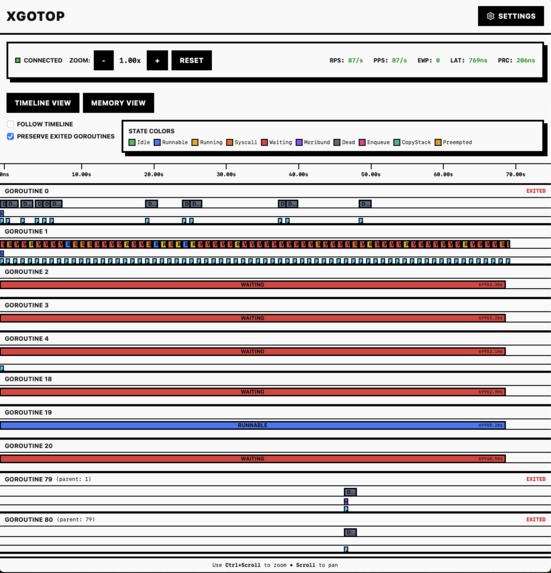
xgotop Web UI - Goroutine Timeline View
-
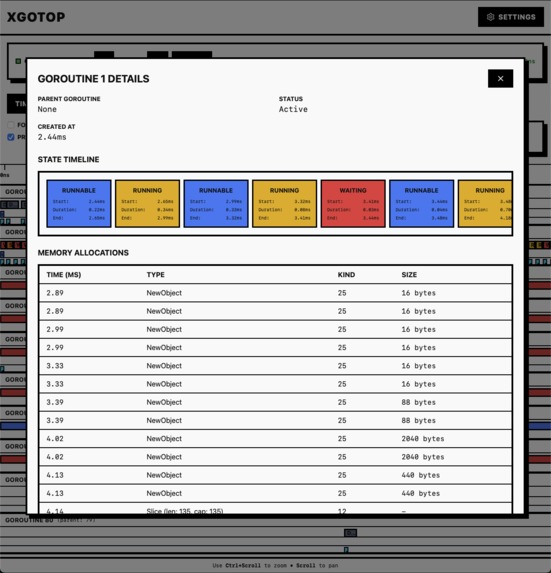
xgotop Web UI - Goroutine Details Page
-
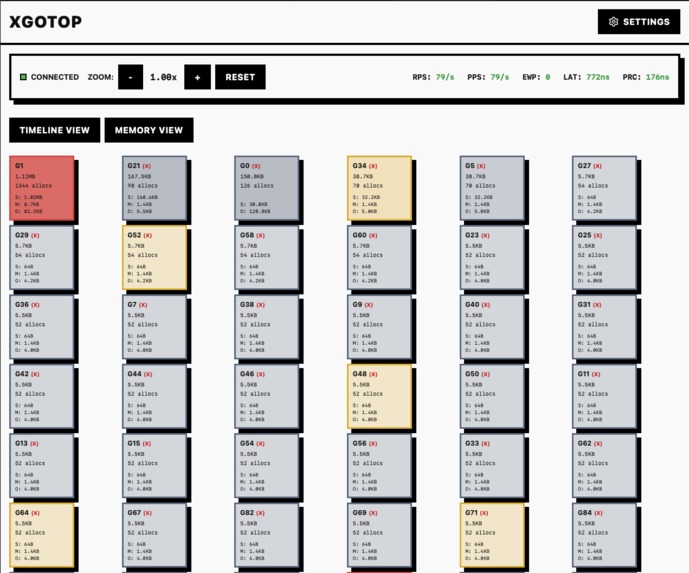
xgotop Web UI - Goroutine Memory View
-
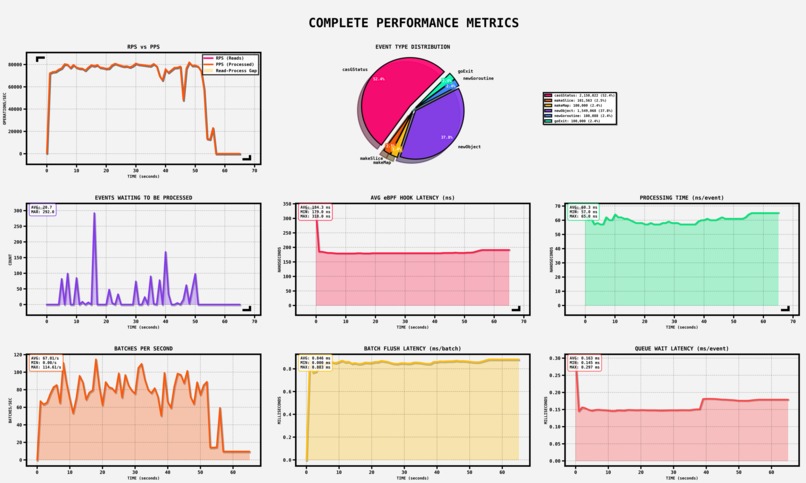
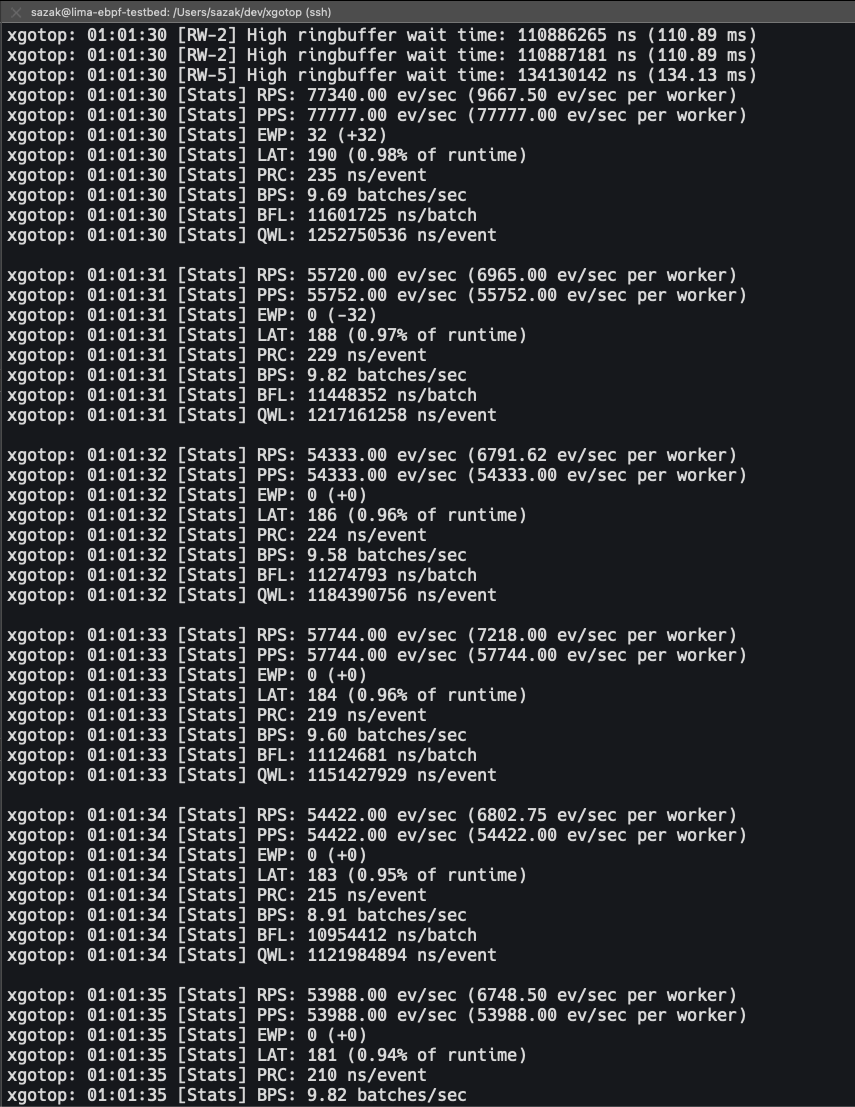
Performance Metrics with 16 Readers, 1 Processor and Protobuf Storage
-

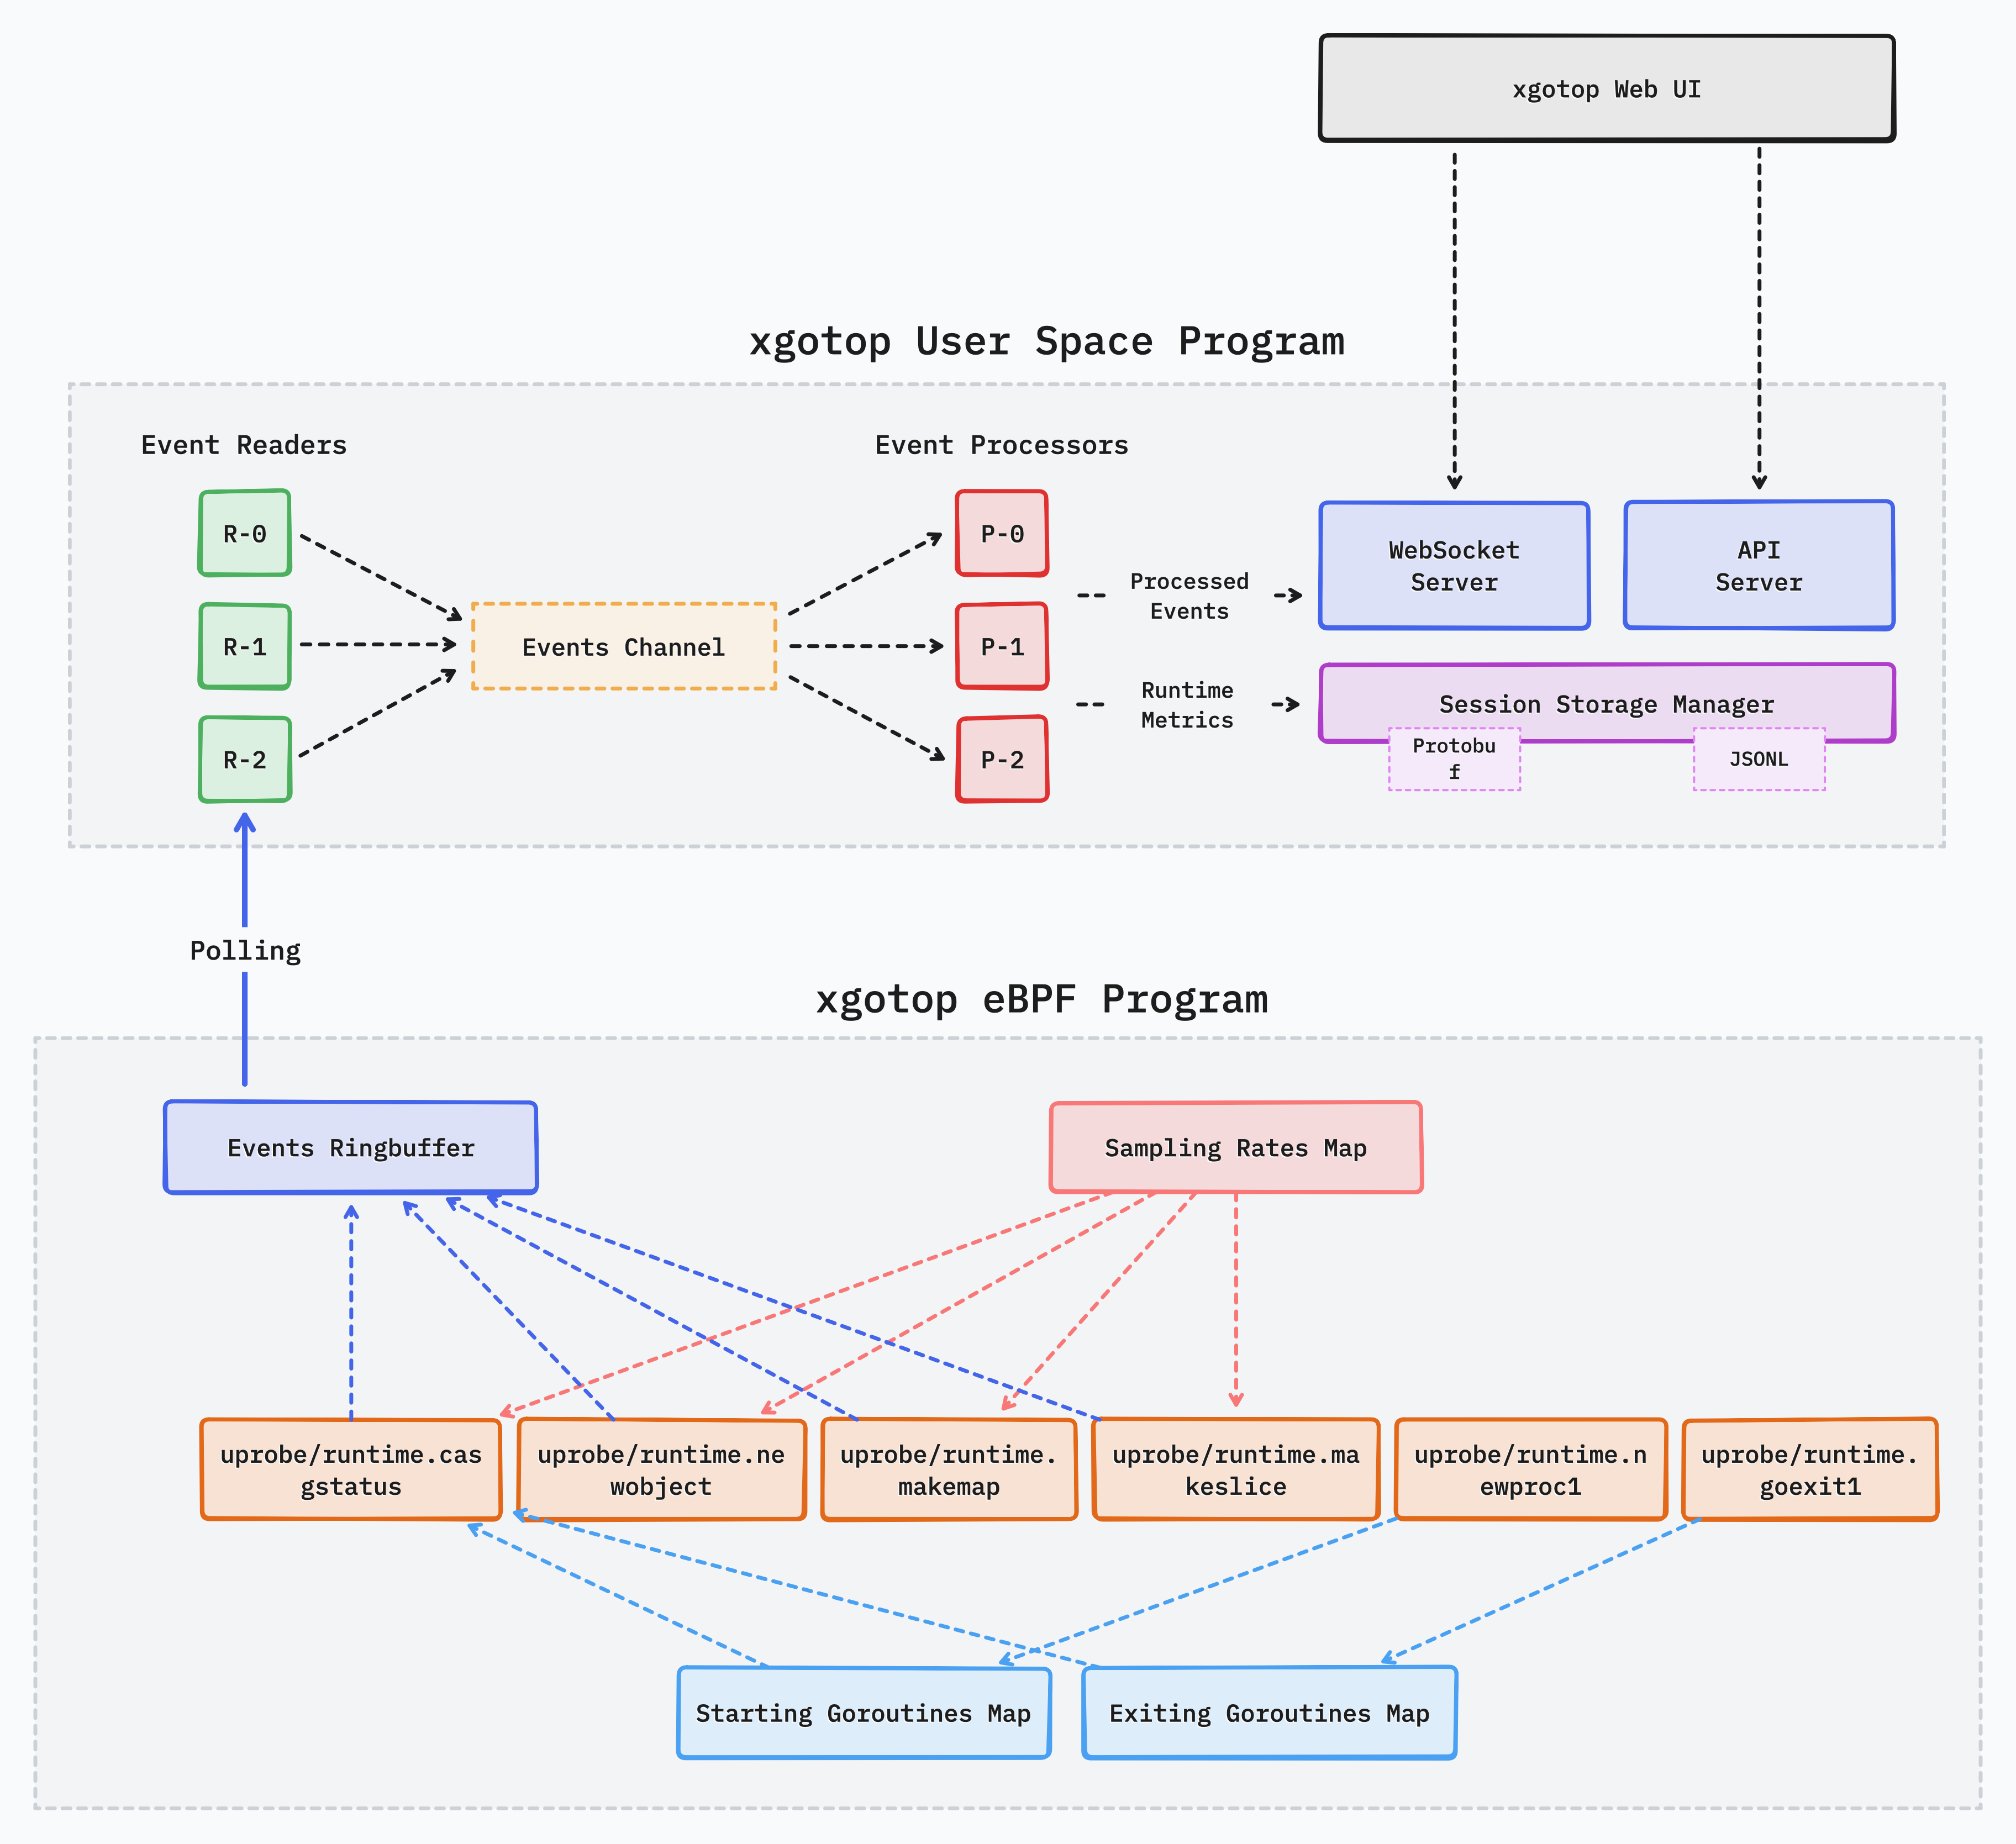
System Design Overview of xgotop Project
-
xgotop CLI


Inspiration
I've been learning about, experimenting with, and writing about eBPF for a while. While working on a new project on tracing HTTP requests in HTTP servers written in Go using eBPF and bpftrace, I've needed to trace specific goroutines in realtime.
That's when I've noticed that I should develop a realtime Go runtime visualizer with a CLI and a web UI to trace goroutine lifecycle and memory allocation events.
What it does
xgotop attaches several uprobe's to the specified program which is written in Go, and traces the goroutine state changes and memory allocations in detail with sub-microsecond delay.
How we built it
I've built this project by first writing a bpftrace script to prototype the idea to see if it's doable, and then started writing the real implementation using C for the eBPF program, Go with the cilium/ebpf package for the userspace program, Go again for storage/API layer, Python for runtime metrics plotting and test validations, and React for web UI.
You can see the overall system design in the illustration below.
Challenges we ran into
The initial challenge was that extracting goroutine information from a running Go program is not a trivial task. Memory layout of internal runtime structures depends on the architecture of the host machine and the Go version of the target program. I've read the Go ABI to find out that I needed to use the r28 register to get the
gruntime struct of the current goroutine for example. I've also read the Go source code for Go 1.25 to learn the memory offsets ofgstruct's fields that I need, enumerated values of native Go runtime types, internal values of goroutine states, runtime functions that I can hook, and so on.After reading the source code, I've bumped into the issue of not being able to use
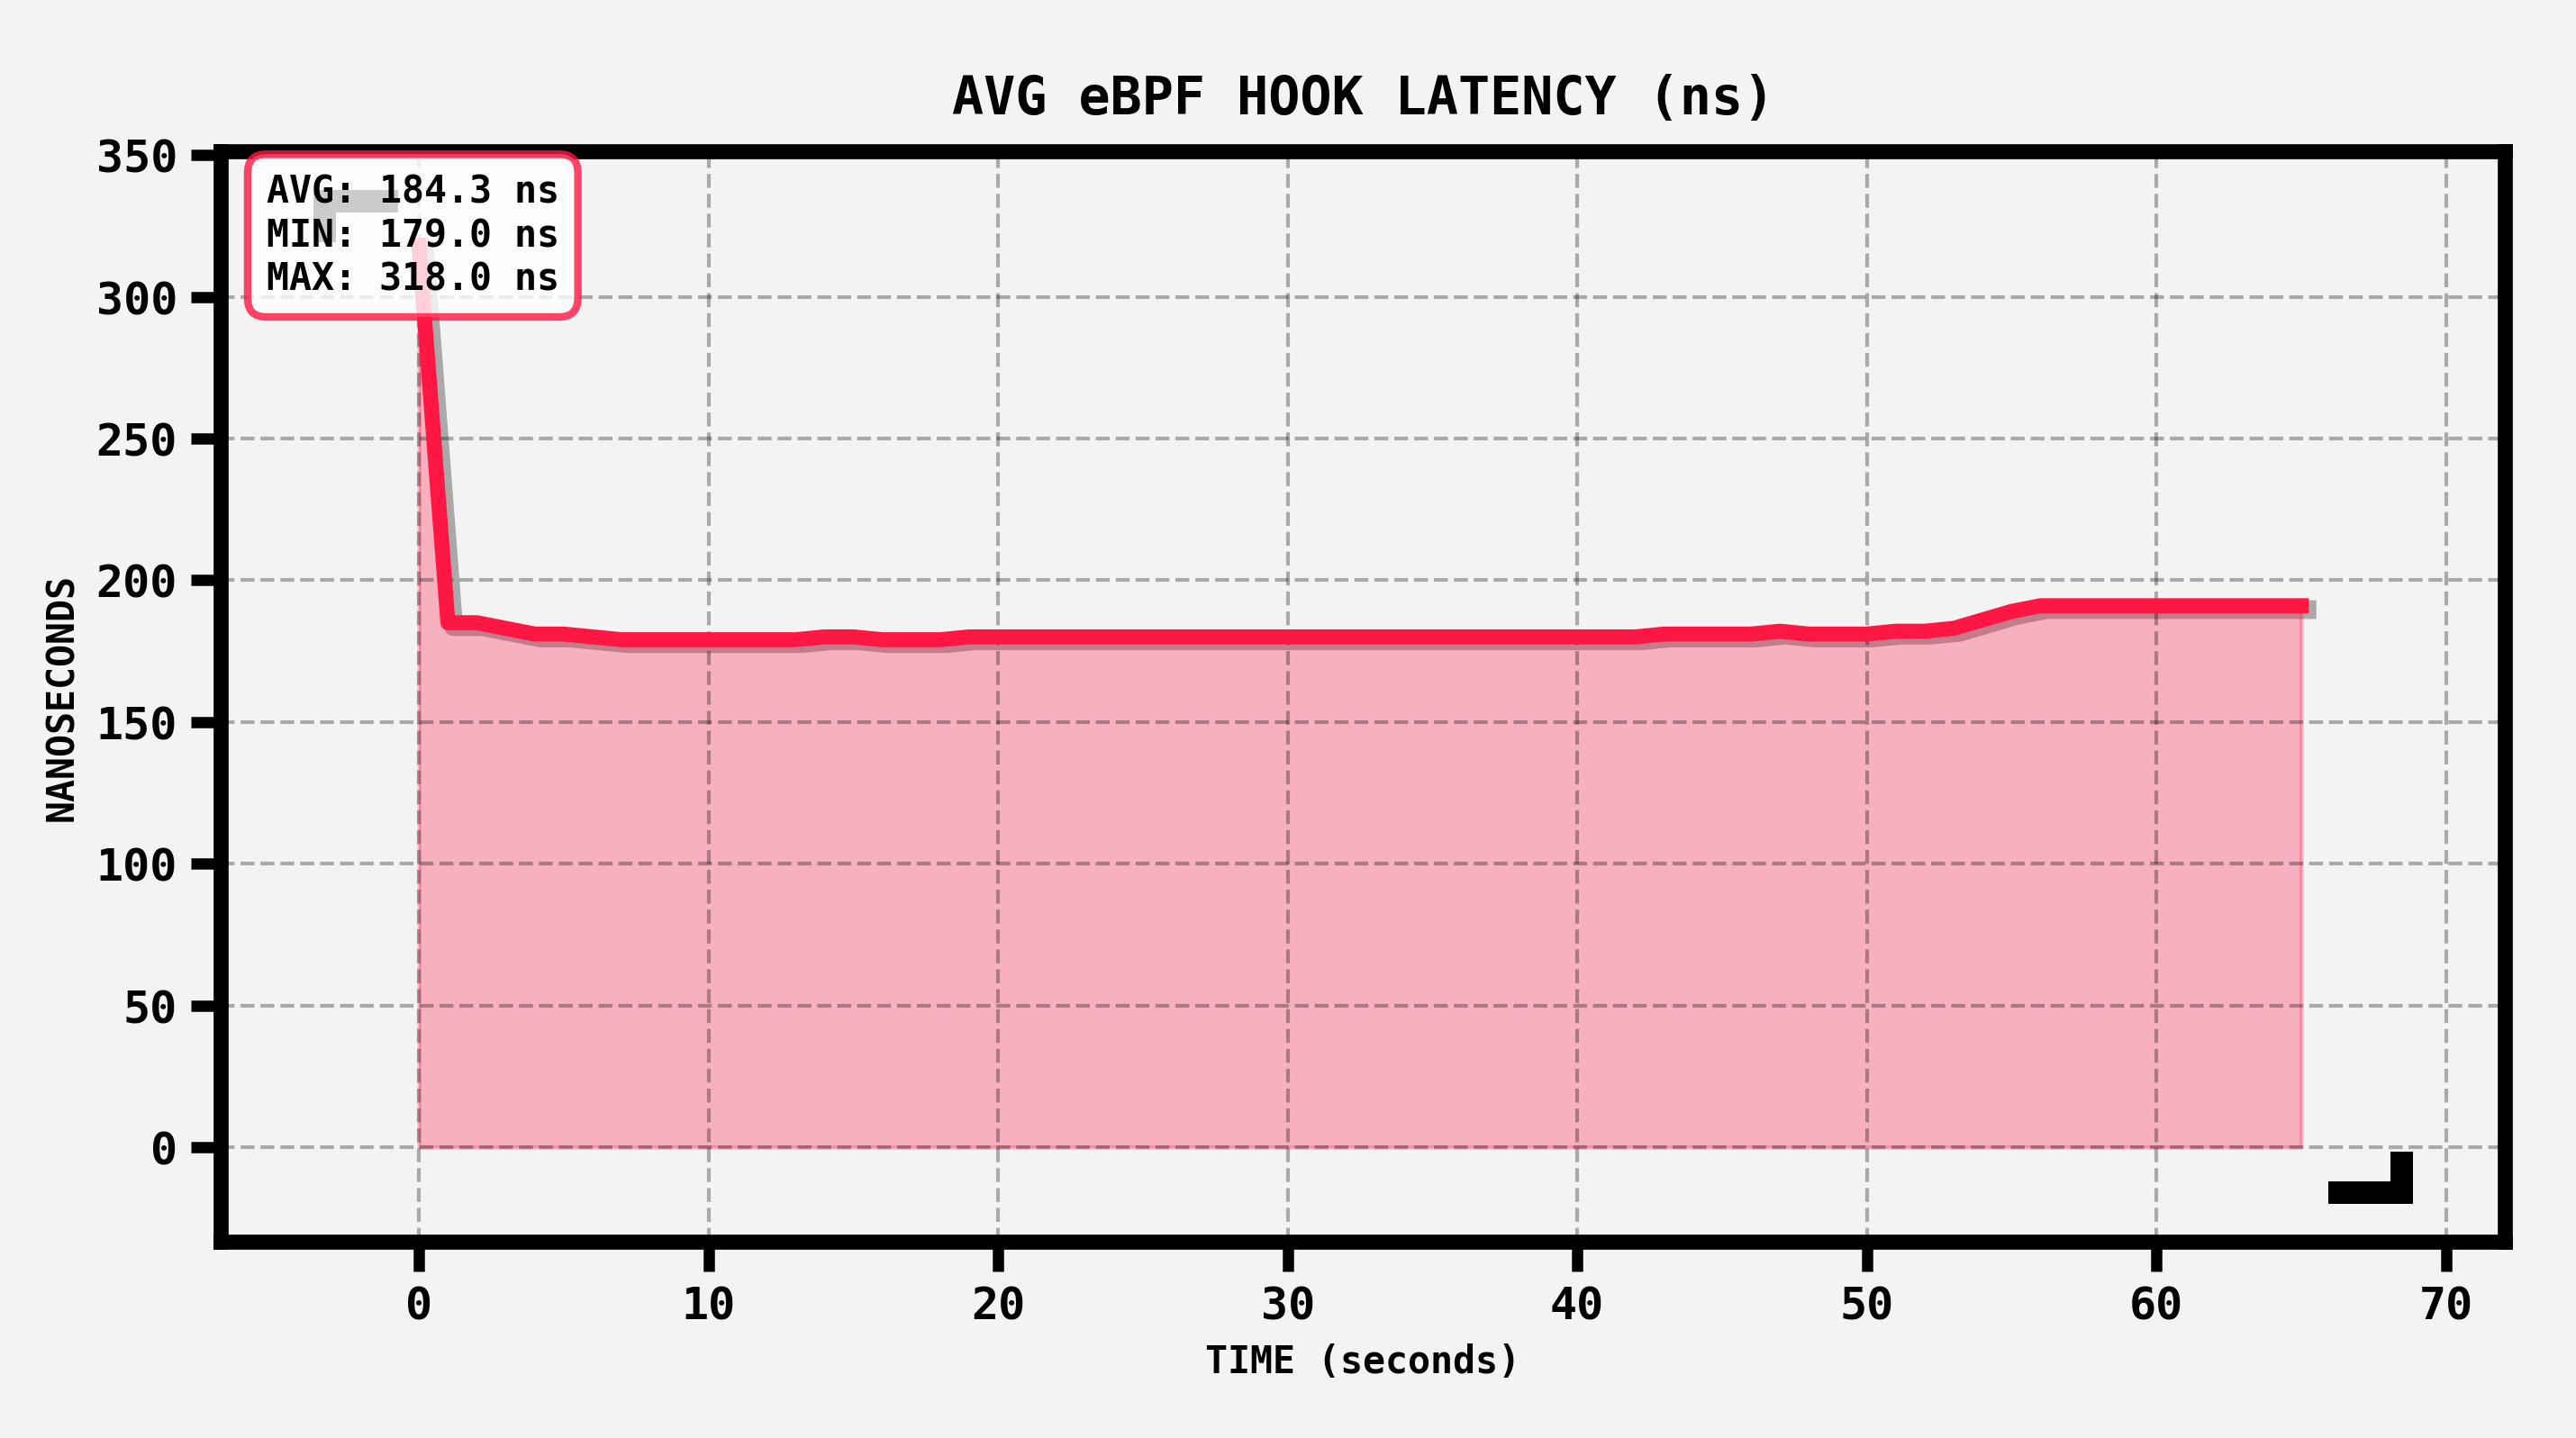
uretprobes on Go runtime functions, as the return probe was overriding the return PC of the runtime function in call in memory. I needed to hold and internal state of whether a goroutine is in creation or in exiting using two new eBPF maps and integrate the logic of handling goroutine creation and exit inside theuprobeof goroutine state changes to solve this issue.Another challenge was that as each eBPF hook needs time to execute, the program had overhead in non-test, non-trivial production targets. To solve this issue, I've introduced sampling. To store the sampling configuration I've used another eBPF map in runtime, to communicate this configuration between the userspace and the kernel space. Implementing sampling in the eBPF program was not a trivial task though, I needed to handle sampling of goroutine create, exit and state change separately as both create and exit logic were running inside the state change hook as I've mentioned before. After sampling and a couple of other optimizations, an average hook takes around
200nsto execute, as can be seen in the metrics plot below.
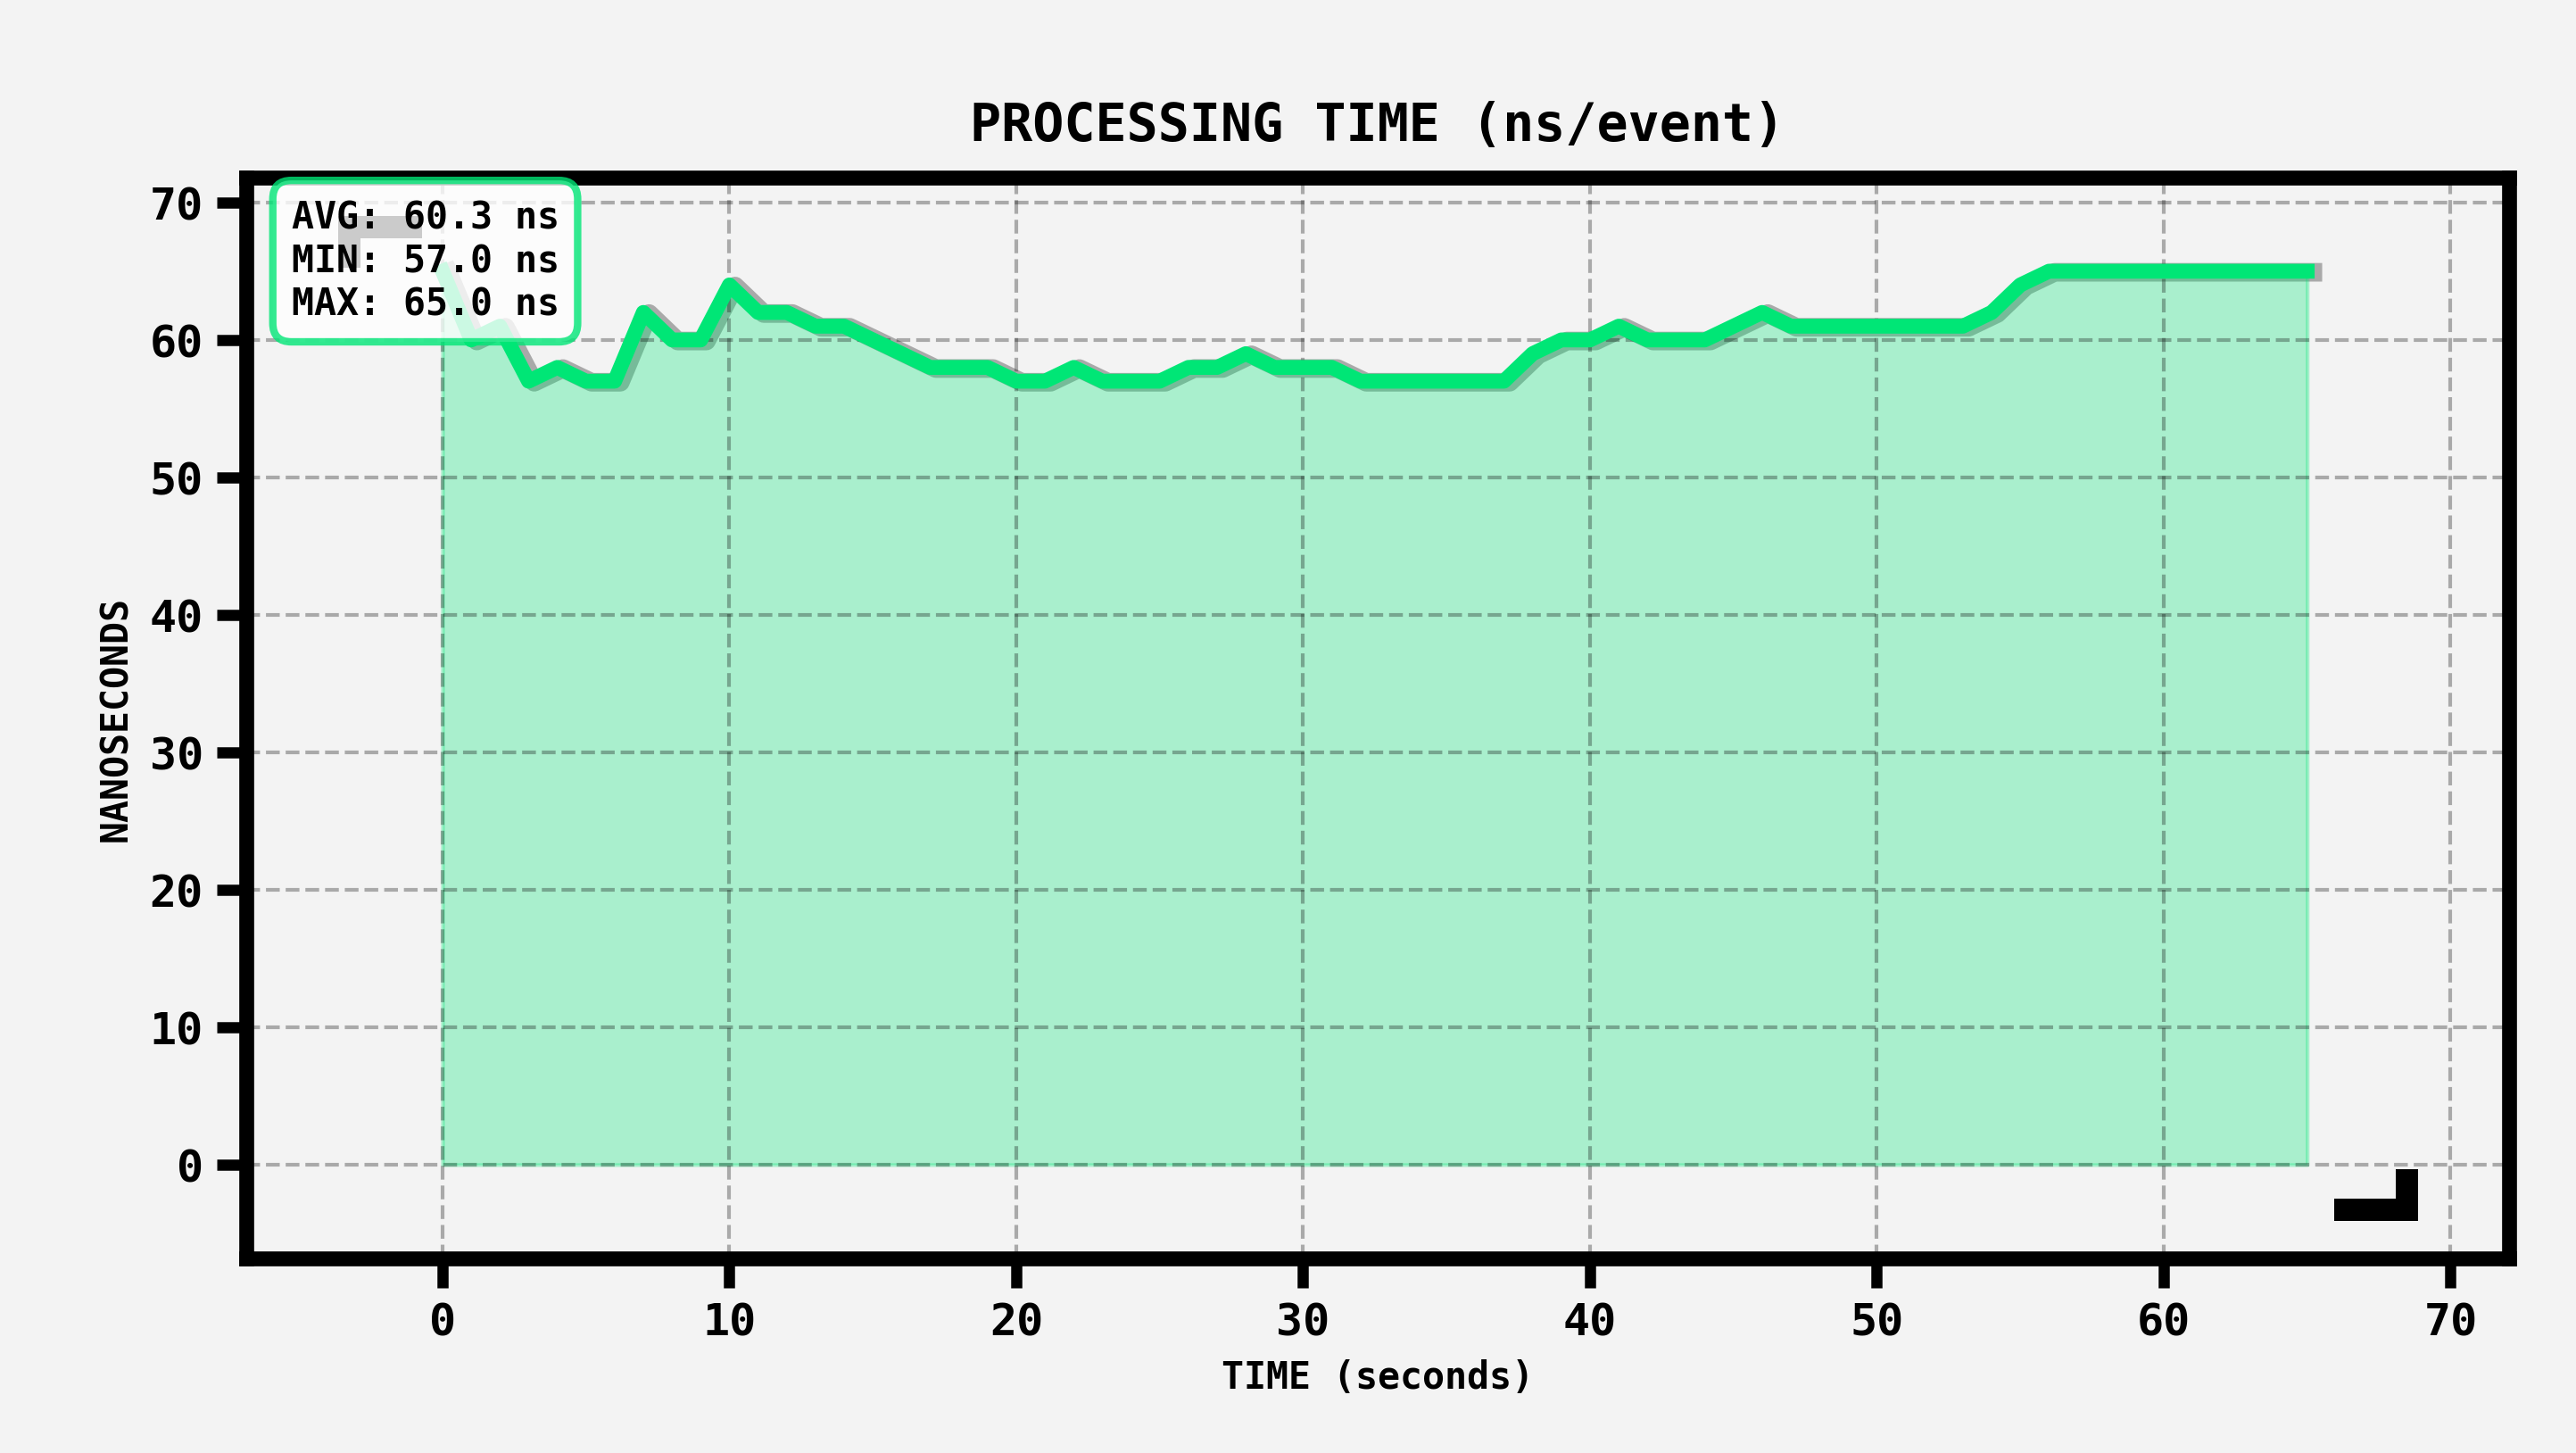
- Finally, my initial implementation of slow storage management and API server operations were causing the event queue (buffered Go channel) in userspace to fill up, which was again causing the ringbuffer to fill up and eBPF events to get lost. To overcome this issue, I've introduced bulk writing of processed events to storage and API server to improve the performance. After these optimizations, the event processor takes around
60nsto process an event, as can be seen in the metrics plot below.
Accomplishments that we're proud of
I'm proud of being able to build a low-level project from start to finish by first doing the research by reading the Go source code and docs, then prototyping the idea with bpftrace, implementing the production version using C and Go, developing a testing suite around it, and finally building a web UI (with the help of AI) for the project. At the end of the day, I have a tool that I needed and also might be useful for the community.
What we learned
I've learned that building tooling products which support multiple versions of the programming language and OS architectures is not a trivial task. That requires a lot of research and testing to validate the correctness of the implementation. I've also learned more about how goroutines work and allocate memory in Go runtime.
What's next for xgotop: Realtime Go Runtime Visualizer
There are still many things to fix and optimize and introduce as new features to the project. Here is an incomplete list of my ideas about the next steps for xgotop:
- Add support for
amd64architecture - Store events in ClickHouse, which will be storage-efficient and fast as a columnar metrics DB is the perfect fit for this kind of data we generate
- Offline replay of sessions
- Add support for more Go lifecycle events
- Add support to be able to see which function is being executed in the goroutine (parsing the function name in runtime)
- Add support for listing the stack trace of the goroutine at the time of the event
- Optimize the way that it's reading Go runtime objects (
gstruct has lots of padding now, which is a bad practice)


Log in or sign up for Devpost to join the conversation.