🔍 What Inspired Us
We wanted to build insights from the invisible.
We chose this track as a challenge. Two of the team members — Ananya and Ekta — did not know much about soccer when we started. But after meeting the sponsors and going through the SkillCorner resources provided, we were immediately captivated. We realized that soccer is not just a high-speed game but is actually deeply structured beneath the surface — filled with data, patterns, and untapped potential. We were inspired by the idea that so much of what makes a team successful isn’t visible to fans or even traditional stat sheets. Off-ball movement — the positioning, pressure, and spacing created without touching the ball — plays a massive role in team performance. And yet, it’s often ignored in surface-level analysis. We wanted to change that. We wanted to build something that gave coaches, scouts, and analysts a new lens to evaluate players using these invisible actions.
Our Approach
We began by digging into the datasets provided by our sponsors. That first step was honestly overwhelming — with hundreds of columns and hundreds of rows of data that we had never seen before. It was a goldmine, but it took us hours of manual exploration and basic pandas-based slicing just to understand what we had. We read columns line by line, cross-referenced values, and tried to mentally map game events to the data. Once we gained a solid understanding, we had an idea:
What if we could predict match impact before the ball was even passed?
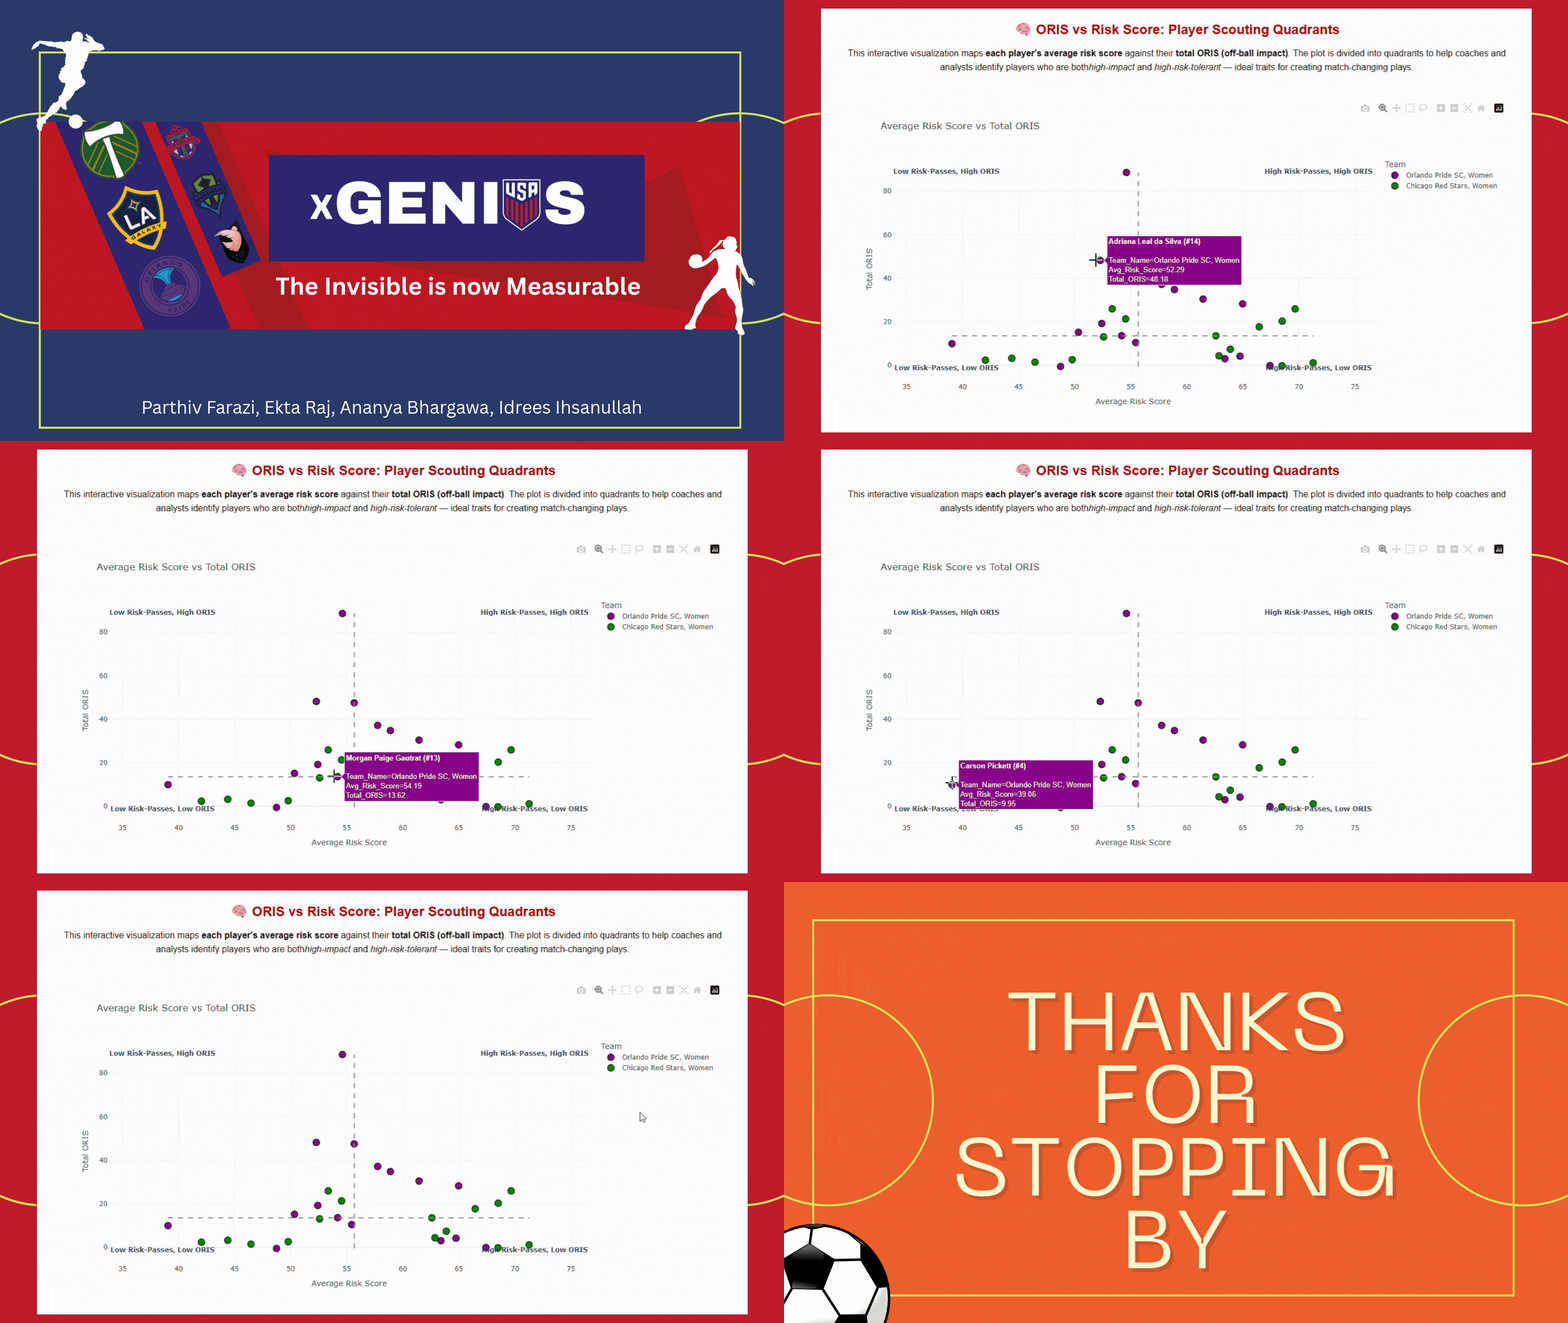
Off-Ball Run Impact Score (ORIS)
From that idea, we built a new custom metric called ORIS — Off-Ball Run Impact Score. It’s a composite score combining:
- Number of defenders overtaken
- Whether the player broke the defensive line
- Whether they pushed the defense
- Whether their run was actually matched with a pass
- Duration (used as a penalty — the slower the run, the lower its efficiency)
We engineered this score to reward runs that truly disrupt defenses — whether or not they receive the ball. This gave us a quantifiable way to rate runs — not just based on outcomes, but based on pressure and positioning.
What ORIS Tells Us
- Players with high ORIS are those who create space, pull defenders, or break defensive lines — even if they don’t touch the ball.
- It helps coaches identify silent contributors who make intelligent runs that fuel attacks.
- It offers a new way to evaluate off-ball intelligence, something traditional metrics often ignore.
We calculated this score for every run and aggregated it by player using player_id, player_name, and team_name via tracking data. This gave us a full impact profile for each athlete:
total ORIS, average ORIS, and number of runs.
Perceived Pass Risk Score
Then we went further.
We introduced a Perceived Risk Score — designed to model how risky a pass looks to a passer, based on:
- Distance to own goal
- Number of opponents near passer and receiver
- Pass direction and length
- Quickness of the pass decision
We wanted to answer: How complex or dangerous does this pass look — before it's made?
Our Formula:
risk_score = (
    pass_distance * 0.3 +
    (abs(pass_angle) + abs(trajectory_angle) + abs(interplayer_angle)) * 0.1 +
    n_opponents_ahead_pass_reception * 2.0 +
    n_opponents_bypassed * 1.5 +
    abs(delta_to_last_defensive_line_start) * 0.5 +
    (10 - separation_start) * 0.2 +
    2.0 if inside_defensive_shape_end else 0 +
    1.5 if defensive_structure == "compact" else 0 +
    3.0 if dangerous else 0 +
    2.5 if difficult_pass_target else 0
)
Most metrics penalize failed passes after the fact. Ours instead models the perceived risk of selecting a player as the target, based purely on positioning, pressure, spacing, and context — without bias from pass success or failure. We deliberately excluded outcomes like pass completion or goals — because this metric was about decision-making, not hindsight.
For each player, we calculated their risk score every time they possessed the ball before a pass, and then averaged their risk score for the match.
What Risk Score Reveals
- Players positioned inside defensive structures, under pressure, or closely marked have high risk scores.
- Passes with high angle deviation, long distances, or made into compact areas are marked risky.
- It quantifies decision-making complexity for the passer — helping us visualize “risky teammates” from the passer’s POV.
We generated a full passer-to-target risk matrix, showing how risky each teammate appears to each player over the match. This gives coaches a tactical heatmap of which players are consistently positioned in high-risk zones and how their presence might affect ball circulation and tempo.
Technical Challenges
One of our biggest challenges was metric design.
It's one thing to build a formula — it’s another to make sure it actually produces useful, explainable results across six full matches of event data.
We spent a lot of time validating our ORIS and Risk formulas:
- Testing them across different players
- Checking values by hand
- Iterating on weights and components until the insights made sense
We also faced integration pain — we had ambitious plans to deploy our models into an interactive dashboard, but syncing the backend models with the frontend took a lot more time than expected. This limited the time we had to build a third model (we initially wanted to model progression probability over time), but it gave us a much deeper understanding of full-stack deployment.
What We Learned
This project taught us how to:
- Think critically about which metrics actually matter to coaches and scouts
- Explore large, messy, multi-table datasets effectively
- Build from intuition, iterate through modeling, and land on defensible insights
- Work end-to-end: from data engineering to visualization
And, most importantly, we came away with a new appreciation for a sport we never thought we’d work with. Soccer is more than just goals and shots — it’s a game of space, timing, movement, and invisible influence.


Log in or sign up for Devpost to join the conversation.