Inspiration
In today's hyper-connected world, navigating complex financial landscapes and corporate intelligence requires tools that can cut through the noise and reveal hidden connections. We were inspired by the sophisticated analytical capabilities of platforms like Palantir and the potential of advanced AI, like Perplexity's Sonar API, to provide deep, contextual understanding from vast datasets. Our project, "GOTHAM: Financial Intelligence," imagines such a tool for a high-stakes user – Mr. Bruce Wayne – tasked with managing the multifaceted interests of Wayne Enterprises and monitoring the volatile environment of Gotham City. We aimed to demonstrate how a powerful AI could drive a next-generation dashboard for strategic decision-making.
What it does
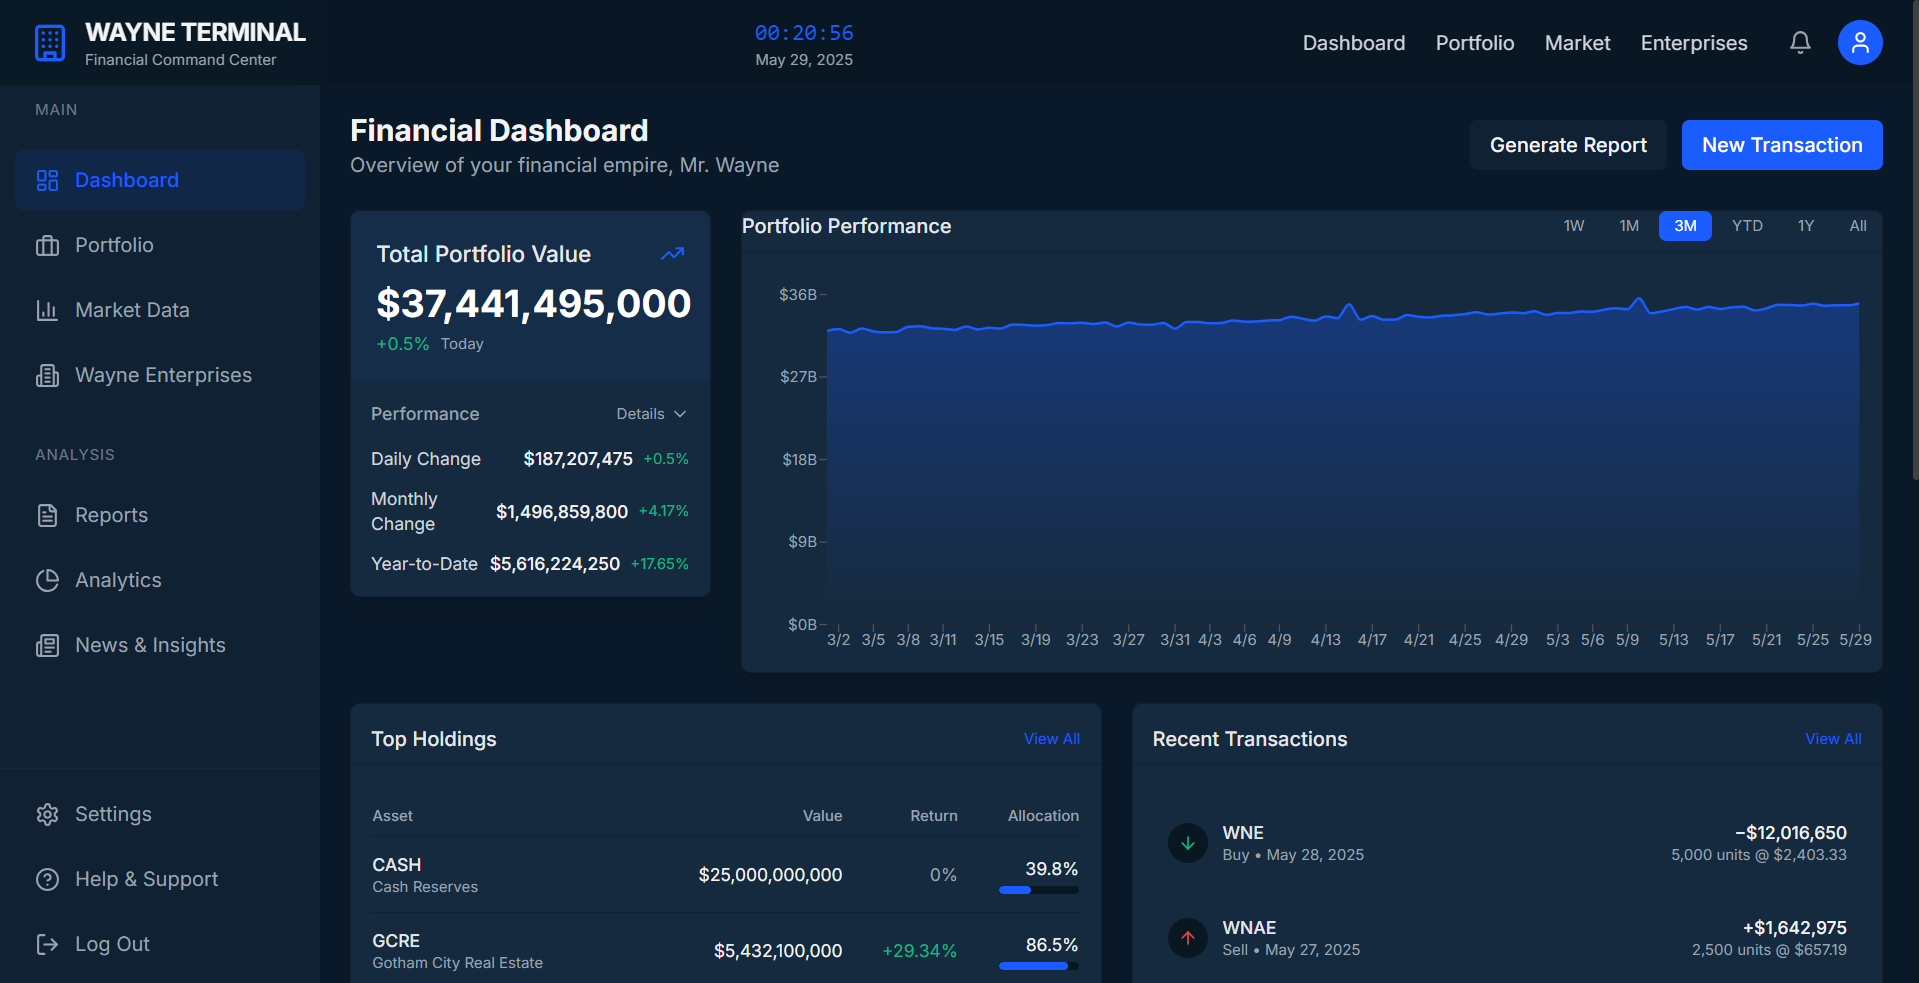
GOTHAM: Financial Intelligence is a simulated, high-fidelity dashboard designed to offer comprehensive oversight of corporate assets, market dynamics, and network intelligence. It allows users to:
- Monitor Key Performance Indicators: Get an at-a-glance view of portfolio value, market sentiment, risk scores, and specific asset performance (e.g., Wayne Enterprises stock).
- Analyze Market & News: Access (mock) real-time news feeds with AI-simulated sentiment analysis and summaries for specific topics or general market trends.
- Manage Corporate Assets: Deep dive into "Wayne Assets," including an interactive map of subsidiary locations, financial KPls for holdings, and transaction logs.
- Visualize Strategic Interests: Utilize a multi-layered "Strategic Interests Map" (Leaflet.js) to overlay financial events, competitor activity, high-risk zones, and philanthropic projects across Gotham.
- Explore Entity Networks: The "Network Nexus" provides an interactive SVG-based graph to visualize relationships between entities (corporations, individuals, accounts). Clicking nodes reveals detailed profiles and connection types.
- Leverage (Simulated) AI Insights:
- "Ask GOTHAM AI": Pose natural language queries for general intelligence (simulated response).
- Generate Company Dossiers: Input a ticker to receive an AI-simulated detailed company brief.
- Network Analysis: Alongside the visual graph, get an AI-generated textual summary of connections between queried entities.
- Threat Assessment: For system alerts, generate an AI-simulated summary of potential threats and implications.
- Track System Alerts & Logs: Monitor critical system alerts with map integration and review a comprehensive system activity log.
How we built it
GOTHAM is a frontend application built with HTML, Tailwind CSS, and Vanilla JavaScript.
- Mapping: We utilized Leaflet.js to create dynamic and interactive maps for visualizing geographical data related to assets, alerts, and strategic interests. Custom Font Awesome markers enhance visual distinction.
- Network Visualization: The "Network Nexus" features a custom-built SVG graph. Node positioning is managed by a simplified physics simulation (nodes repel, links act as springs) to create a dynamic layout. This was a frontend challenge to provide a graph-like feel without heavy external libraries.
- Simulated "Sonar API" Integration: A core concept was to demonstrate how an advanced AI like Perplexity's Sonar API could power the intelligence features. We simulated this integration through a JavaScript
simulateApiCallfunction. This function mimics asynchronous API calls and returns structured mock responses for:- Natural Language Queries (
Ask GOTHAM AI): Takes user input and returns a relevant (mock) textual insight. - Company Dossier Generation: Simulates fetching and structuring detailed company information.
- Network Relationship Analysis: Provides a narrative explanation of connections between entities, complementing the visual SVG graph.
- Threat Assessment for Alerts: Generates a summary of risks associated with system alerts.
- News Summarization & Sentiment: Processes (mock) news data to provide summaries and assign sentiment scores. The goal was to design the UI and data flows as if a powerful AI backend was processing these requests, showcasing the potential of such an integration.
- Natural Language Queries (
- Data Management: All data is currently mocked using JavaScript objects and arrays, structured to represent real-world entities, financial instruments, news articles, and network relationships.
- UI/UX: We focused on a dark, sophisticated "command center" aesthetic, emphasizing clarity and ease of navigation for a data-intensive application.
Challenges we ran into
- Simulating a Sophisticated AI (like Sonar API) Purely on the Frontend: Crafting diverse and contextually relevant mock responses for various AI-driven features required careful planning to make the simulation believable and demonstrate the intended functionality.
- Interactive SVG Network Graph: Developing the custom SVG graph with even basic physics for layout, interactive highlighting, and dynamic updates without a dedicated graphing library was technically challenging but rewarding. Performance for larger, denser graphs would be a concern without further optimization or a dedicated library.
- Data Interconnectivity: Ensuring that interactions on one module (e.g., clicking a subsidiary in "Wayne Assets") could trigger actions on another (e.g., focusing the "Wayne Assets Map") required careful management of shared state and event listeners across different map instances and UI components.
- Maintaining Performance: With multiple interactive maps, a dynamic (though simplified) graph, and various data feeds, ensuring the dashboard remained responsive was a constant consideration.
Accomplishments that we're proud of
- The Immersive "GOTHAM Intelligence" UI/UX: We believe we've successfully captured the look and feel of a sophisticated, high-tech intelligence dashboard, making it engaging for a user like Bruce Wayne.
- Interactive Network Nexus: The redesigned SVG-based network graph, while a simulation, provides a significantly more intuitive and visually analytical way to explore entity relationships than simple lists, aligning with Palantir-style interfaces.
- Multi-Map Integration with Contextual Linking: The dashboard effectively uses multiple Leaflet maps that are not just static displays but are interactively linked to other data components (e.g., alerts list, subsidiary details).
- Demonstrating AI Potential via Simulation: We're proud of how the simulated AI interactions give a tangible feel for how a powerful engine like Sonar API could drive deep insights, summarization, and querying within a complex financial dashboard.
- Comprehensive Feature Set for a Frontend Demo: The range of functionalities covering asset management, market analysis, network exploration, and alerting, all driven by mock data and frontend logic, showcases a robust application concept.
What we learned
- Frontend Simulation of Complex Systems: This project was a deep dive into simulating backend API calls and AI processing on the client-side, a valuable skill for rapid prototyping and conveying complex ideas.
- Advanced JavaScript & DOM Manipulation: We extensively used vanilla JavaScript for dynamic UI updates, SVG manipulation, managing map instances, and orchestrating interactions between different dashboard modules.
- Modular Design for Scalability: Structuring the code into distinct modules for each dashboard section was crucial for managing complexity and allowing for iterative feature additions.
- The Power of Interactive Data Visualization: Combining maps, simulated graphs, and interactive lists proved to be a powerful way to present interconnected financial and corporate intelligence.
- Designing for a Specific Persona: Focusing on Bruce Wayne's needs helped in prioritizing features and shaping the dashboard's overall tone and functionality.
What's next for GOTHAM: Financial Intelligence
- True AI Integration: Replace all simulated AI calls by integrating with a live, powerful LLM and search API like Perplexity Sonar API or Google's Gemini API. This would unlock genuine natural language querying, real-time advanced analytics, and dynamic insight generation.
- Live Data Feeds: Connect to real-time financial market data, global news APIs, and potentially corporate registry APIs to populate the dashboard with live, actionable information.
- Backend & Database Implementation: Develop a robust backend (e.g., Python/Node.js) and a secure database (e.g., PostgreSQL, Firestore) to manage persistent data, user accounts, investigation case files, and handle complex queries more efficiently.
- Machine Learning for Predictive Insights: Incorporate machine learning models for predictive risk assessment, market forecasting, anomaly detection in financial transactions, and identifying non-obvious network links.
- Enhanced Network Graphing: Integrate a dedicated JavaScript graphing library (e.g., Cytoscape.js, D3.js, Vis.js) for more advanced layout algorithms, filtering, clustering, and temporal analysis of network data.
- Collaborative Tools & Reporting: Develop features for secure collaboration on investigations (if used by a team like Bruce, Lucius, and Alfred) and more sophisticated, customizable report generation.

Log in or sign up for Devpost to join the conversation.