What Inspired Us
Hunger is one of the most fundamental human senses — and yet, surprisingly, one of the least understood by the people who experience it every day.
We started by asking a deceptively simple question: Why do people eat the wrong things at the wrong times, even when they're trying to do better? The answer wasn't willpower or knowledge — it was signal blindness. Most people genuinely cannot read their own hunger accurately. They confuse physical fullness with satiation. They eat past comfort without realizing it. They skip meals until their energy crashes. And they have no way of knowing, in the moment of choice, how a meal will affect them two hours from now.
This gap between the body's signals and our conscious awareness of them felt like exactly the kind of invisible, unmeasurable human experience the challenge was asking us to tackle. Hunger isn't just one sensation — it has two distinct dimensions: gastric stretch (how physically full your stomach is) and satiation (how satisfied and energized you feel). These two things often diverge wildly — think of how you can eat a huge salad and feel physically stuffed but hungry again in an hour, versus a small, protein-rich meal that keeps you going all day. We wanted to make that invisible distinction visible.
The inspiration was also deeply personal. Our team had experienced the frustration of intuitive eating gone wrong — eating by guesswork, suffering afternoon energy crashes, or realizing too late that a meal had set off a difficult few hours. We wanted a tool that didn't tell you what to eat, but gave you the perceptual clarity to make better decisions yourself.
The Core Idea
Pangea is a speculative biometric tool that quantifies and visualizes hunger as a continuous, real-time sense — broken down into its two components: stretch and satiation. Using a biosensor (which could take the form of a wearable patch, a pill sensor, or an integration with a future generation of smart devices), the tool translates internal gut signals into a living, ambient visualization that users carry with them throughout the day.
The central visual metaphor is an amorphous, animated shape — almost organic in feel. Its size reflects gastric stretch (how full your stomach physically is). The density and stillness of its contents reflects satiation (how stable and energized you feel). When you're in your ideal state, the shape glows gently and moves smoothly — almost like a flow state made visible. When you're overfull, it feels bloated and jarring. When you're running low, it shrinks and flickers with barely-there energy.
Users set a personal ideal hunger level (on a 1–10 scale), and the tool orients everything around helping them stay close to that state — not by prescribing what to eat, but by giving them the perceptual data to decide for themselves.
The Three User Groups We Designed For
Through our early discussions, we identified three distinct people this tool serves:
People who can't read their own hunger signals — those who either don't notice they're hungry until they're ravenous, or don't realize they're overfull until they're uncomfortable.
Intuitive eaters who rely on guesswork — people who eat by feel but have no reliable way of predicting how long a meal will sustain them or what effect different foods have on their energy.
Busy people who don't have time to plan — those who need to make fast food decisions (at a café, reading a menu, grabbing something on the go) and want to know in the moment what will actually keep them going.
Key Features
The Living Hunger Visualization
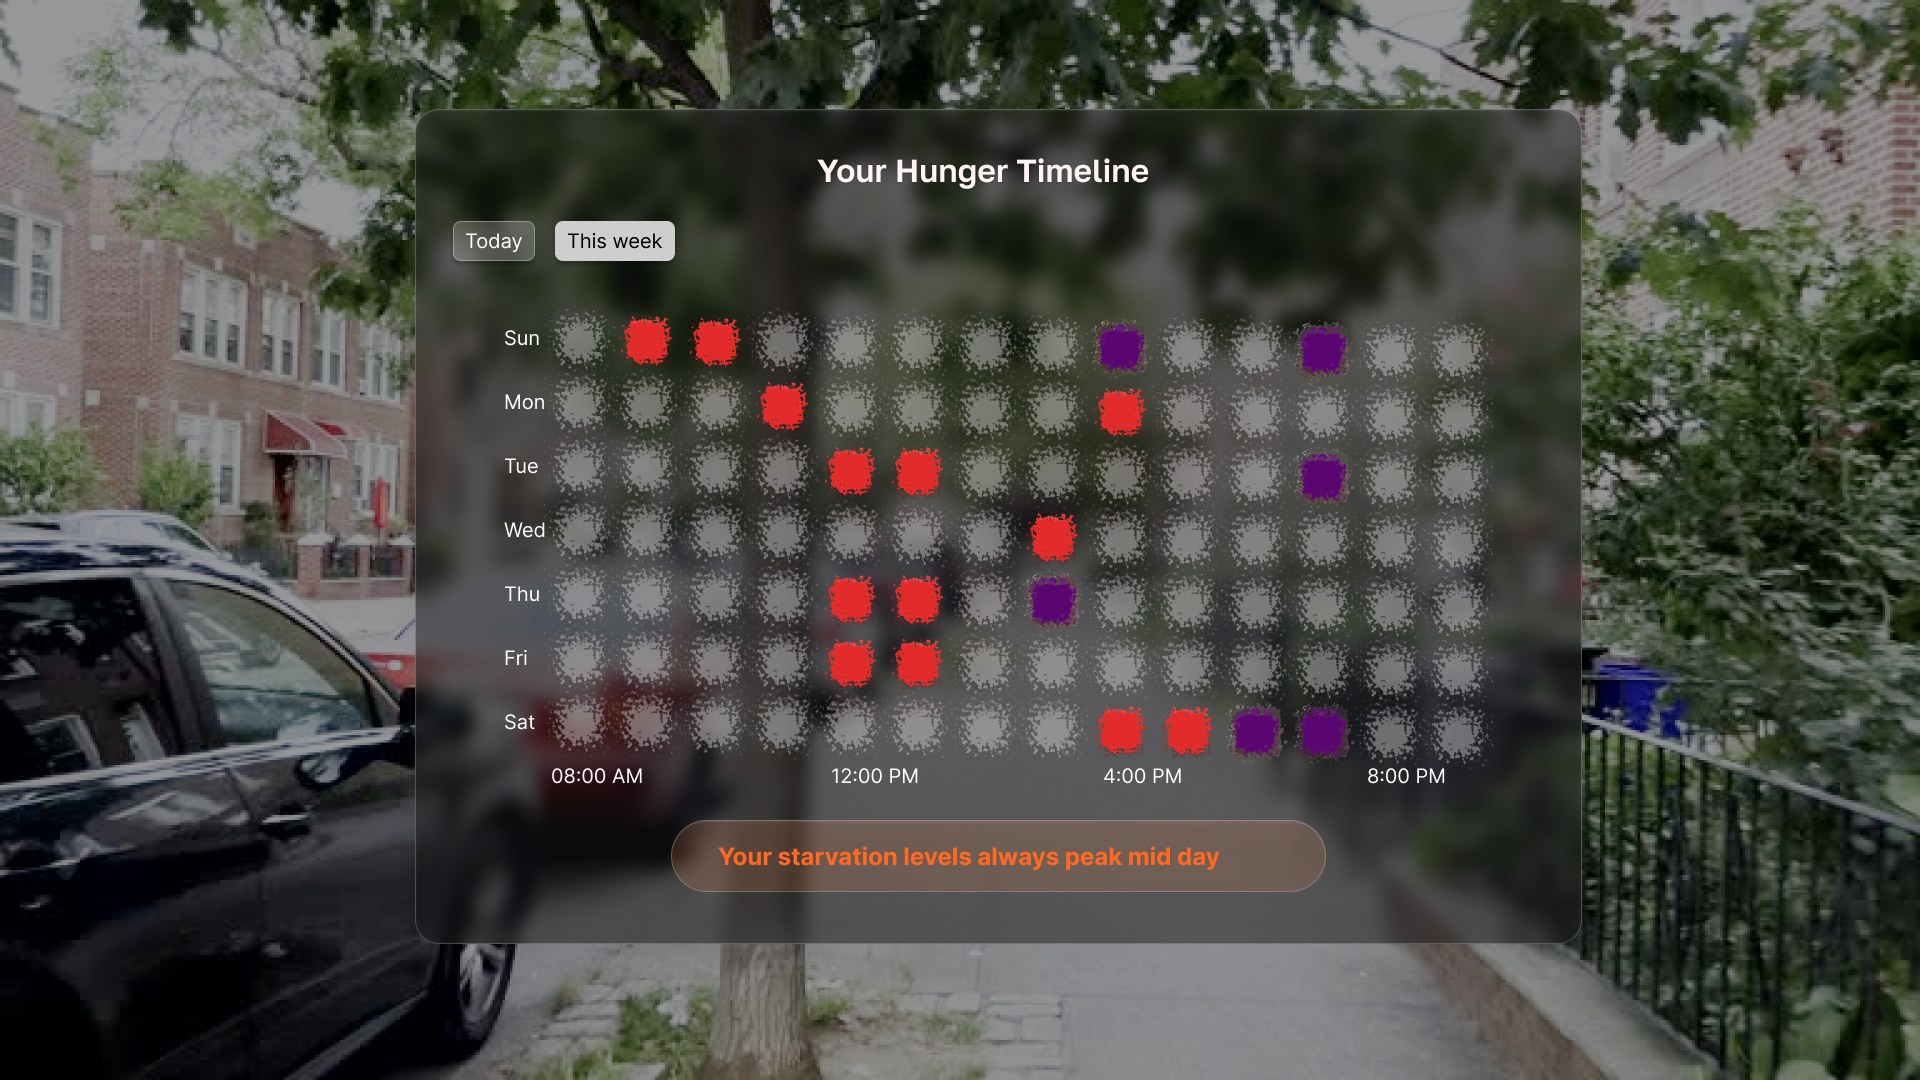
A real-time ambient display — always accessible, never intrusive — that shows the user's current hunger state as the dual-axis animated shape. Users can drag across a timeline (similar to a weather app's hourly forecast) to see how their hunger has changed and where it's predicted to go.
Predictive Meal Overlay
When a user is looking at a menu or scanning a food option, Pangea plays a short animated preview of what their hunger visualization is predicted to look like over the next 2–3 hours if they eat that item — based on its nutritional composition and the user's personal history with similar foods. This turns a moment of guesswork into an informed, visual decision.
Personal Hunger Calibration
Users set their ideal hunger state and the tool learns their patterns over time — personalizing predictions and nudging them toward consistency without prescribing behavior.
Challenges We Faced
1. Designing for Two Data Points in One Visual
The hardest design problem was communicating both stretch and satiation simultaneously without creating confusion. We went through several iterations — volume vs. color, size vs. motion — before landing on the shape-as-volume / dots-as-satiation metaphor. The key insight was that the visual needed to be felt more than read: you shouldn't have to analyze it, you should just know when something feels off.
2. Defining the Sensor Without Designing the Sensor
Because this is a speculative design challenge, we had to be honest that the underlying biosensing technology doesn't yet exist in the form we imagined. Rather than committing to a single hardware form factor (implant, pill, patch, wearable), we chose to frame the sensor as an open possibility — the experience layer is the point, and multiple sensing modalities could feed into it as the technology matures.
3. Avoiding Information Overload
A tool that makes hunger legible risks making it obsessive. We were conscious that for some users — particularly those with histories of disordered eating — granular, real-time body data could be harmful rather than helpful. This led us to design the visualization as ambient rather than dashboard-style: present when you need it, not constantly demanding attention. We also built in safeguards around onboarding (users can choose their level of data visibility) and are considering opt-in modes for users in recovery contexts.
4. Making It Feel Alive, Not Clinical
Health apps tend to look medical — cold, numerical, chart-heavy. We deliberately moved away from that. The organic, animated visualization was our way of making the data feel like an extension of your body rather than a readout from a machine. The goal was for users to feel more connected to their physical experience, not alienated from it by abstraction.
What We're Most Proud Of
We're proud that Pangea addresses something genuinely invisible — a sense everyone has but almost no one can articulate clearly — and makes it legible without making it overwhelming. The dual-axis visualization is novel, the predictive overlay solves a real moment of decision-making friction, and the personal calibration system respects that there's no universal "right" way to feel hunger.
Most of all, we're proud that this doesn't tell people what to do. It gives them a sense they didn't fully have before — and trusts them to use it.
Safeguards & Responsible Design
- Opt-in data granularity: Users choose how much visibility they want into their hunger data. High-detail mode is not the default.
- Eating disorder sensitivity: Onboarding includes a brief wellbeing check; users flagged as being in recovery are offered a simplified, non-numerical experience mode.
- No food moralizing: The tool never labels foods as "good" or "bad." It only reflects your personal physiological response.
- Data privacy: All biometric data is processed on-device and never sold or shared with third parties, including food brands or advertisers.
- Emergency signal: If sensors detect an extended period of critically low hunger signals, the tool surfaces a gentle check-in prompt.
Built With
- claude
- figma


")

Log in or sign up for Devpost to join the conversation.