-
OOS
-
Backtest_log
-
Backtest_linear
Inspiration
What happens while the market sleeps? Research on persistent overnight returns inspired us to build Overnight Drift and test whether that pattern could support a practical trading strategy.
What it does
Overnight Drift ranks 500 highly traded US stocks by their past year of overnight returns:
$$ r_{\text{overnight},t} = \frac{P_{\text{open},t}}{P_{\text{close},t-1}} - 1 $$
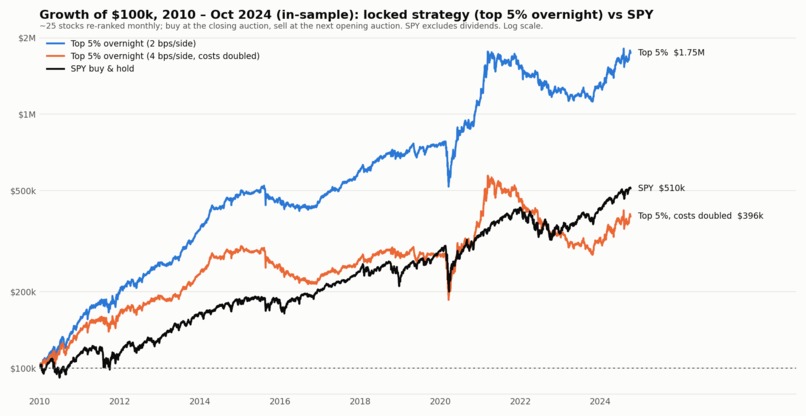
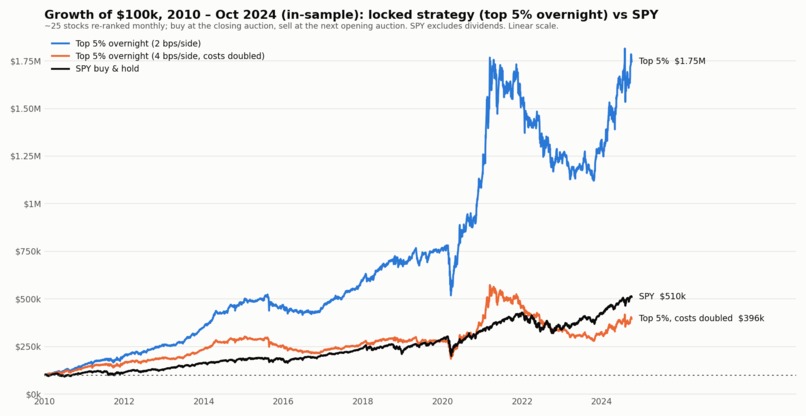
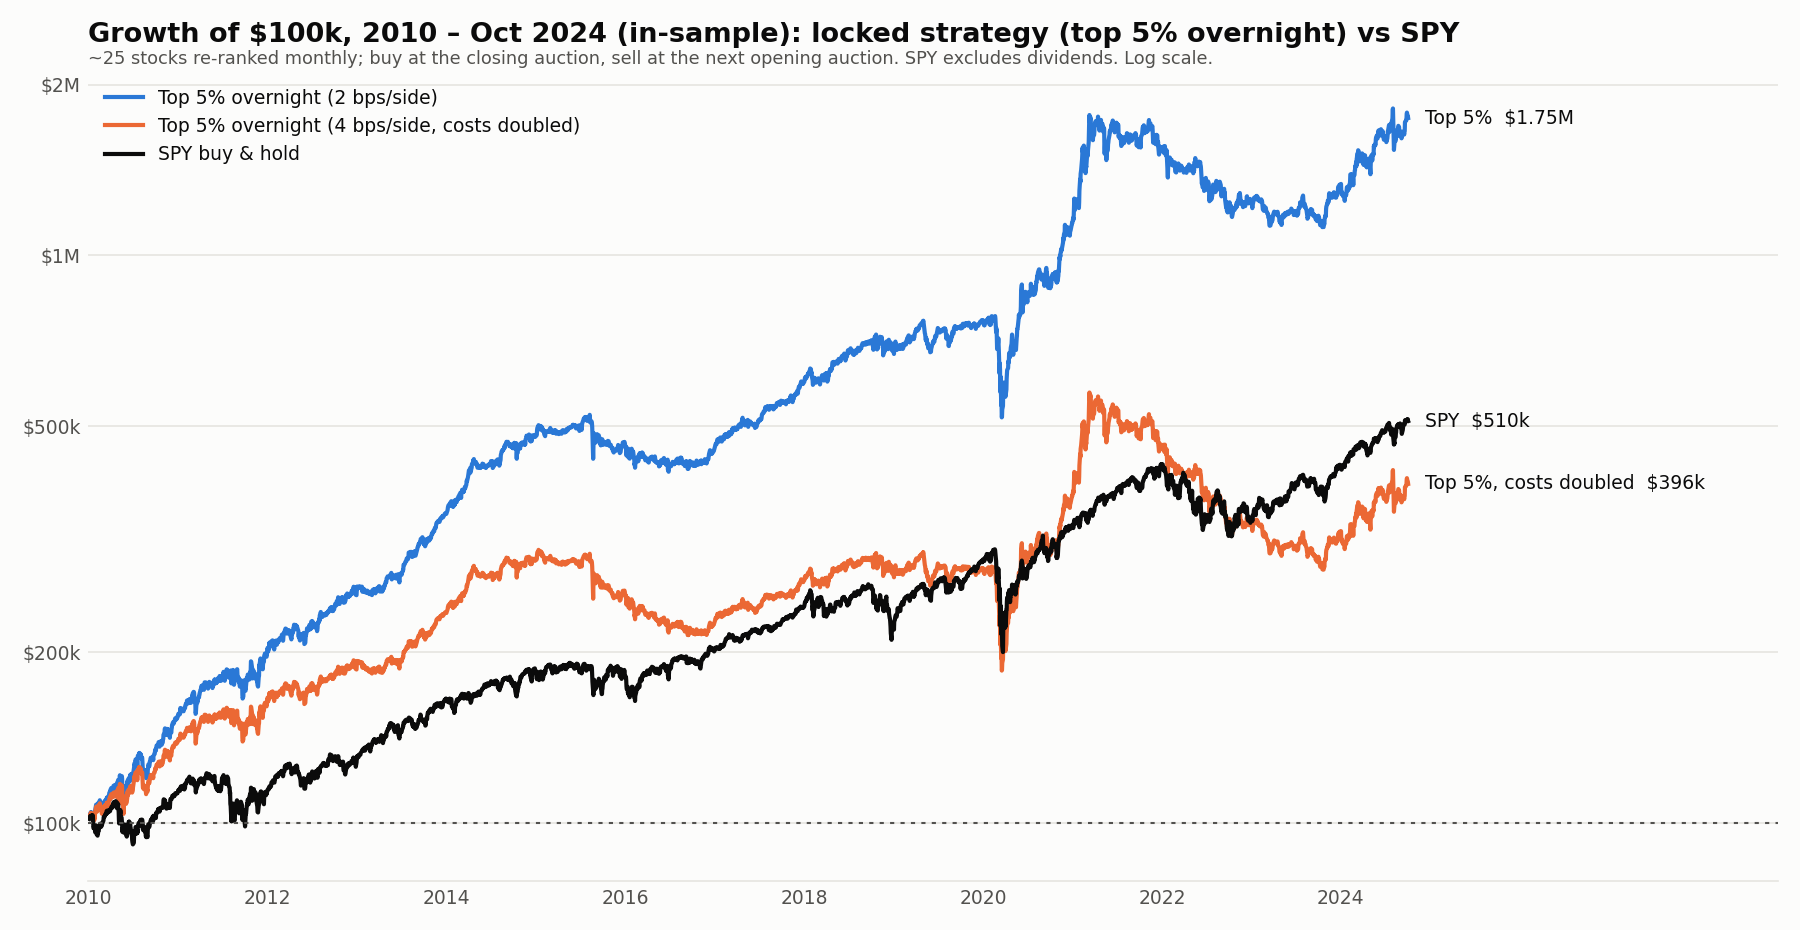
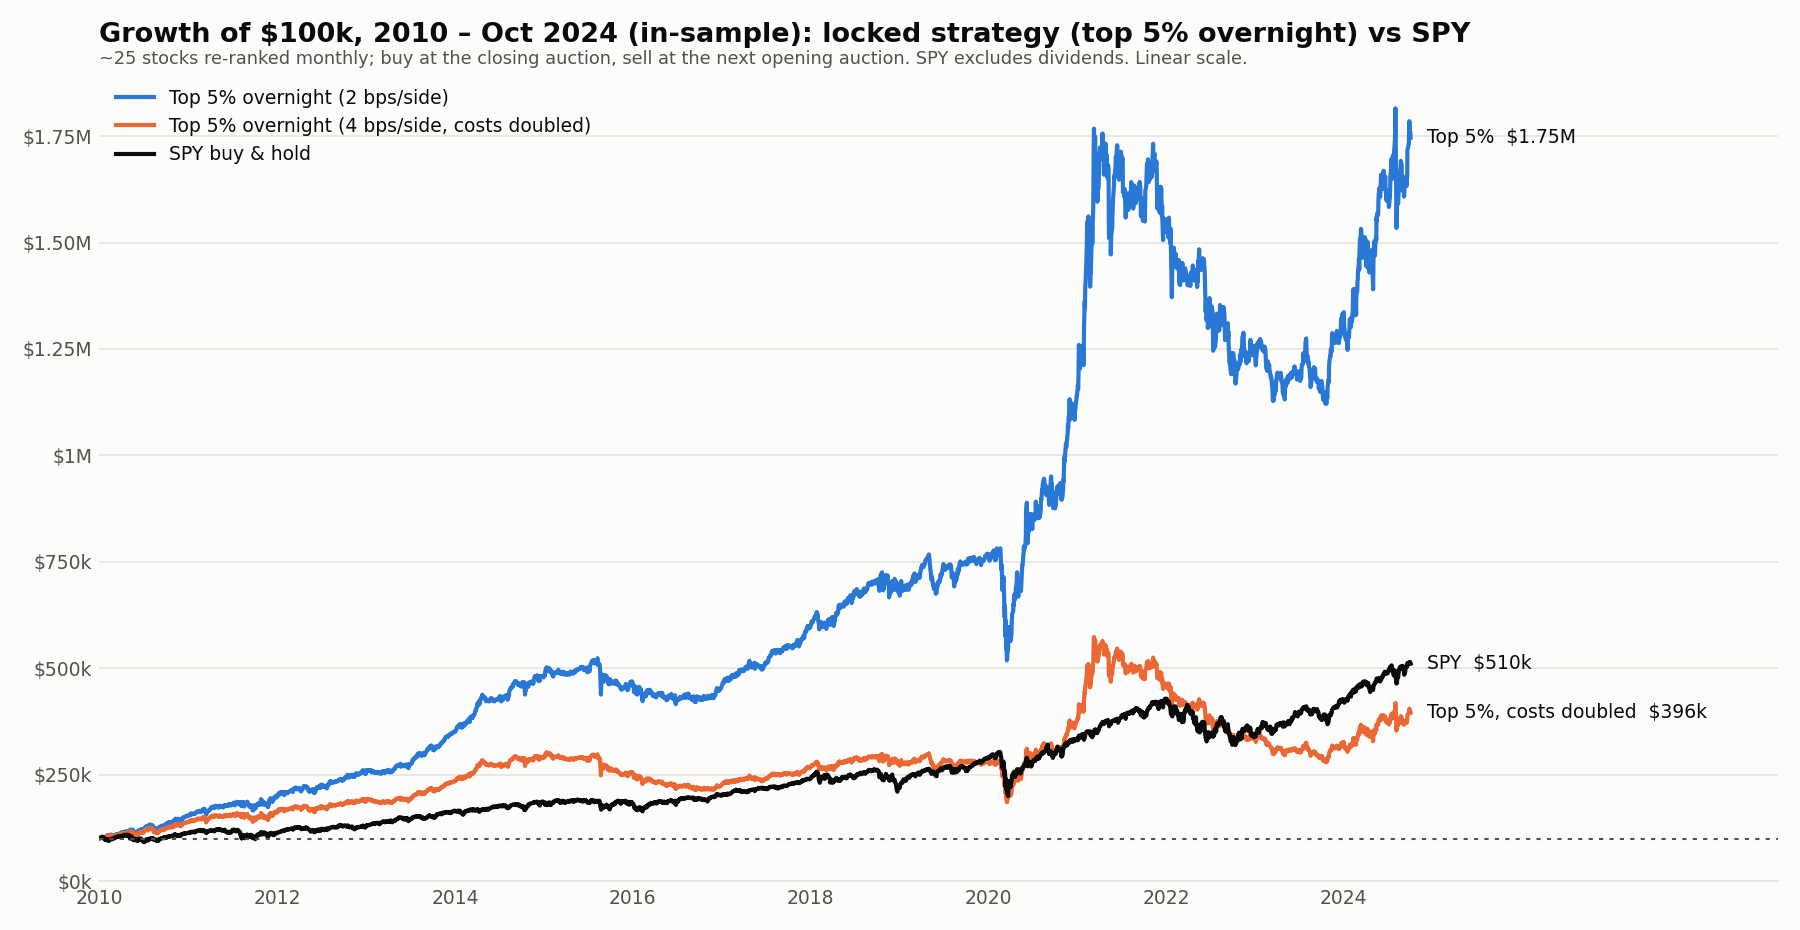
It simulates buying the top 5% at market close and selling at the next open, holding no positions during the day.
How we built it
We used Python, pandas, NumPy, and Massive market data to build a reproducible research pipeline. One command runs the backtests, evaluates risk and trading costs, and generates our charts and results.
Challenges we ran into
The hardest part was making the backtest realistic. Avoiding future information, including stocks that later delisted, checking auction prices, and accounting for daily trading costs all made us pause and reevaluate our approach.
Accomplishments that we're proud of
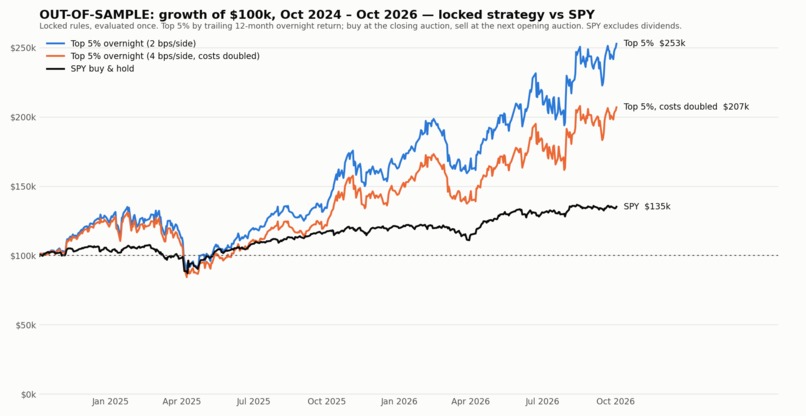
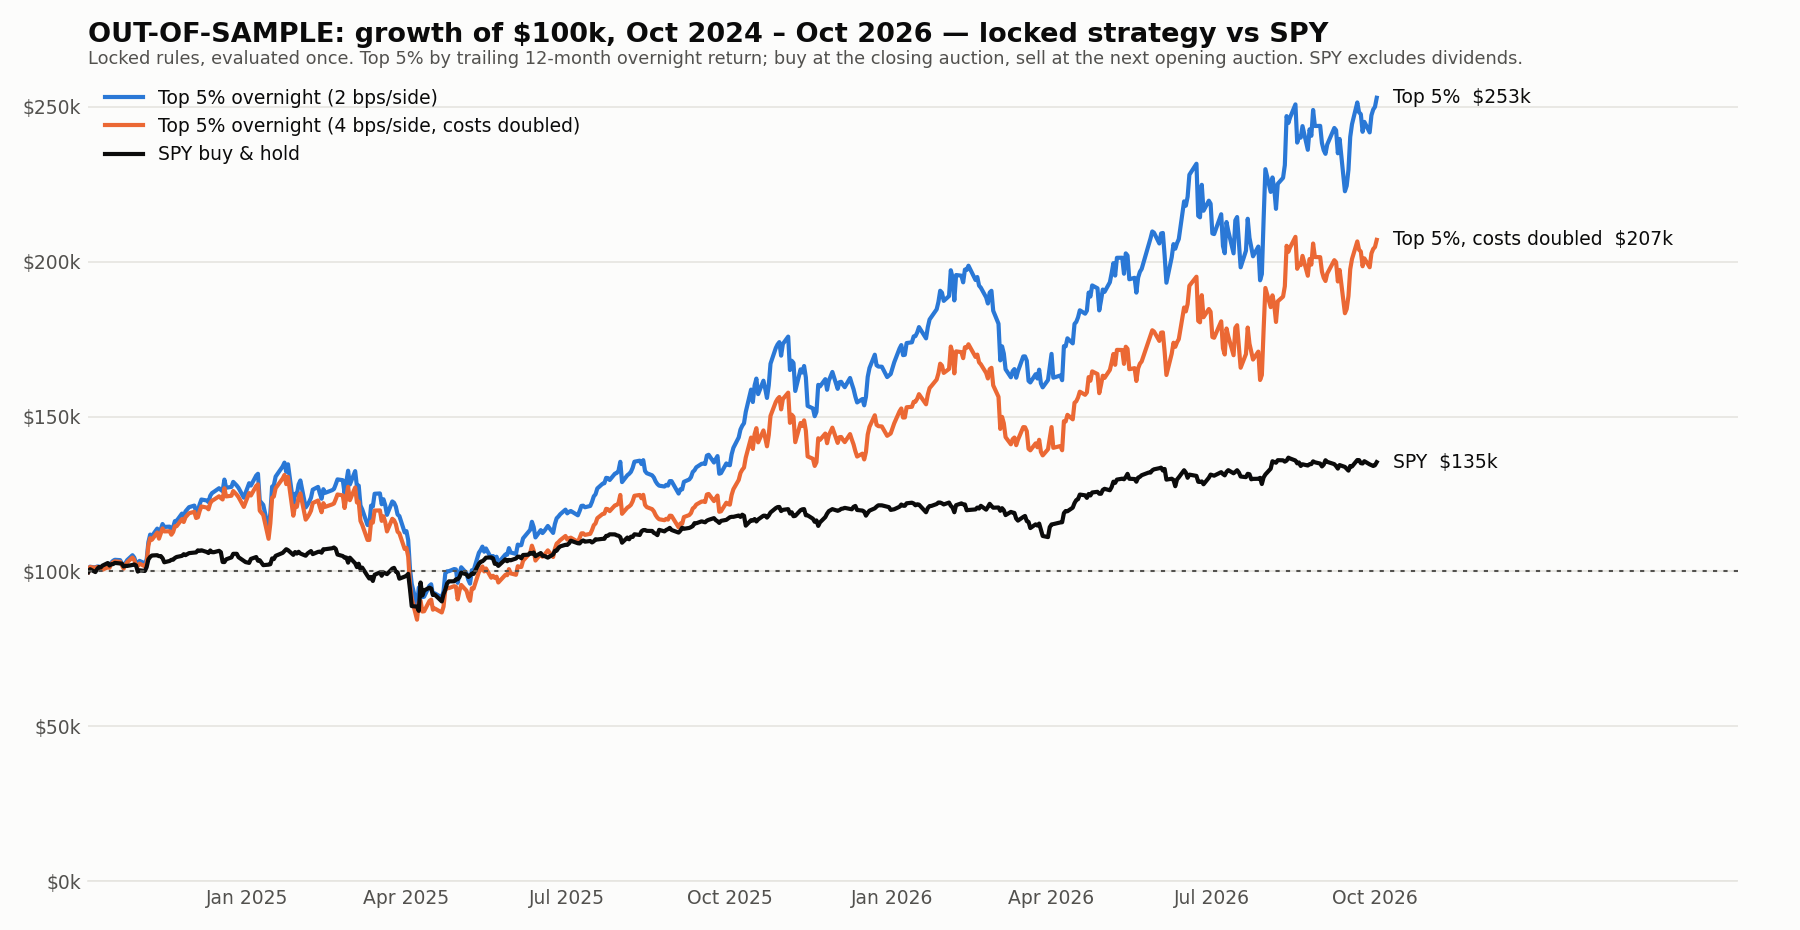
We took a research paper and built a transparent, reproducible, and relatively simple yet effective strategy. Our two-year out-of-sample backtest returned 59.5% annualized after assumed trading costs.
What we learned
Honest testing matters just as much as returns, and small trading costs add up quickly. The former was especially paramount to our growth, as the integrity of our development process gave us confidence in our out-of-sample results.
What's next
Paper trading! We want to know if our strategy holds up with money (albeit fake at first) on the line. More importantly, we want to explore its viability in the face of execution costs and iterate using different risk controls that we were not able to explore in this project.


Log in or sign up for Devpost to join the conversation.