-
-
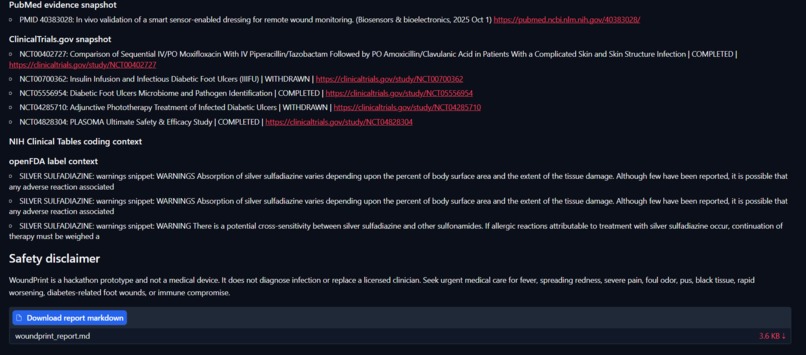
Credibility Info
-
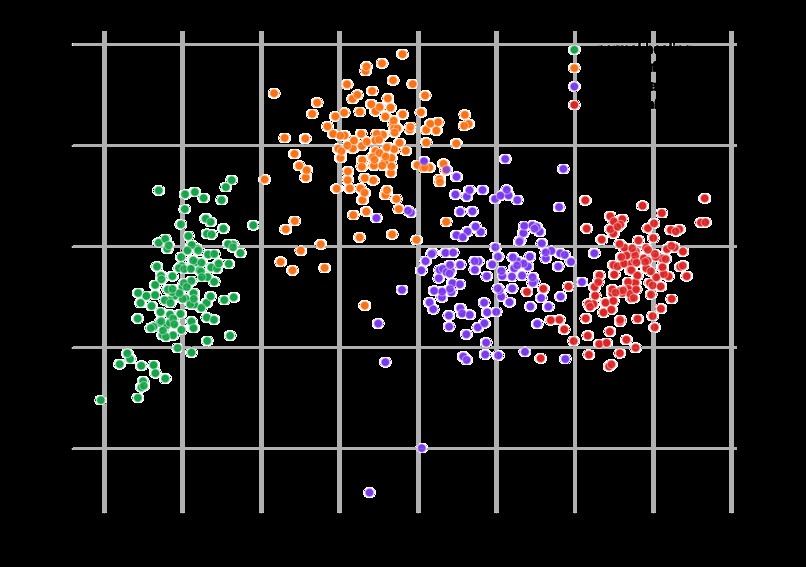
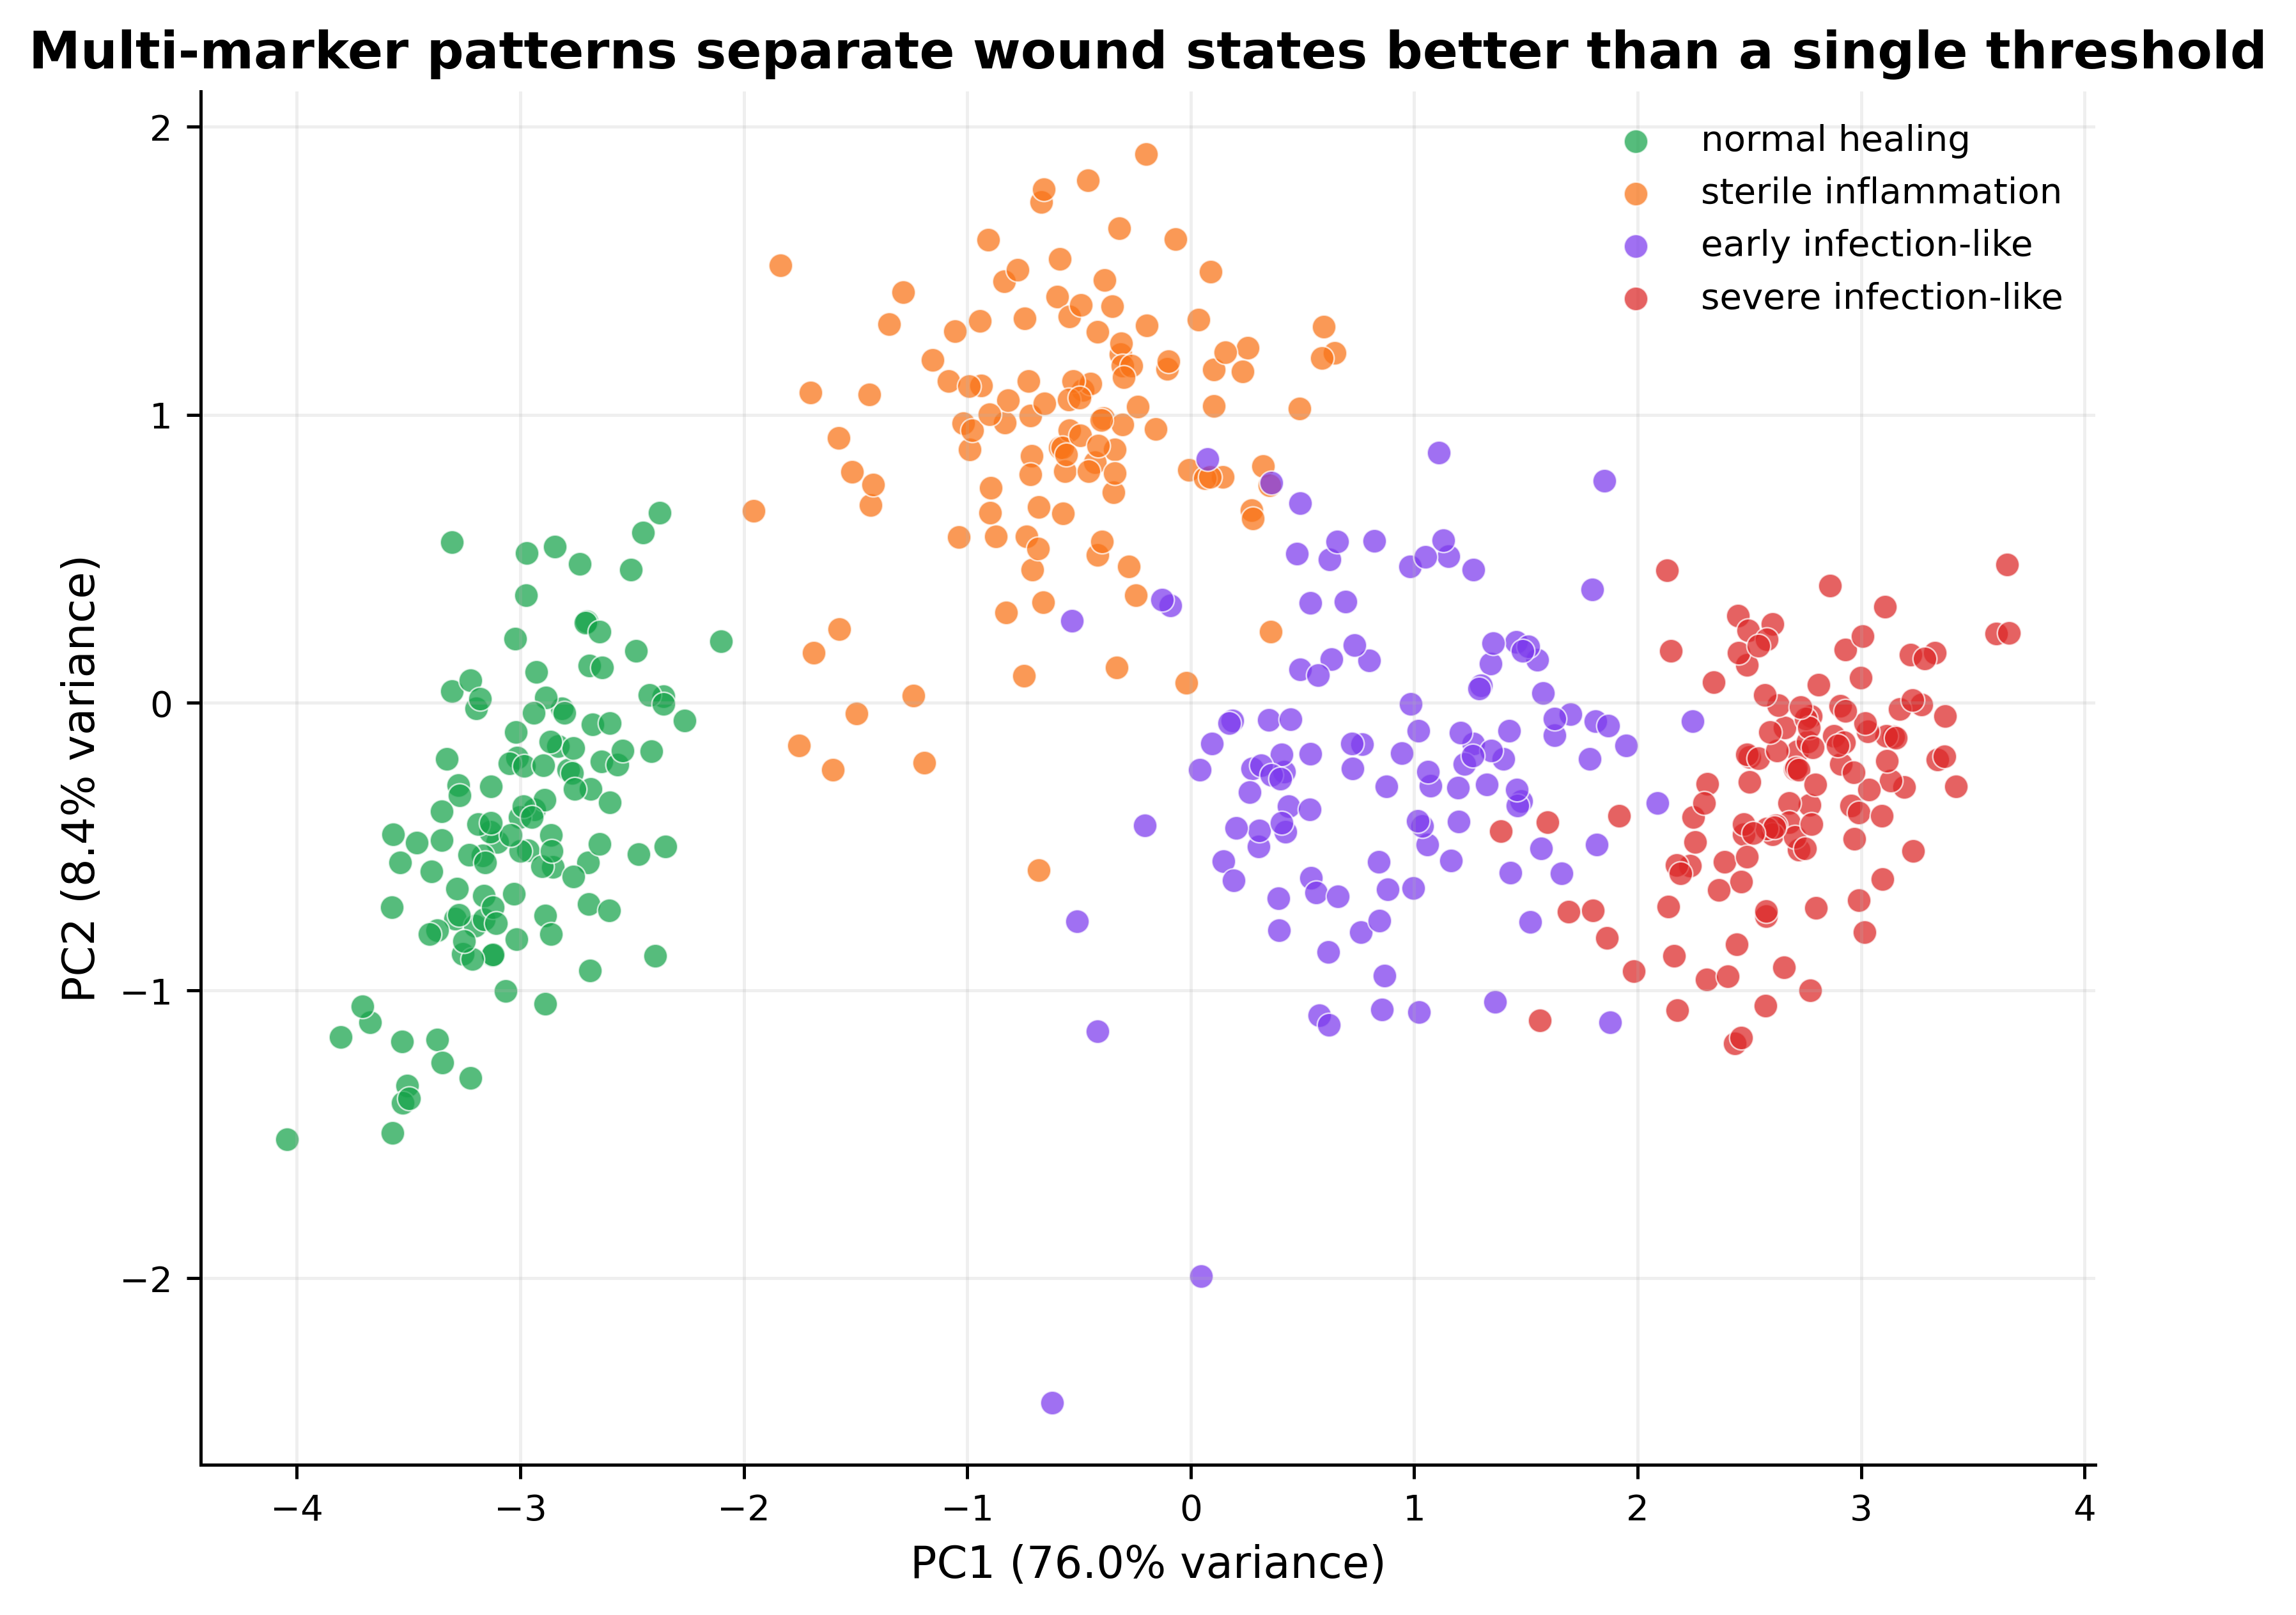
PCA Multimarker Space
-
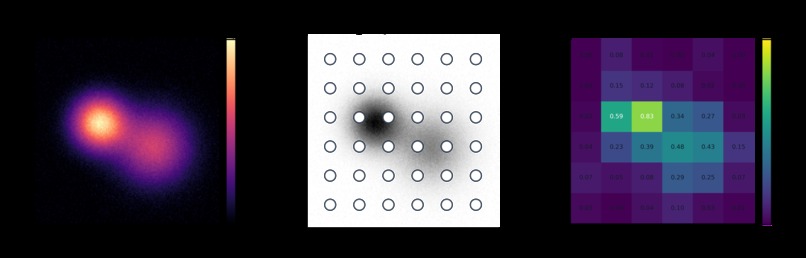
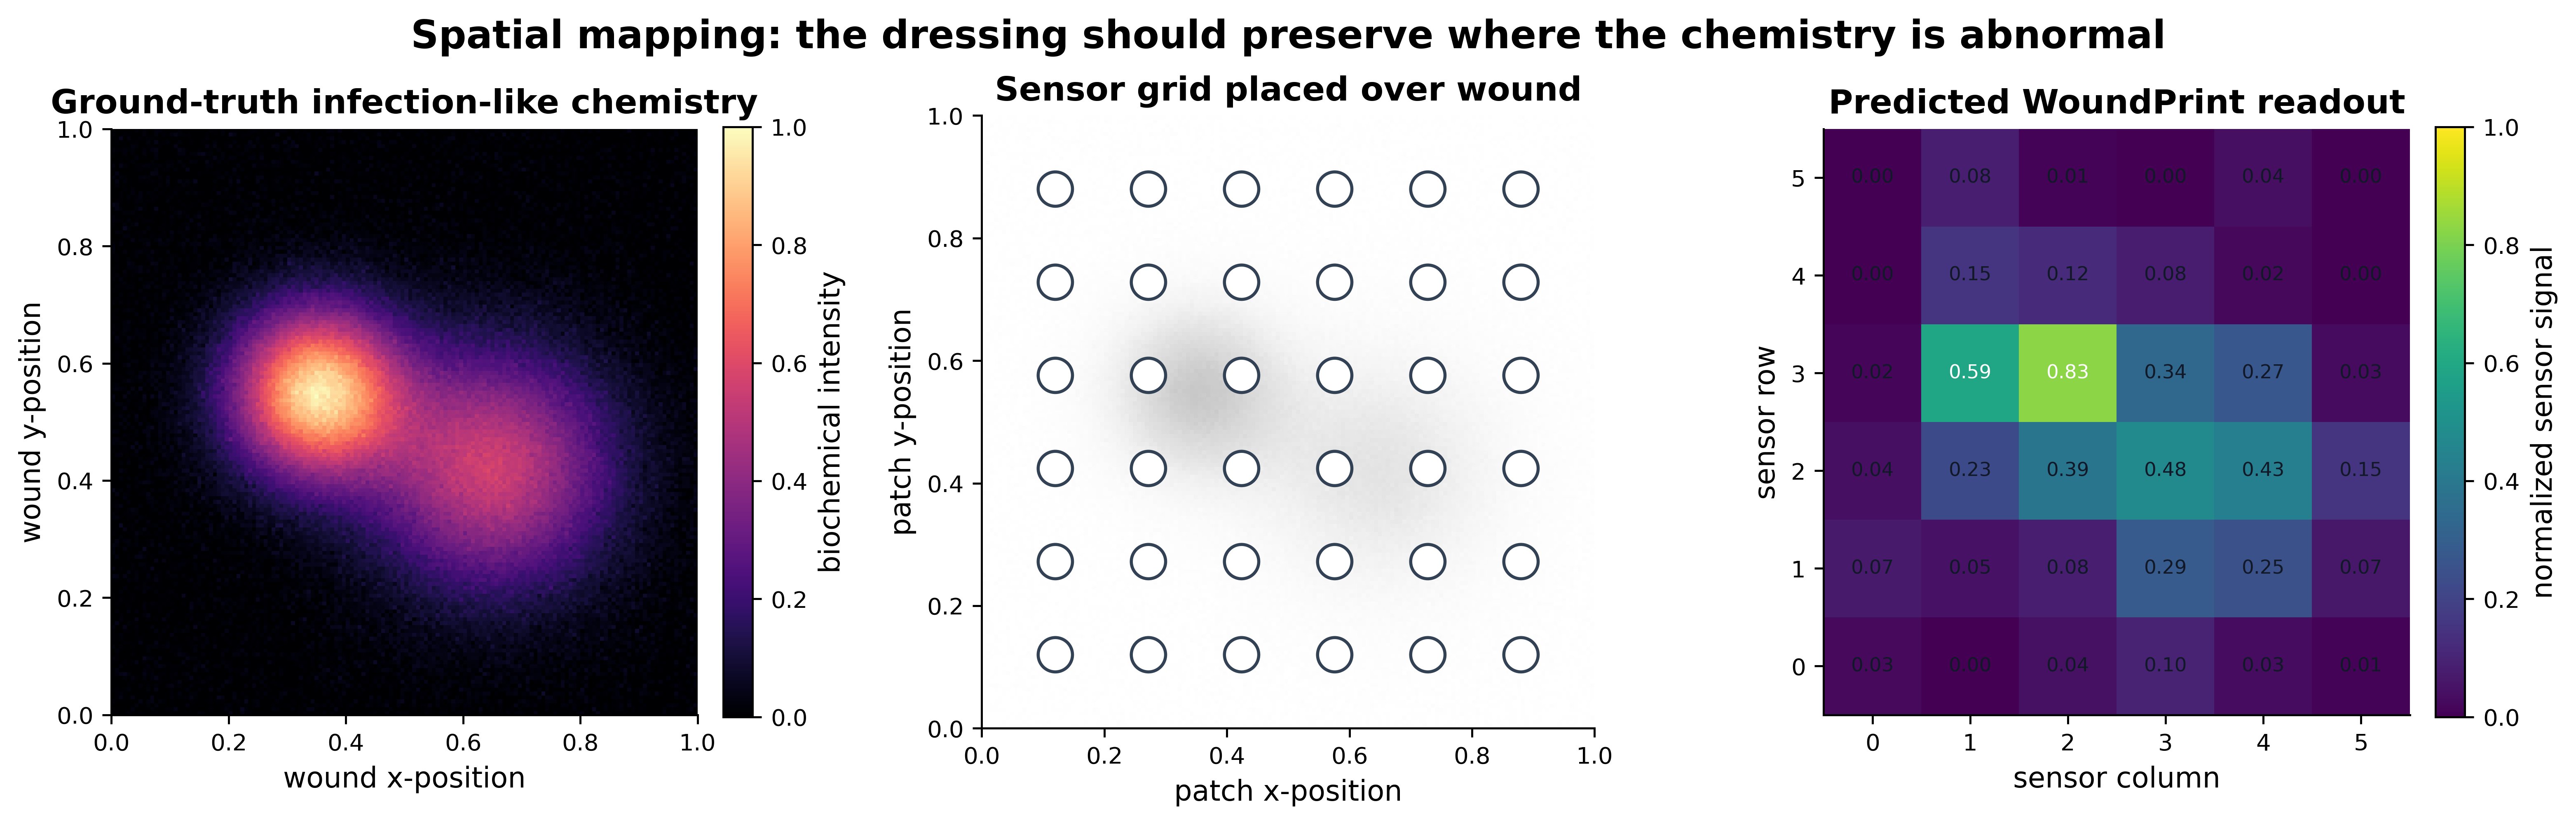
Spatial hotspot mapping
-
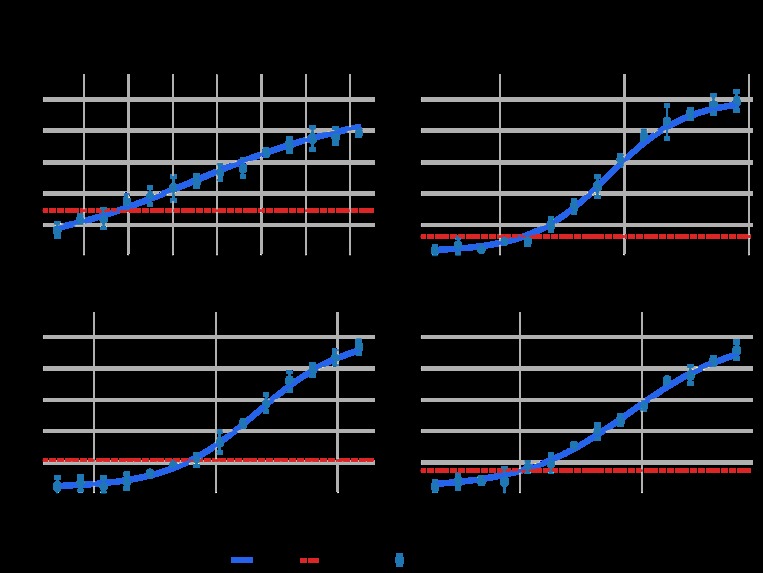
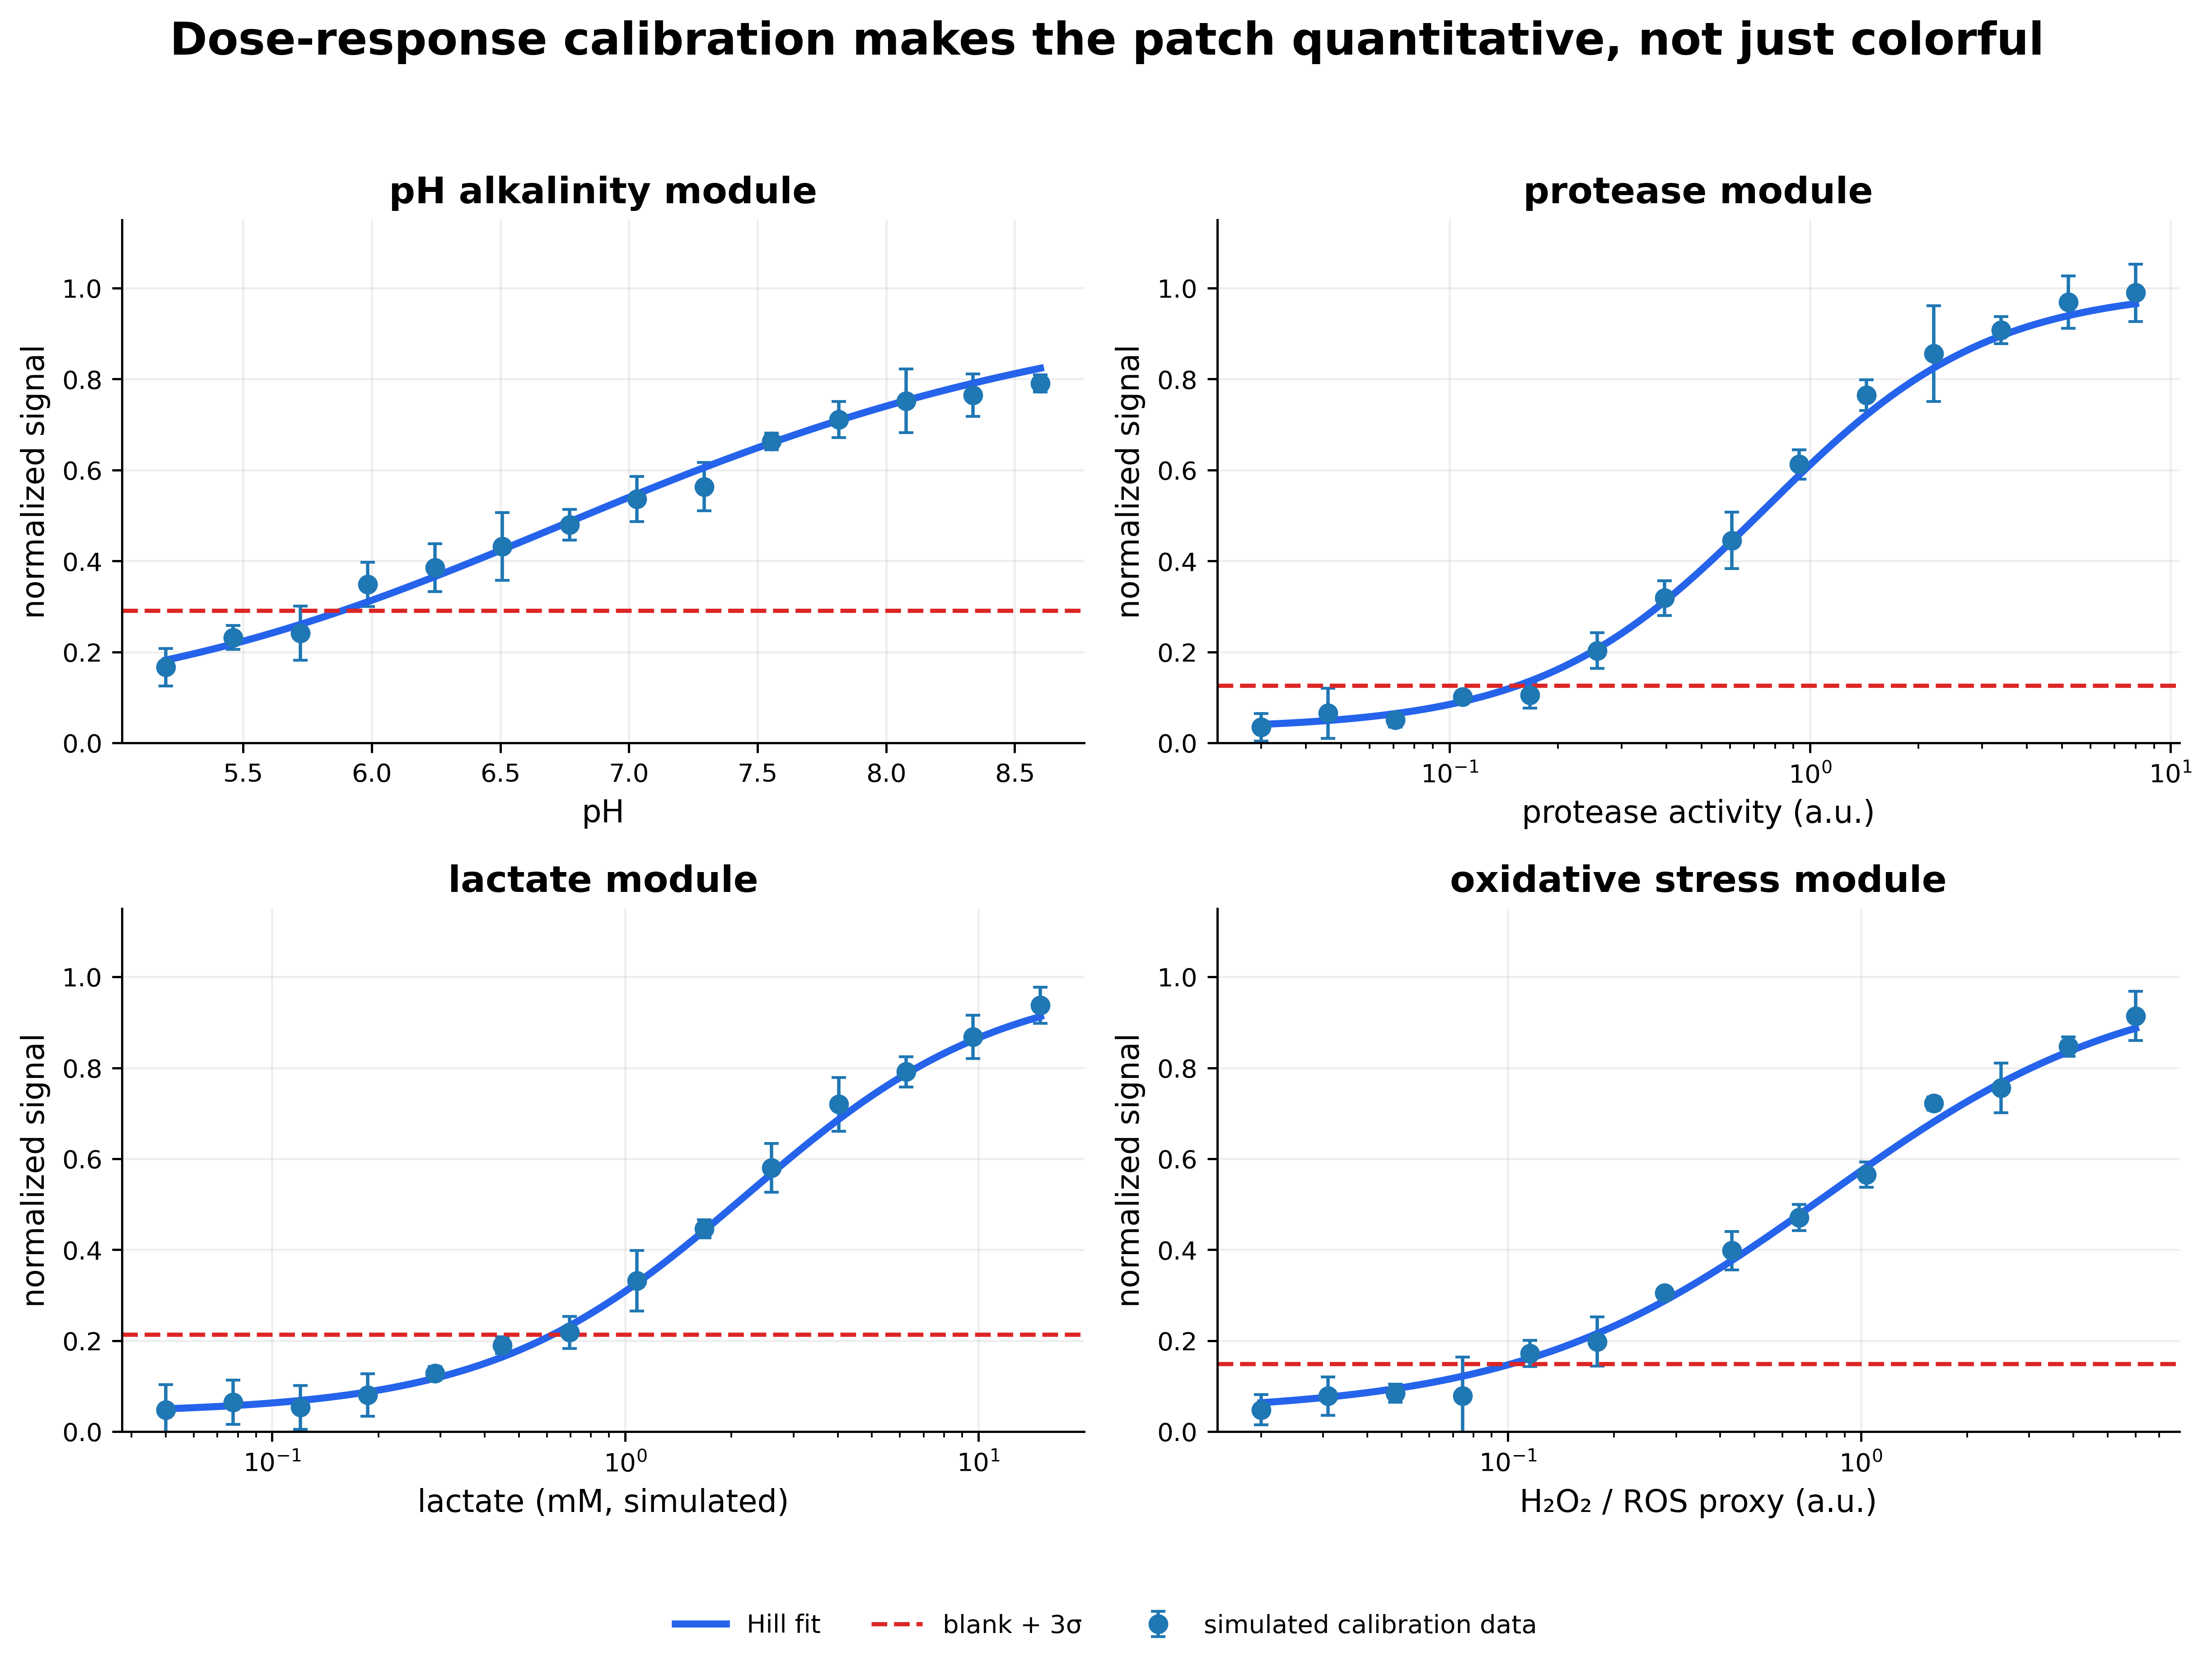
Calibration Curves
-
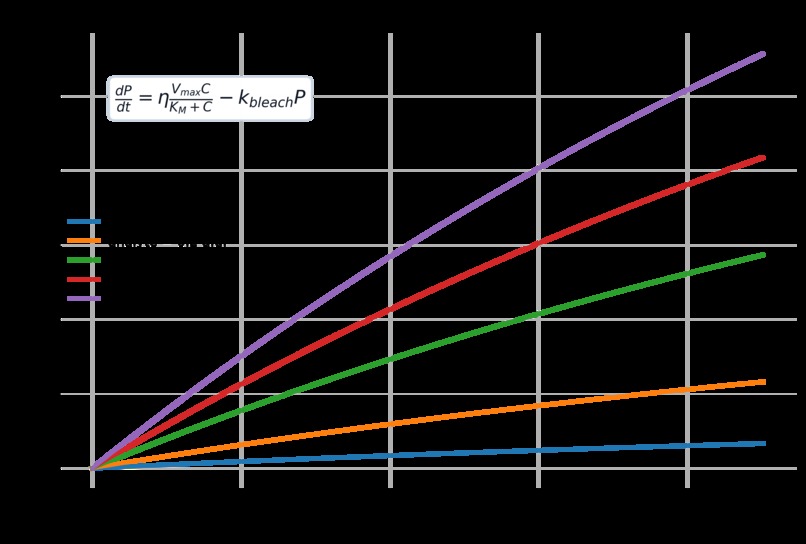
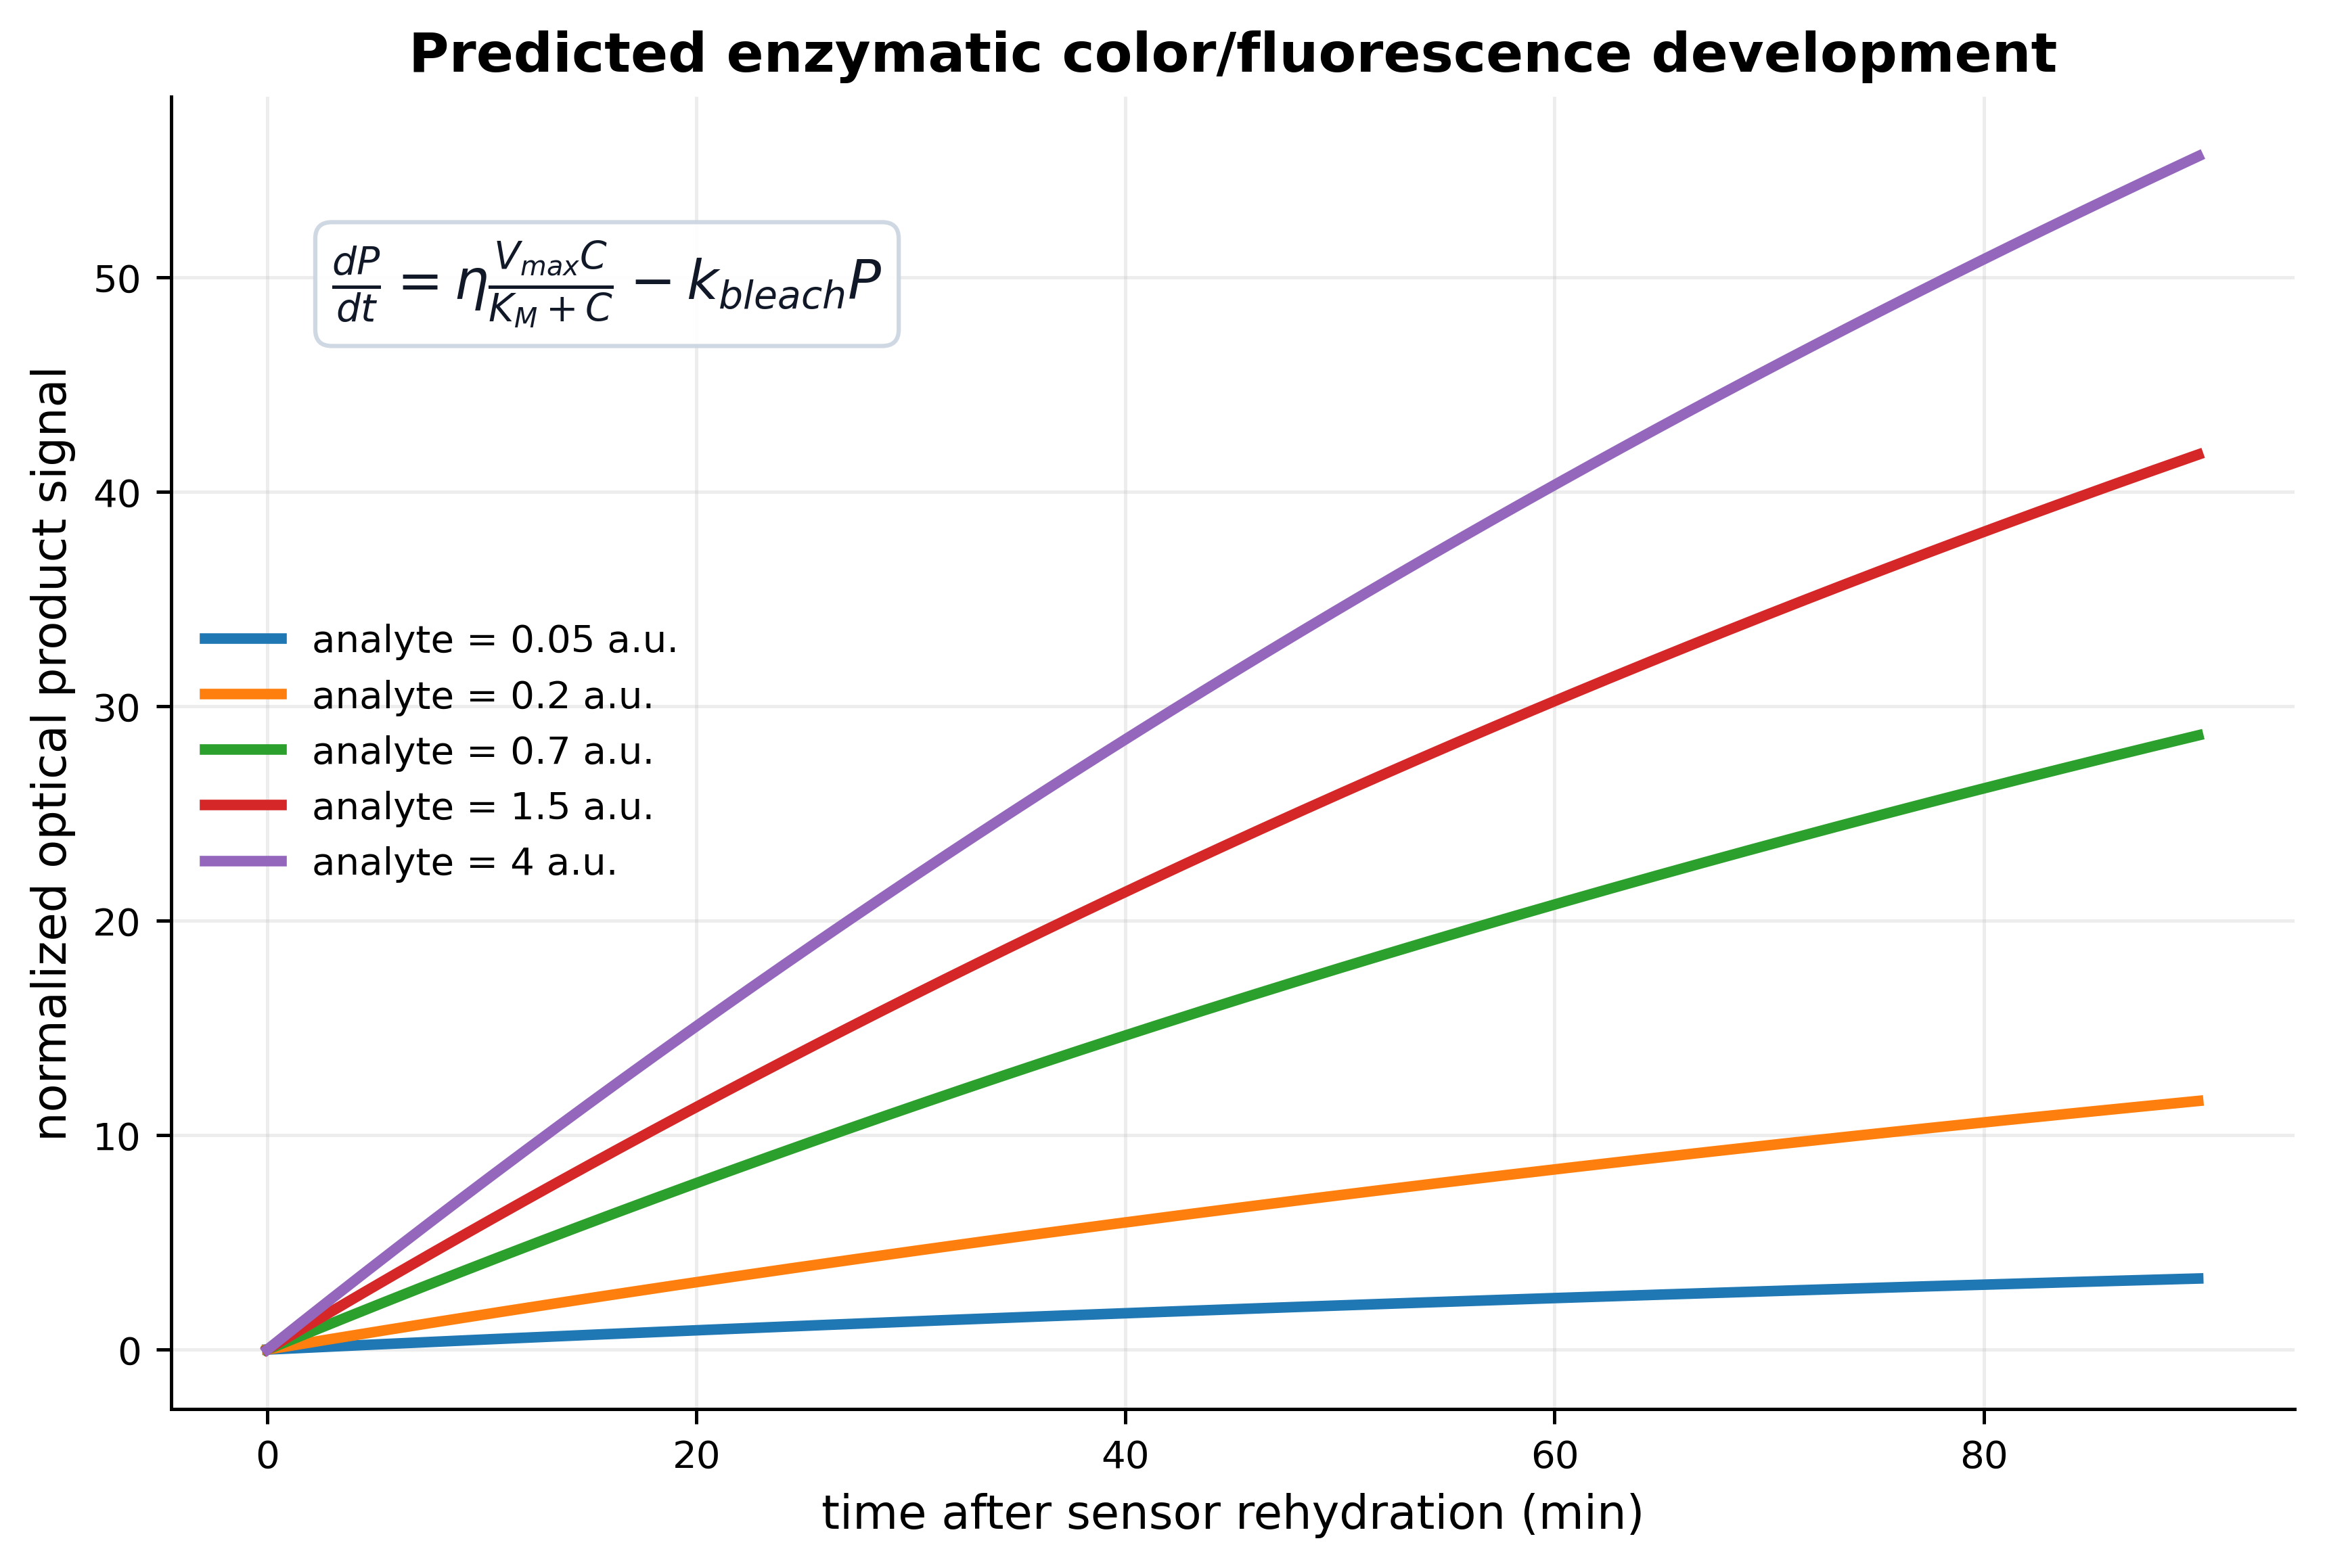
Reaction Kinetics
-
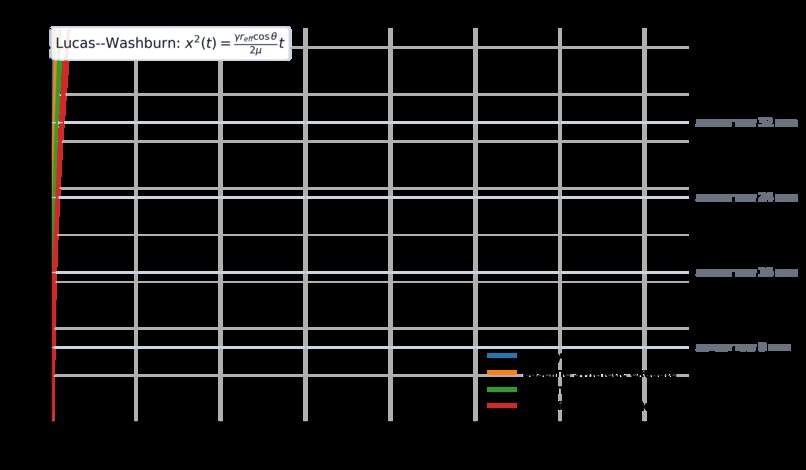
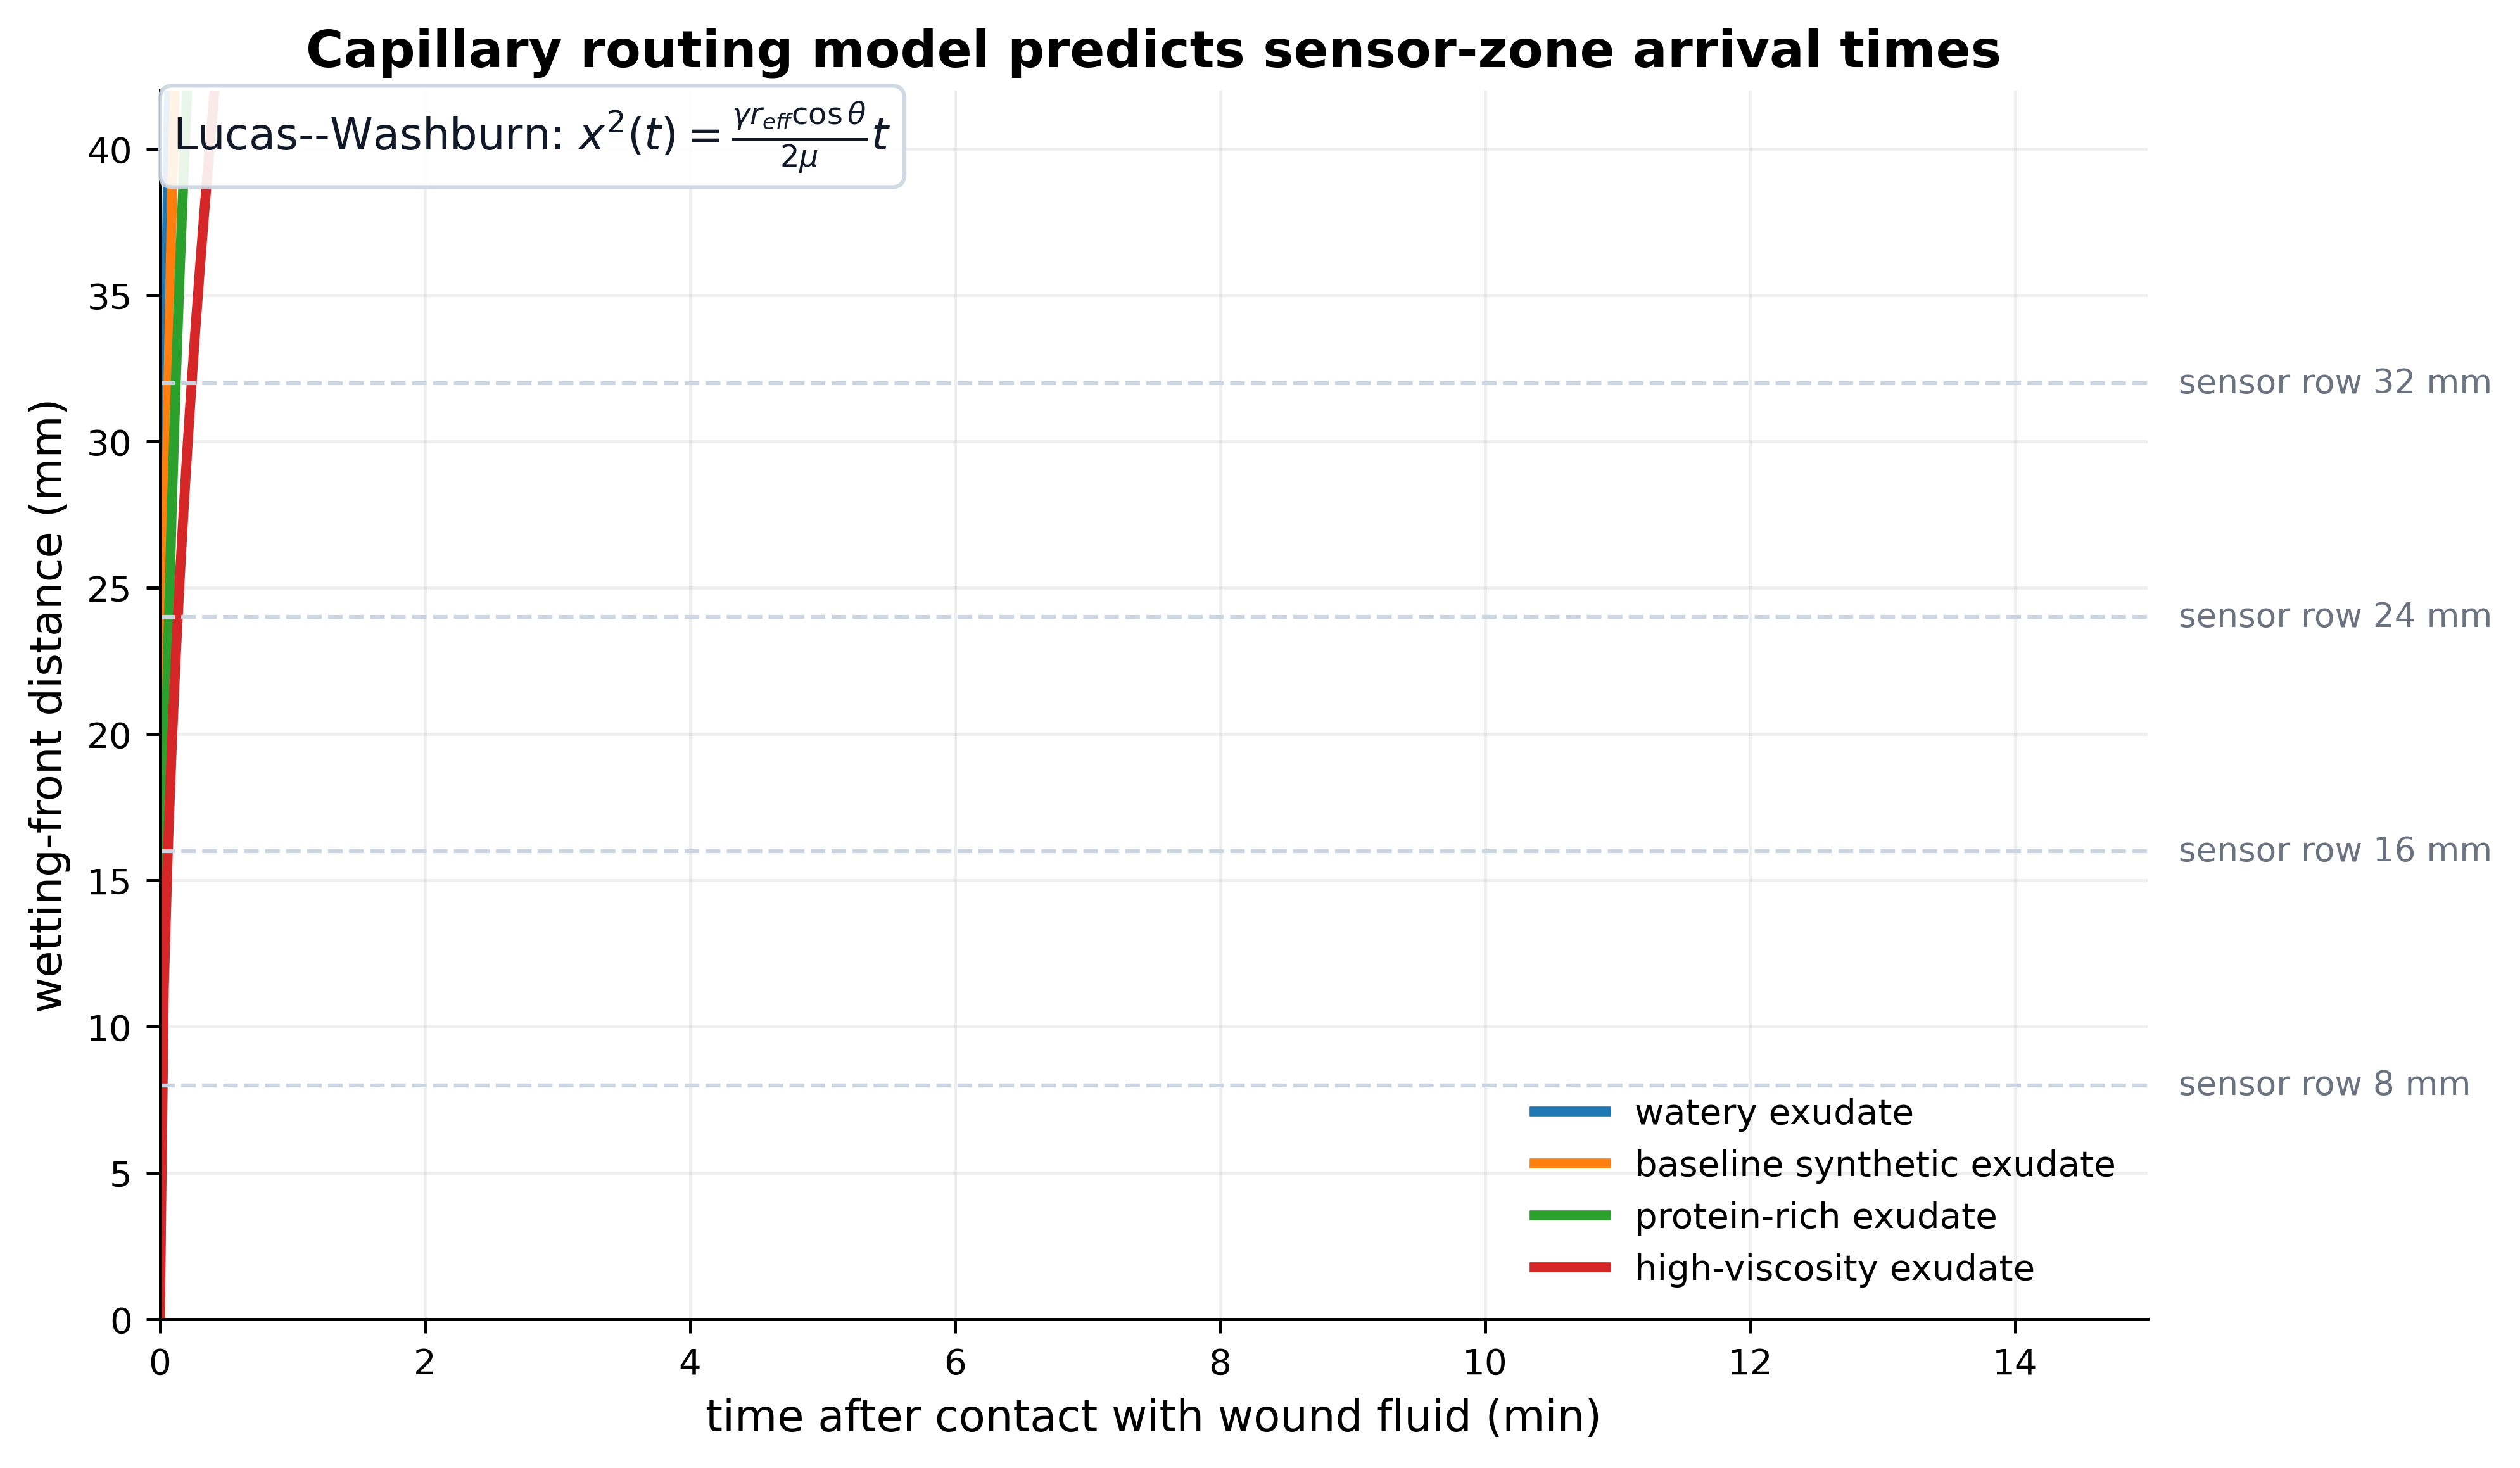
Capillary Flow Model
-

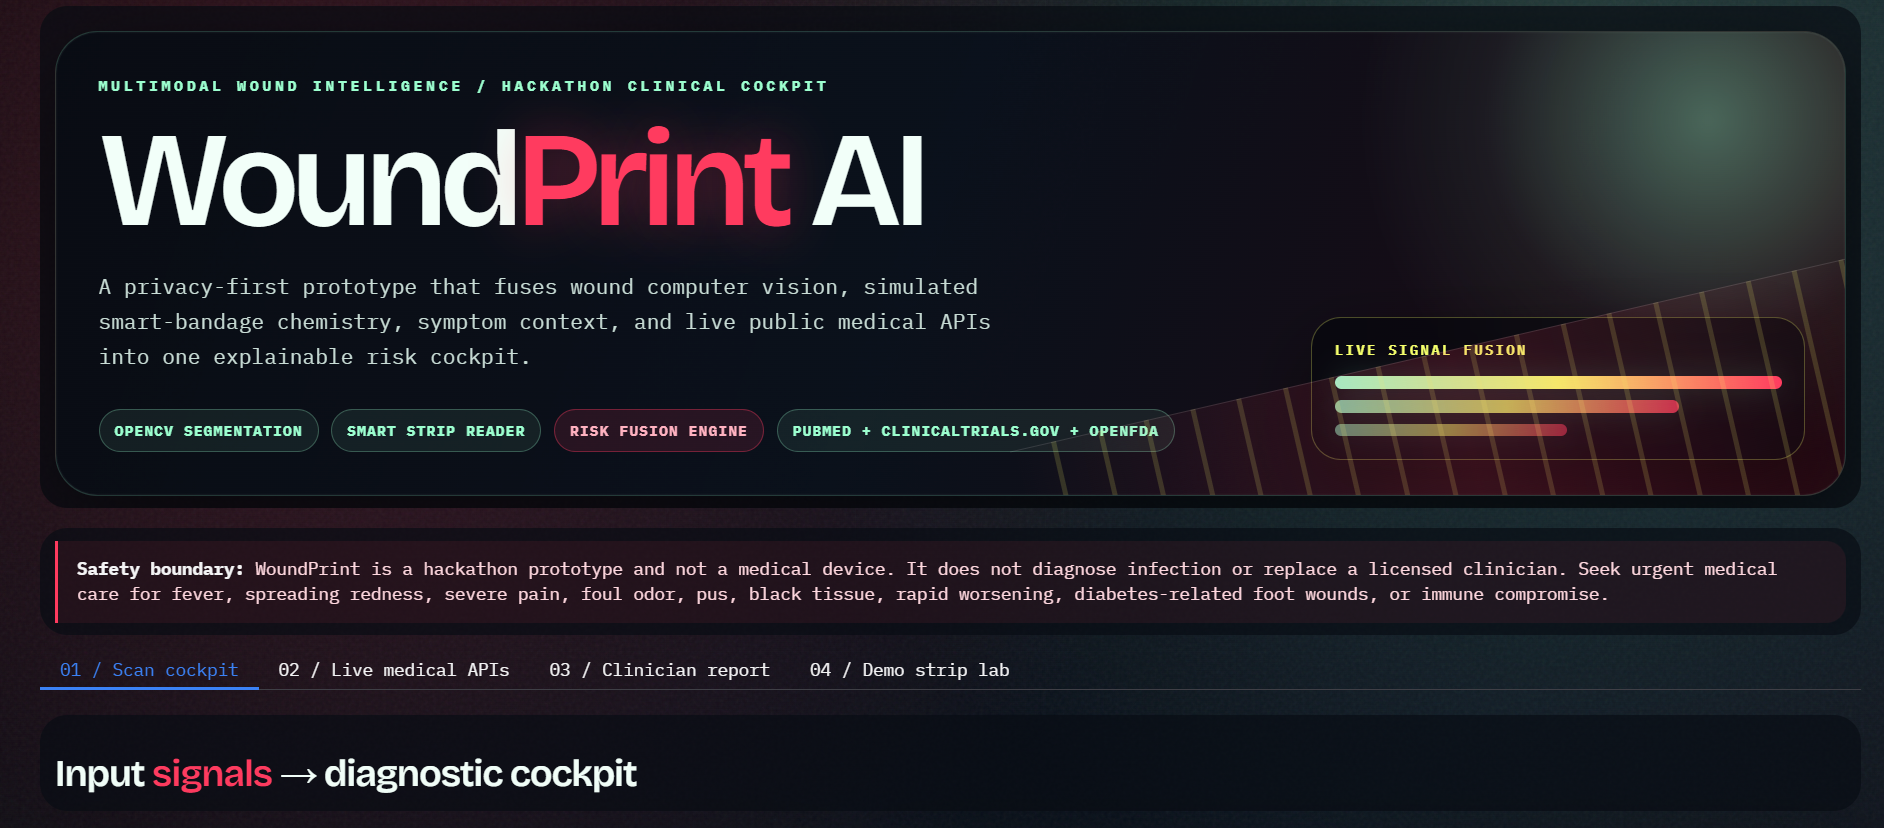
WoundPrint UI

WoundPrint started from a simple but urgent problem: wounds often get worse between clinical visits, and patients usually have no structured way to know whether a change is concerning. A person may notice redness, drainage, pain, or a color shift, but those signs are hard to interpret without medical training. At the same time, a clinician may only receive a blurry photo or a vague message like “it looks worse.”
We wanted to build something that bridges that gap.
The key idea behind WoundPrint is that wounds are not only visual. Infection risk and delayed healing can appear through a pattern of signals: redness, tissue color, wound-edge changes, exudate, heat, pH, inflammation, and patient symptoms. A photo alone can be affected by lighting, camera angle, skin tone, or shadows. A single biomarker alone can also be misleading. So instead of building a basic “wound classifier,” we built a multimodal wound intelligence cockpit that combines wound imaging, simulated smart-bandage chemistry, symptom context, and public medical evidence into one explainable monitoring report.
Our central thesis is:
$$ \text{Wound risk should be read as a spatial and biochemical pattern, not a single fragile signal.} $$
That idea shaped the whole project. WoundPrint is not meant to replace clinicians. It is meant to help patients and caregivers document wounds better, notice concerning changes earlier, and communicate clearer information to medical professionals.
What it does
WoundPrint AI is a working prototype for early wound-risk awareness and documentation. The user uploads a wound photo and a simulated smart-bandage strip image. The app then analyzes both signals and generates a structured report.
The prototype accepts:
- A wound image
- A simulated smart-bandage strip image
- Optional symptoms such as fever, spreading redness, increasing pain, odor, pus/drainage, diabetes or immune compromise, and wound growth
- Optional medical evidence query
- Optional medication query
The app outputs:
- An AI wound overlay image
- A decoded smart-strip image
- A risk fusion score
- An explainable risk category
- Top risk drivers
- A wound feature table
- A biomarker severity chart
- A 7-day “Wound Twin” monitoring forecast
- A signal contribution chart
- Public medical evidence snapshots
- A clinician-ready report
The smart-bandage strip is simulated with four colorimetric biomarker pads:
| Pad | Meaning |
|---|---|
| pH | Alkaline shift / infection-risk proxy |
| Heat | Local temperature or inflammation proxy |
| Exudate | Drainage or wound-fluid burden proxy |
| Inflammation | Protease/inflammation-like signal proxy |
The result is not a diagnosis. It is a risk-awareness and documentation tool. WoundPrint uses careful language like “possible infection-risk signal,” “monitor closely,” and “seek medical care if concerning symptoms appear.”
How we built it
We built WoundPrint as a Google Colab + Gradio web app with a custom dark surgical cockpit interface.
The prototype has several layers:
Interface layer
We used Gradio Blocks with custom HTML and CSS to create a cinematic medical AI dashboard. The interface includes a scan cockpit, smart-strip lab, medical API section, clinician report tab, glowing panels, animated signal elements, and a safety disclaimer.Image processing layer
We used Python, OpenCV, NumPy, and PIL/Pillow to process wound images. The app converts the uploaded wound photo into RGB and HSV color spaces, then estimates visual features such as redness, yellow tissue, dark tissue, boundary redness, edge irregularity, and wound area proxy.Smart-strip layer
The app reads a simulated colorimetric strip by splitting it into four pad regions. Each region is mapped to a normalized biomarker score for pH, heat, exudate, and inflammation.Risk fusion layer
We created a transparent scoring model instead of a black-box classifier. The visual score is calculated from wound features:
$$ V = 0.25R + 0.18Y + 0.16D + 0.16B + 0.15E + 0.10A $$
where \(R\) is redness, \(Y\) is yellow tissue, \(D\) is dark tissue, \(B\) is boundary redness, \(E\) is edge irregularity, and \(A\) is wound area proxy.
The biomarker score is calculated from the smart-strip signals:
$$ C = 0.30P + 0.25H + 0.25X + 0.20I $$
where \(P\) is pH signal, \(H\) is heat signal, \(X\) is exudate signal, and \(I\) is inflammation signal.
The final risk score combines visual, biochemical, and symptom context:
$$ \text{Risk} = 100 \times (0.50V + 0.35C + 0.15S) $$
where \(S\) is symptom burden.
Visualization layer
We used Plotly to create the risk gauge, biomarker severity chart, signal contribution chart, and simulated 7-day Wound Twin forecast.Medical evidence layer
We connected the prototype to public medical data sources using Python Requests, including PubMed/NCBI E-utilities, ClinicalTrials.gov, NIH Clinical Tables, and openFDA. These are used only for context, not diagnosis.Report layer
The app generates a clinician-ready markdown report containing the risk score, feature values, biomarker readings, selected symptoms, top risk drivers, safety language, and evidence summaries.
The layered architecture and workflow are the same as the project document: wound image acquisition, computer vision analysis, smart-bandage decoding, risk fusion, and report generation. :contentReference[oaicite:0]{index=0}
Challenges we ran into
The biggest challenge was balancing ambition with safety. WoundPrint is a medical-adjacent prototype, so we had to be careful not to present it as a diagnostic device. We designed the app to say “risk signal” instead of “infection,” and we included clear warnings that the tool does not replace clinical care.
Another challenge was making the wound image analysis useful without claiming clinical accuracy. Real wound segmentation is difficult because wound photos vary heavily in lighting, skin tone, camera quality, wound type, and angle. To handle this, we used heuristic computer vision with image-quality warnings and fallback behavior.
The smart-strip simulation also required careful framing. We wanted to show how a colorimetric smart dressing could work, but we did not want to pretend we had a fully validated physical medical device. So the strip is clearly described as simulated, while the architecture is designed to scale toward real calibration curves and real sensor chemistry.
We also ran into technical issues deploying the app through Colab and Gradio. Package versions, runtime resets, and public share links were unstable at times. We solved this by pinning compatible dependencies, adding fallback logic, and keeping the app robust even when medical APIs are slow or unavailable.
Finally, we had to make the UI feel advanced without making it confusing. The goal was not just to build working code, but to make the prototype feel like a real product: a dark surgical cockpit where image data, biomarker signals, symptoms, and evidence fuse into one understandable report.
Accomplishments that we're proud of
We are proud that WoundPrint goes beyond a basic AI image classifier. Instead of only asking “does this wound look infected?”, the system asks a more realistic question: what pattern of visual, biochemical, and symptom signals should make someone pay closer attention?
We are especially proud of:
- Building a working Gradio prototype with wound image upload, smart-strip upload, risk scoring, charts, and report generation
- Creating a custom medical cockpit UI instead of a default demo interface
- Designing a transparent risk model that users can inspect
- Adding visual wound features such as redness, yellow tissue, dark tissue, boundary redness, edge irregularity, and wound area proxy
- Simulating a smart-bandage strip with pH, heat, exudate, and inflammation pads
- Generating a 7-day Wound Twin monitoring forecast
- Connecting the prototype to public medical APIs
- Writing the system around safety, uncertainty, and explainability
- Creating a project that feels like a bridge between smart dressings, computer vision, and telehealth
The prototype also includes clear risk categories:
| Score | Category |
|---|---|
| 0–24 | Low |
| 25–49 | Monitor closely |
| 50–74 | Possible infection-risk signal |
| 75–100 | Urgent care recommended |
This makes the output easier to understand while still avoiding diagnostic claims.
What we learned
We learned that healthcare AI is not just about model accuracy. It is also about communication, uncertainty, safety, and trust.
A black-box output like “high risk” is not enough. Users need to know why the system gave that result. That is why WoundPrint ranks the top contributing signals and explains the output in plain language.
We also learned that multimodal systems can be more powerful than single-input tools. A wound photo provides spatial context, a smart strip provides biochemical context, symptoms provide patient context, and medical APIs provide evidence context. None of those signals is perfect alone. Together, they can support a clearer monitoring workflow.
We also learned the importance of practical deployment. A project can have a strong idea, but for a hackathon it needs to actually run. We had to make decisions that prioritized reliability: no paid APIs, no required GPU, no database dependency, no complex authentication, and graceful fallback if external services fail.
Most importantly, we learned that the safest role for this kind of prototype is not diagnosis. The safer and more realistic role is documentation and early risk awareness.
What's next for WoundPrint: Multimodal AI for Smart Wound Risk Detection
The next step is to turn WoundPrint from a hackathon prototype into a stronger research and product system.
Short-term improvements:
- Add longitudinal wound tracking with daily scan history
- Add wound-size estimation using a printed reference marker
- Improve image segmentation with a wound-specific deep learning model
- Add lighting calibration with a color reference card
- Improve PDF export with images, charts, and structured clinician notes
- Add better synthetic demo wounds and smart-strip presets
Medium-term improvements:
- Integrate real colorimetric sensor strips
- Validate biomarker color response experimentally
- Train on labeled wound datasets
- Test robustness across different skin tones and lighting conditions
- Add wound-change detection between timepoints
- Build a clinician dashboard for reviewing patient-submitted scans
Long-term vision:
- Develop a low-cost disposable smart dressing
- Connect WoundPrint to telehealth workflows
- Support home health agencies, nursing homes, rural clinics, and post-operative monitoring
- Add privacy-preserving learning so models can improve without exposing patient data
- Build a clinically validated risk-stratification model
WoundPrint’s long-term goal is to make wound monitoring more structured, explainable, and accessible. The vision is not to replace doctors. The vision is to help people recognize concerning changes earlier and give clinicians better information when it matters.

Log in or sign up for Devpost to join the conversation.