Inspiration
Maps are a very universal tool which can be used to display a number of different types of data. We figured that using a map would fit the theme very well as it can show various environmental statistics around the world.
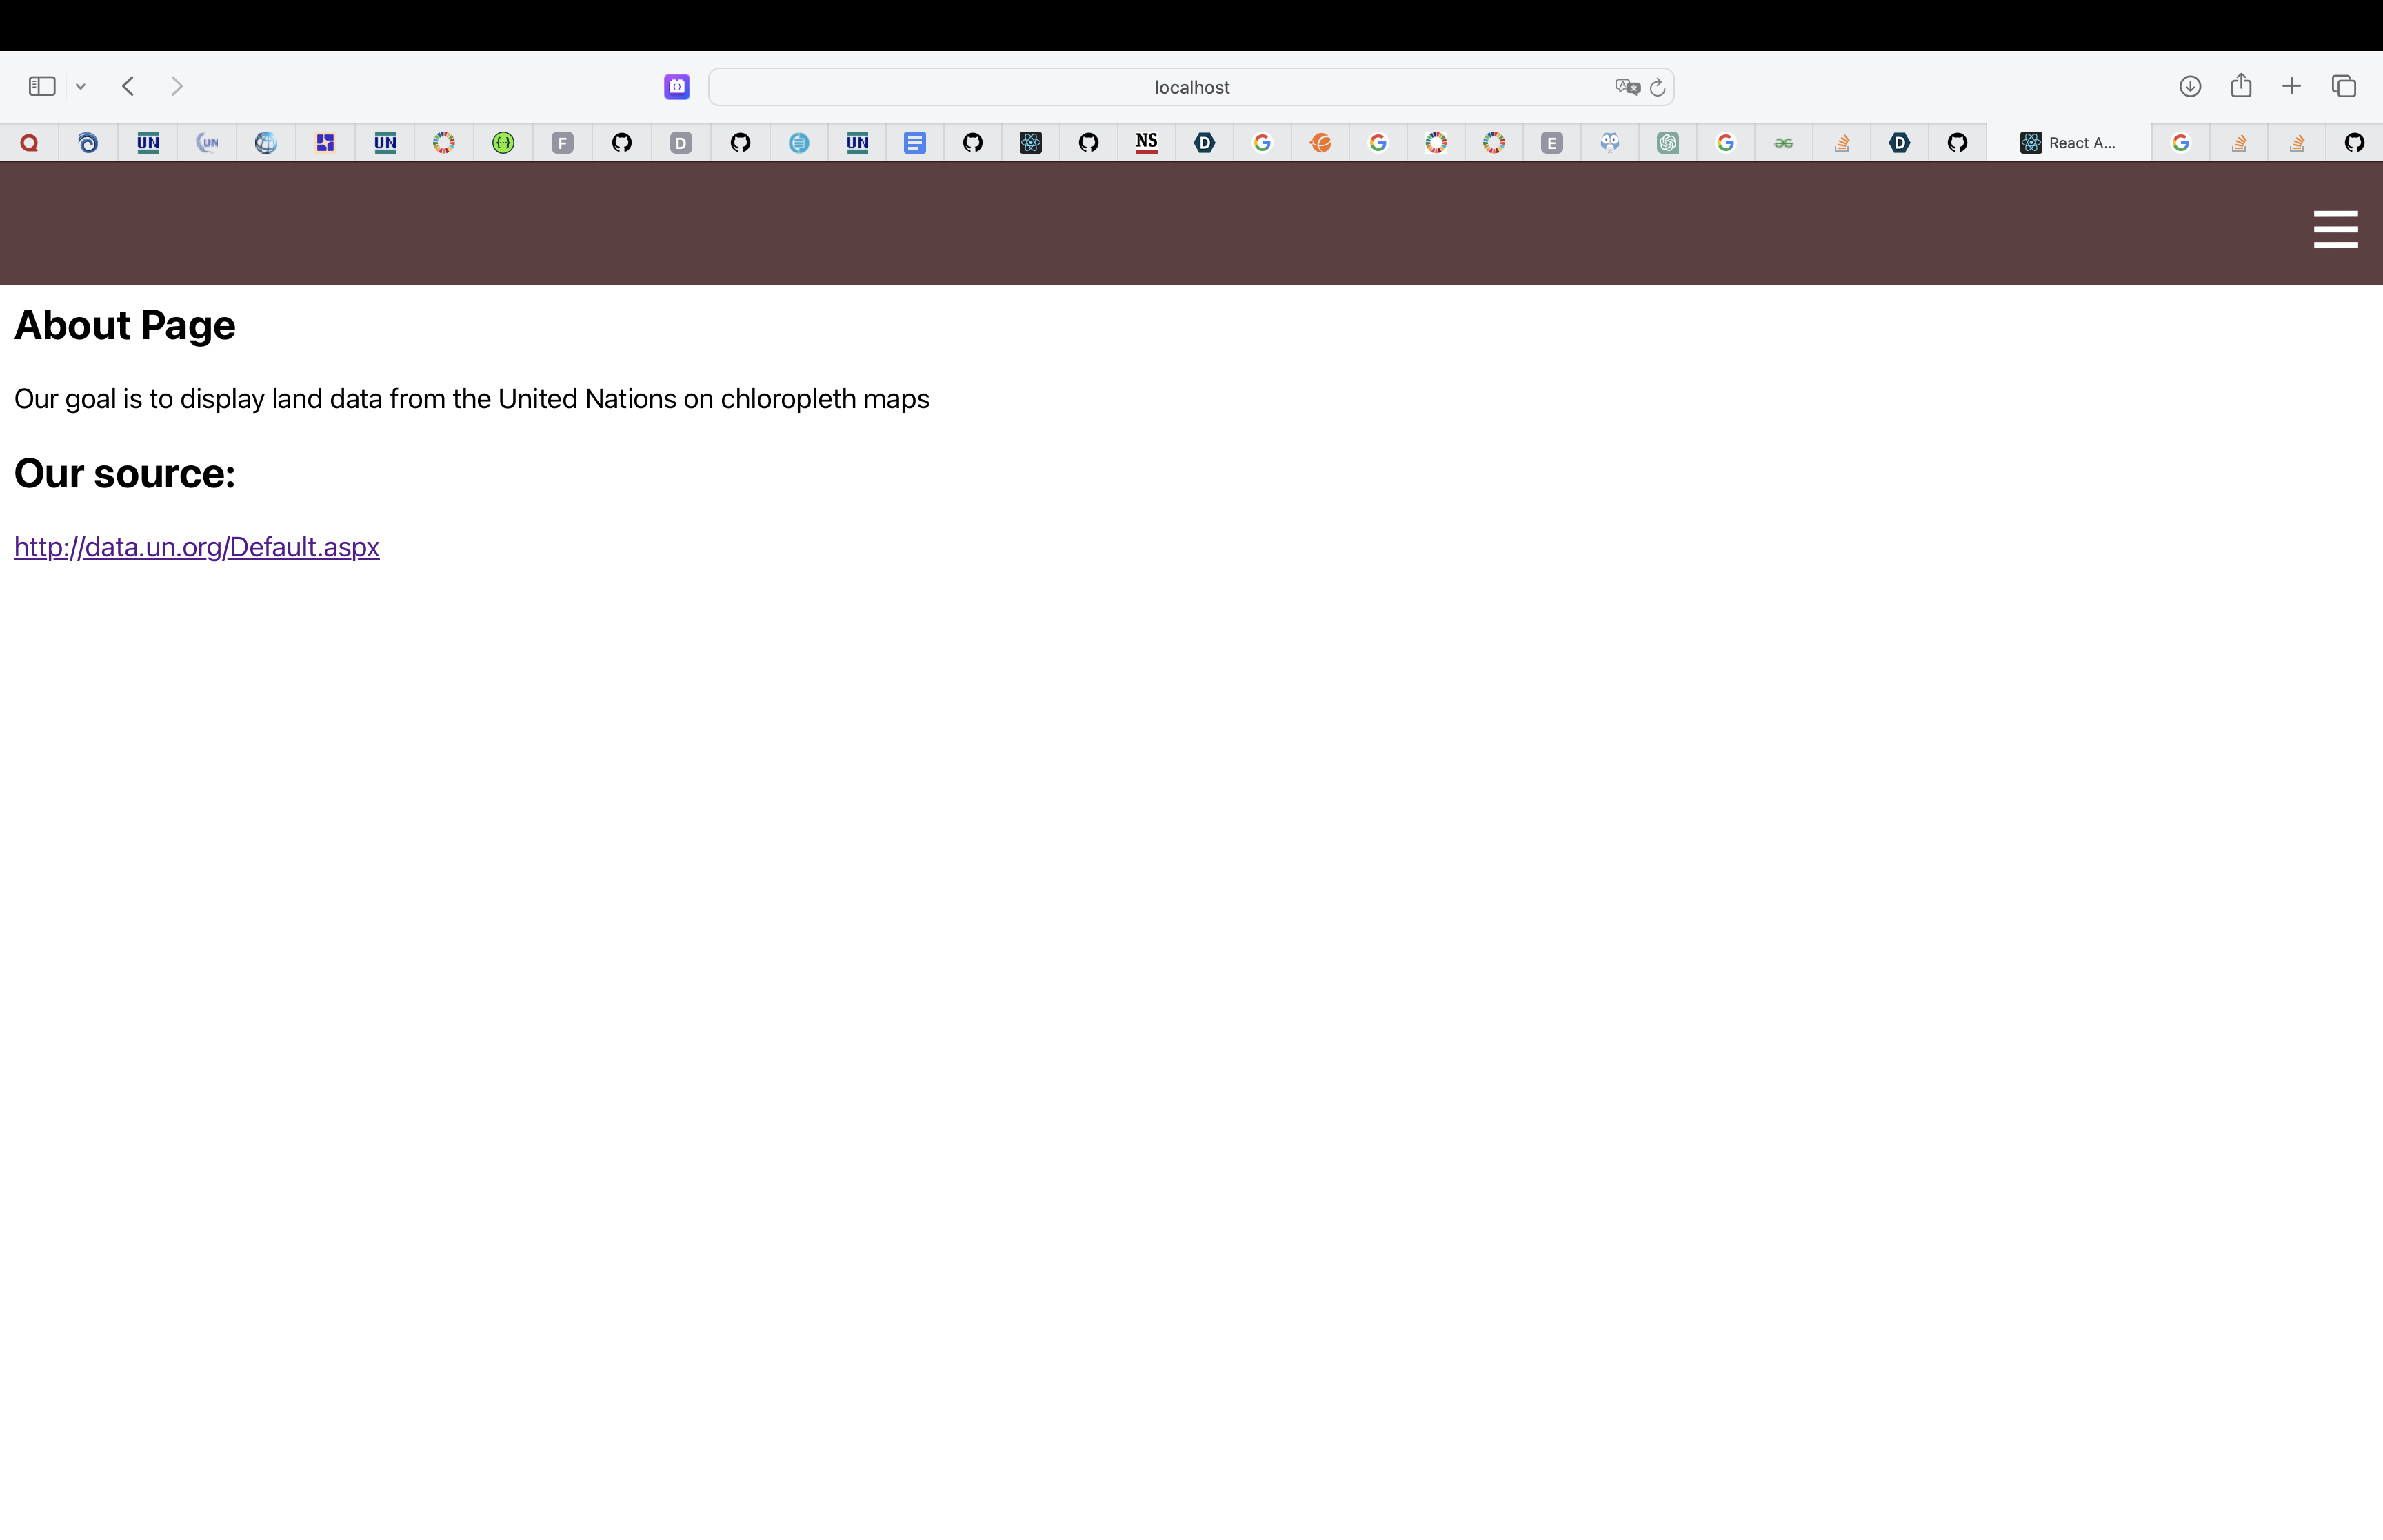
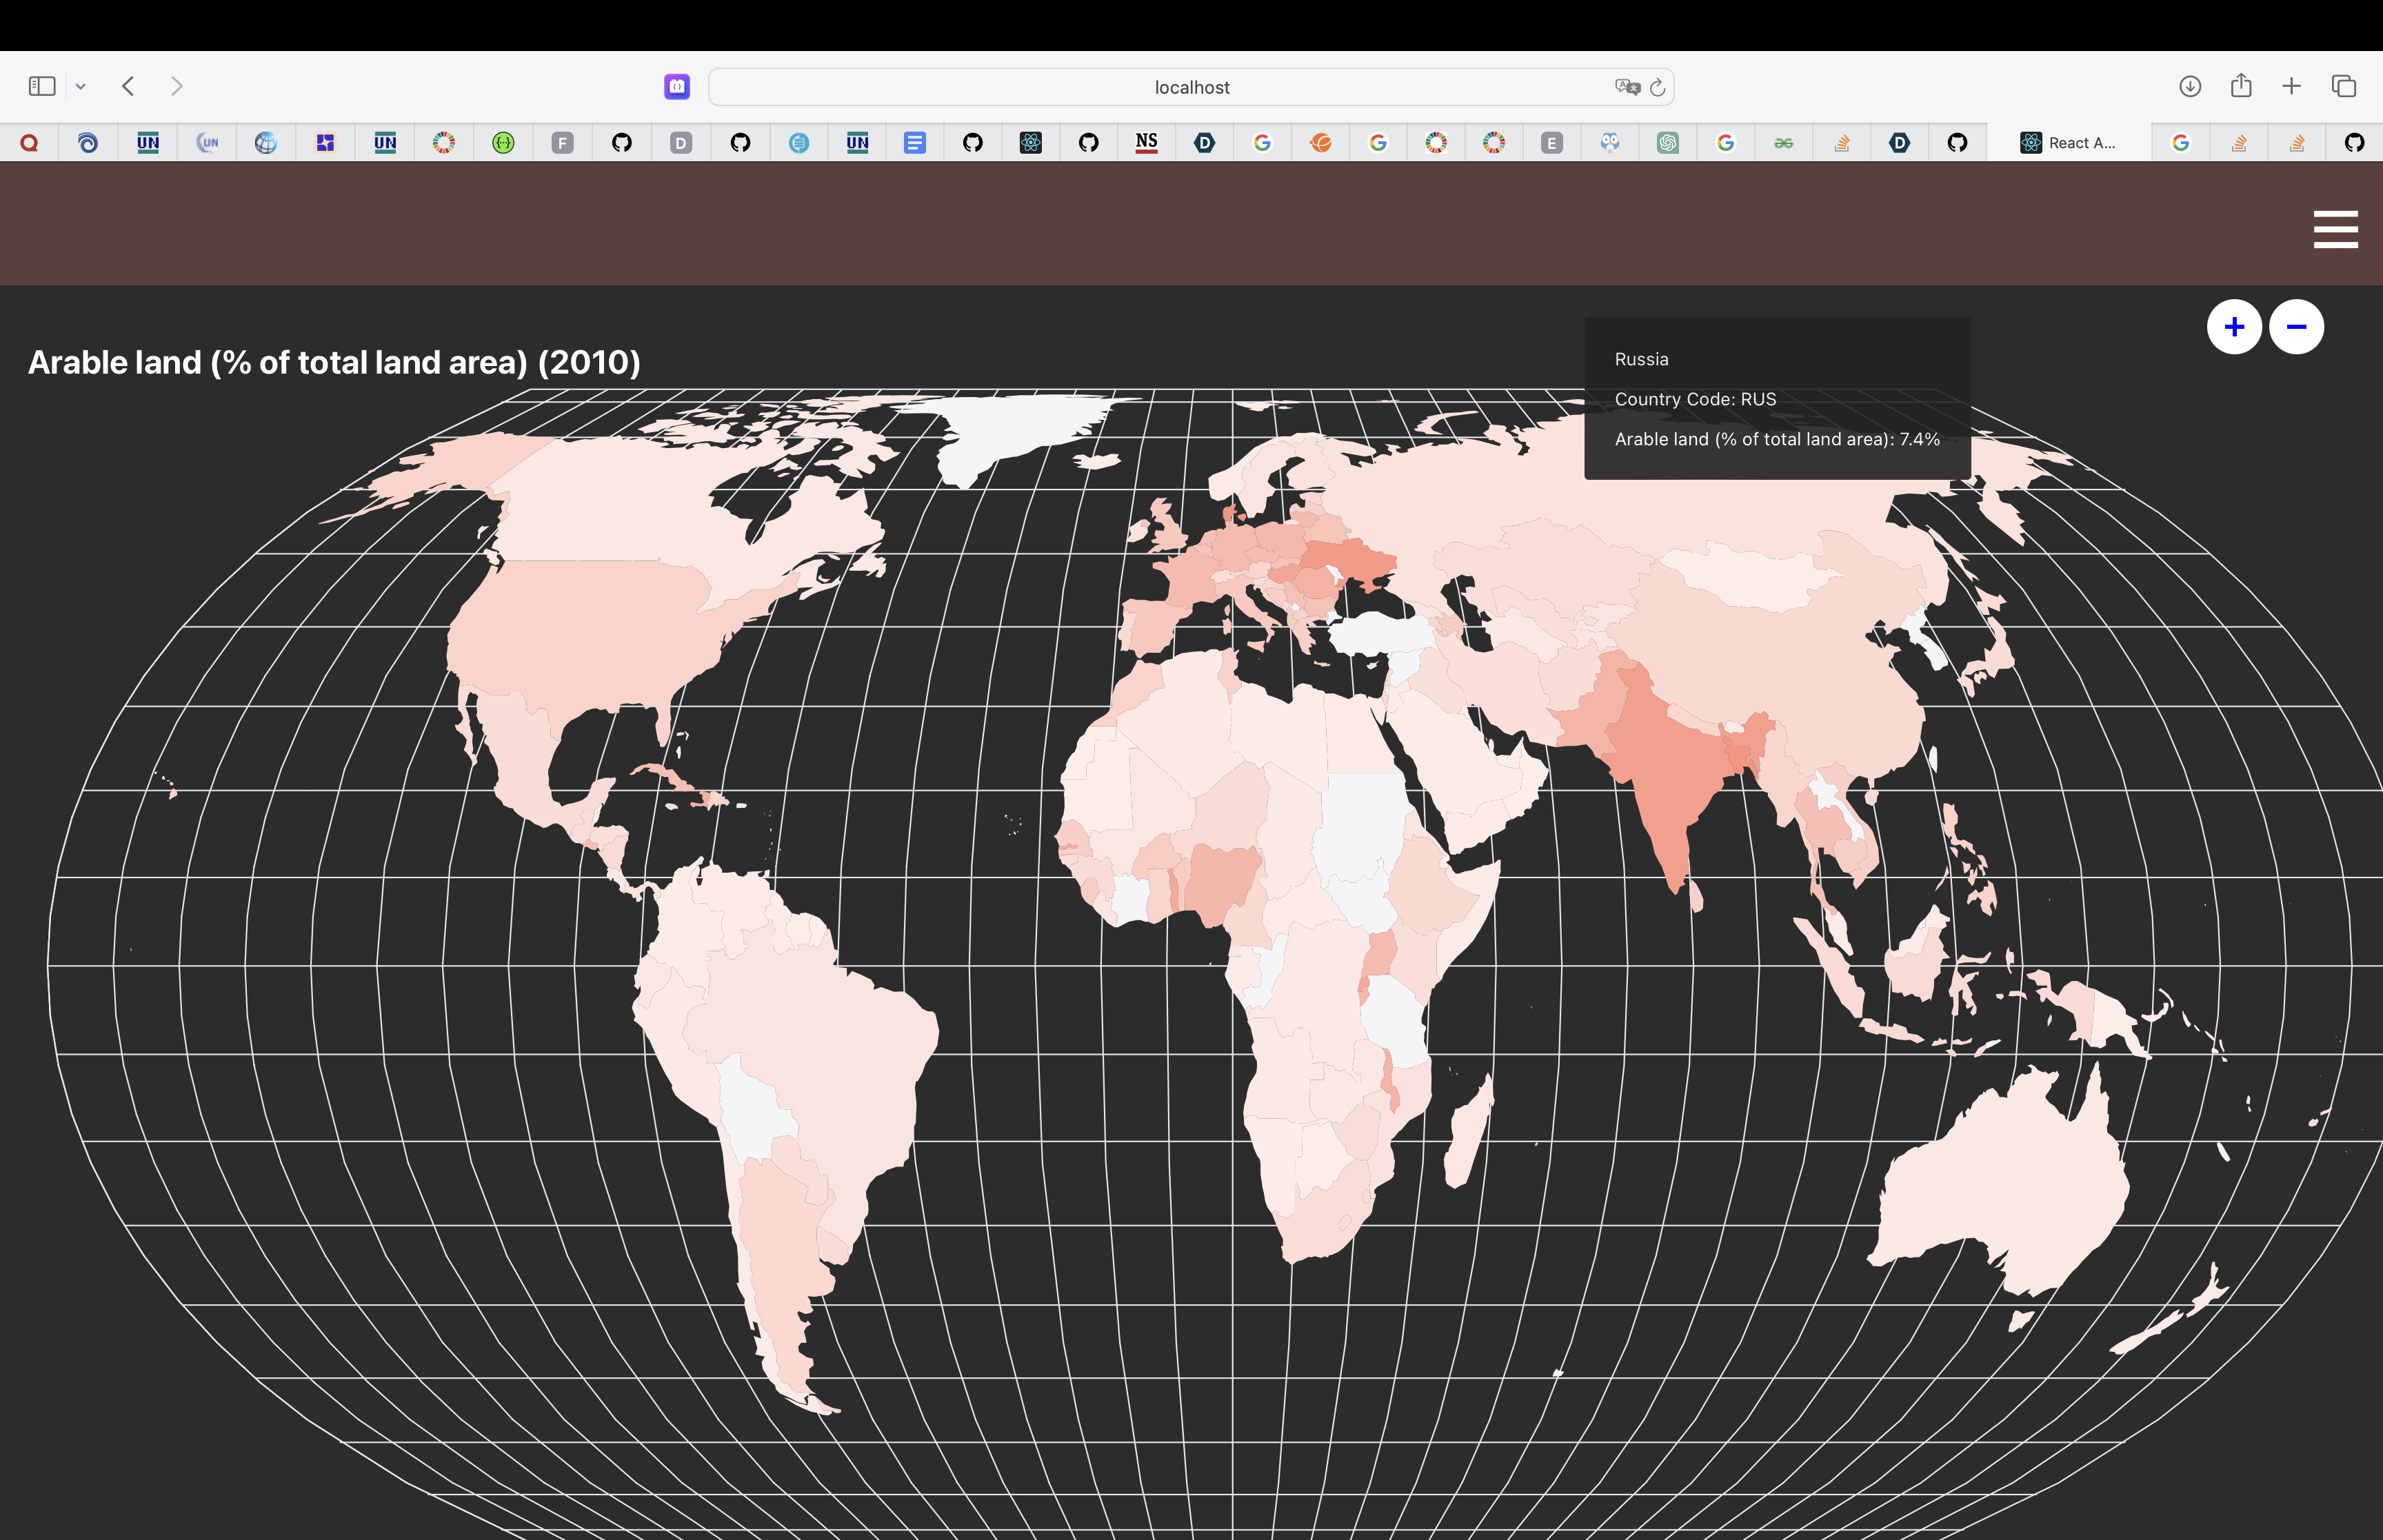
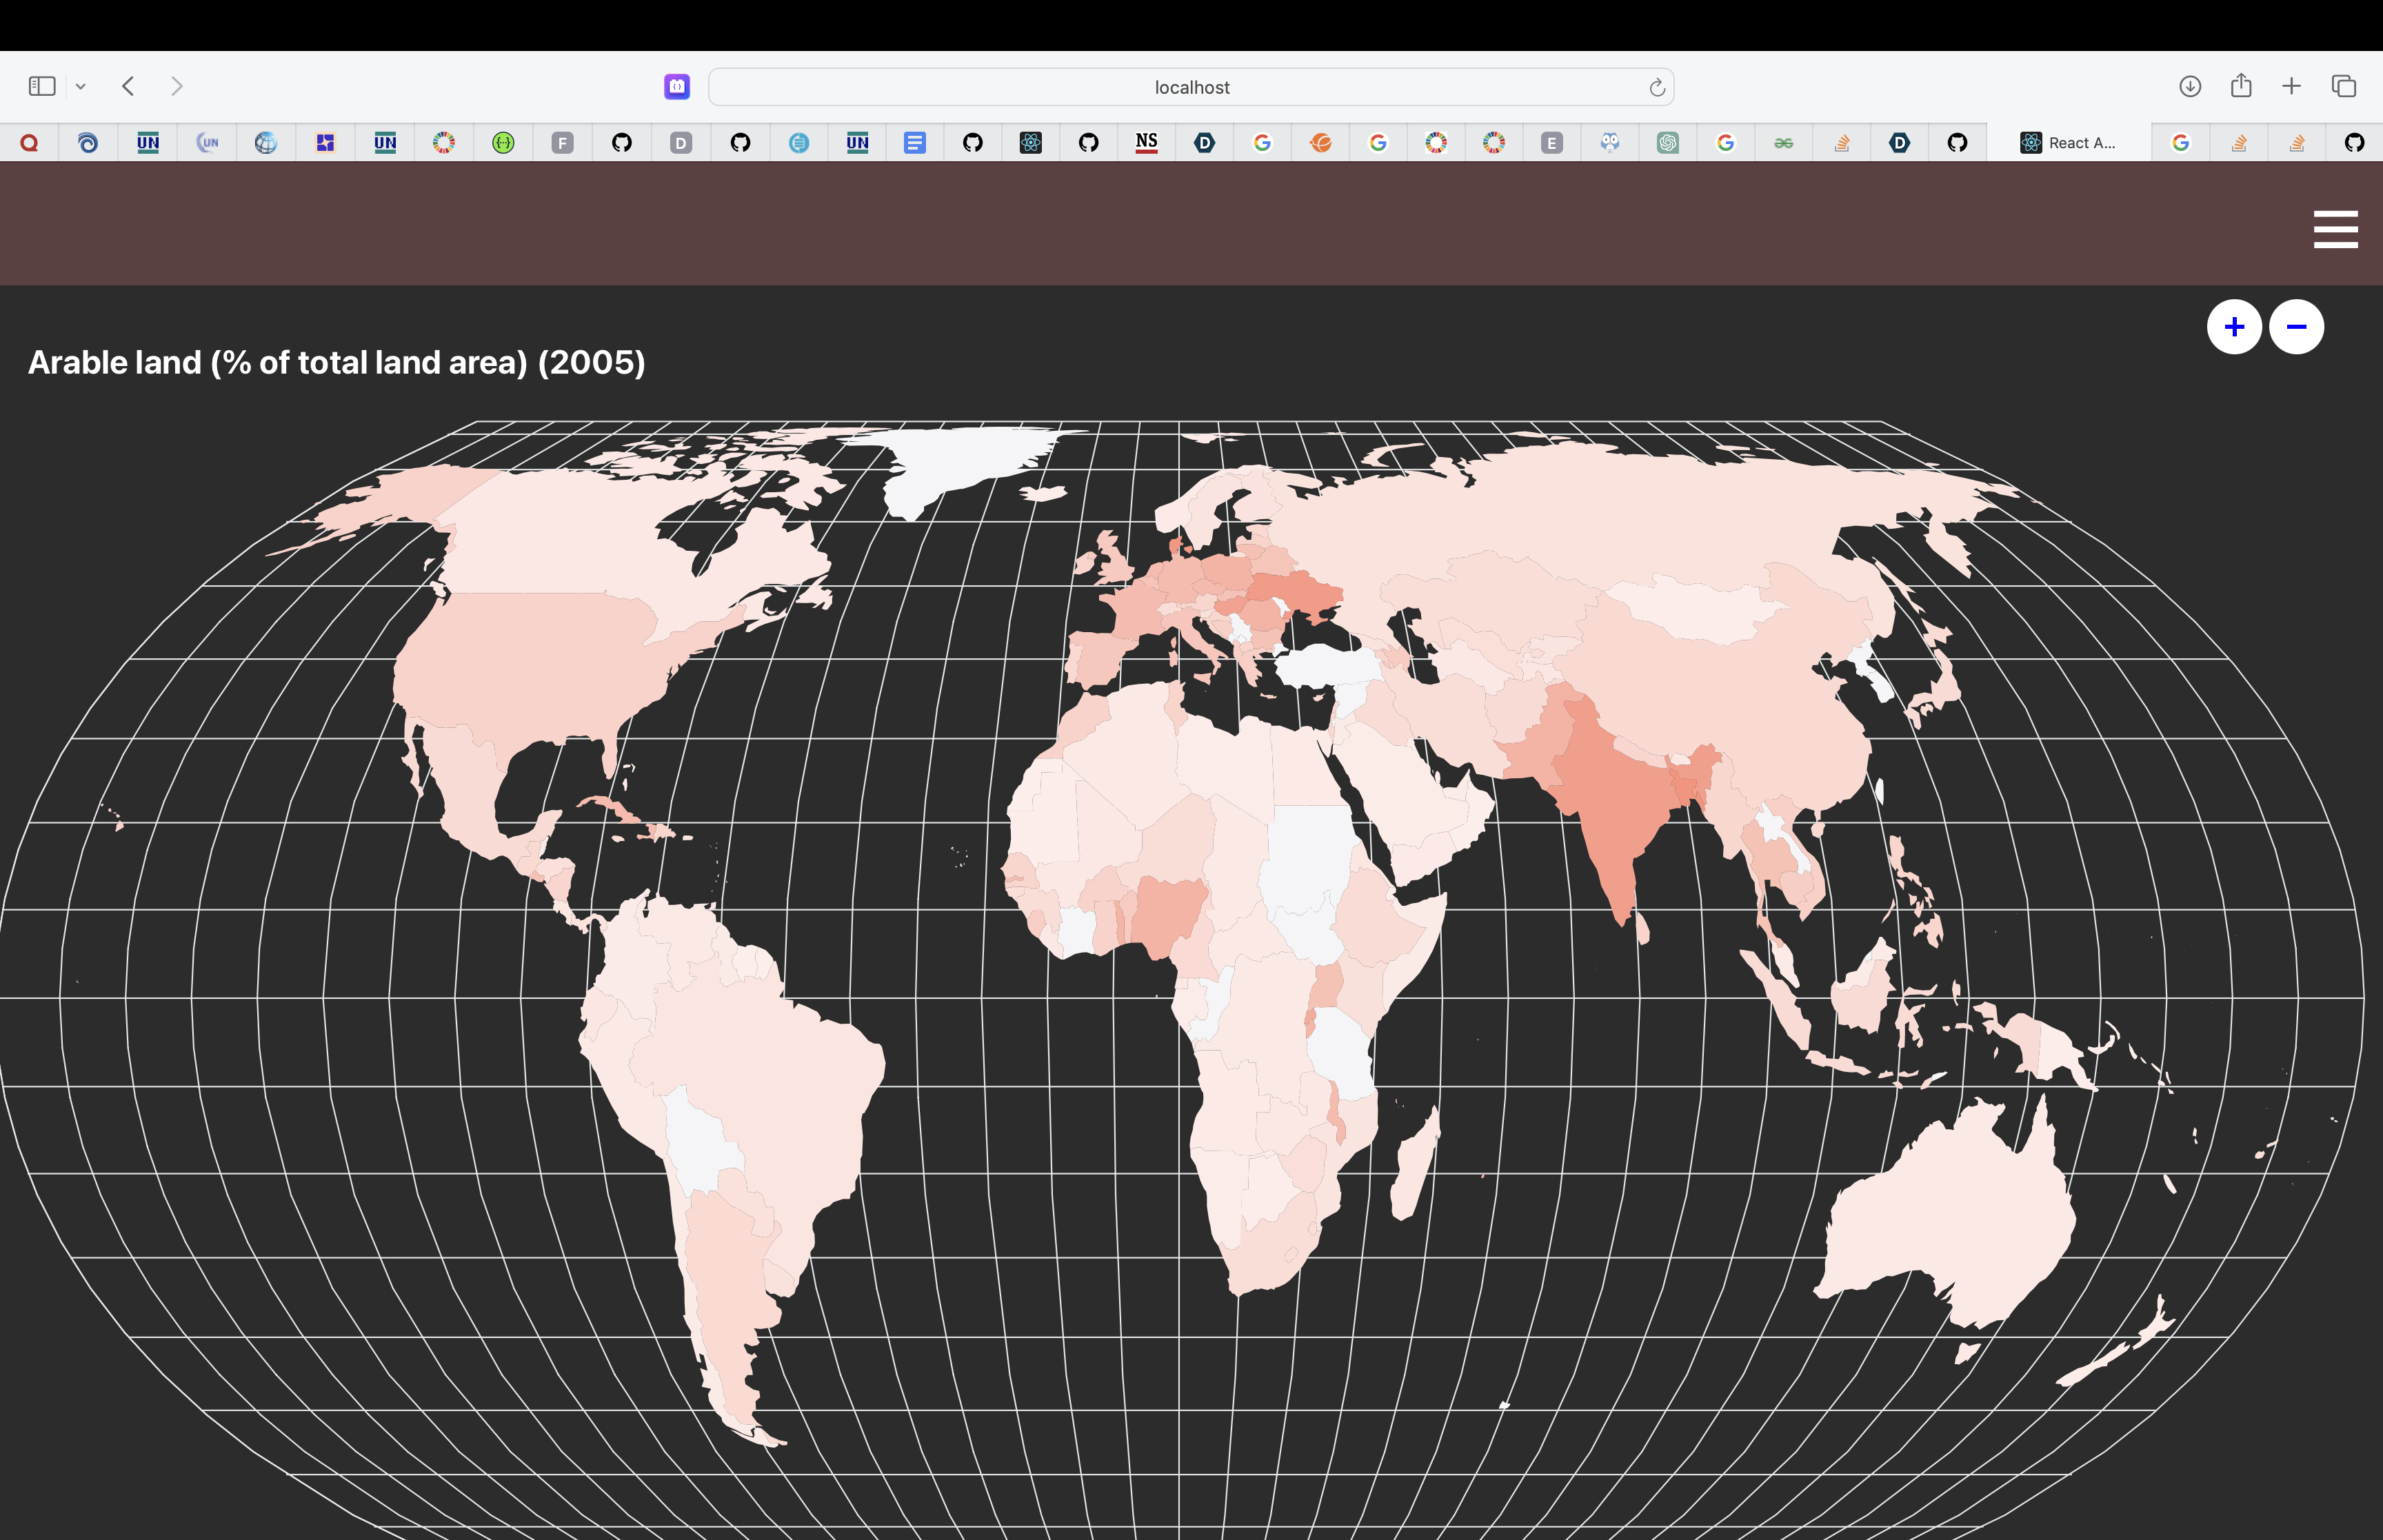
What it does
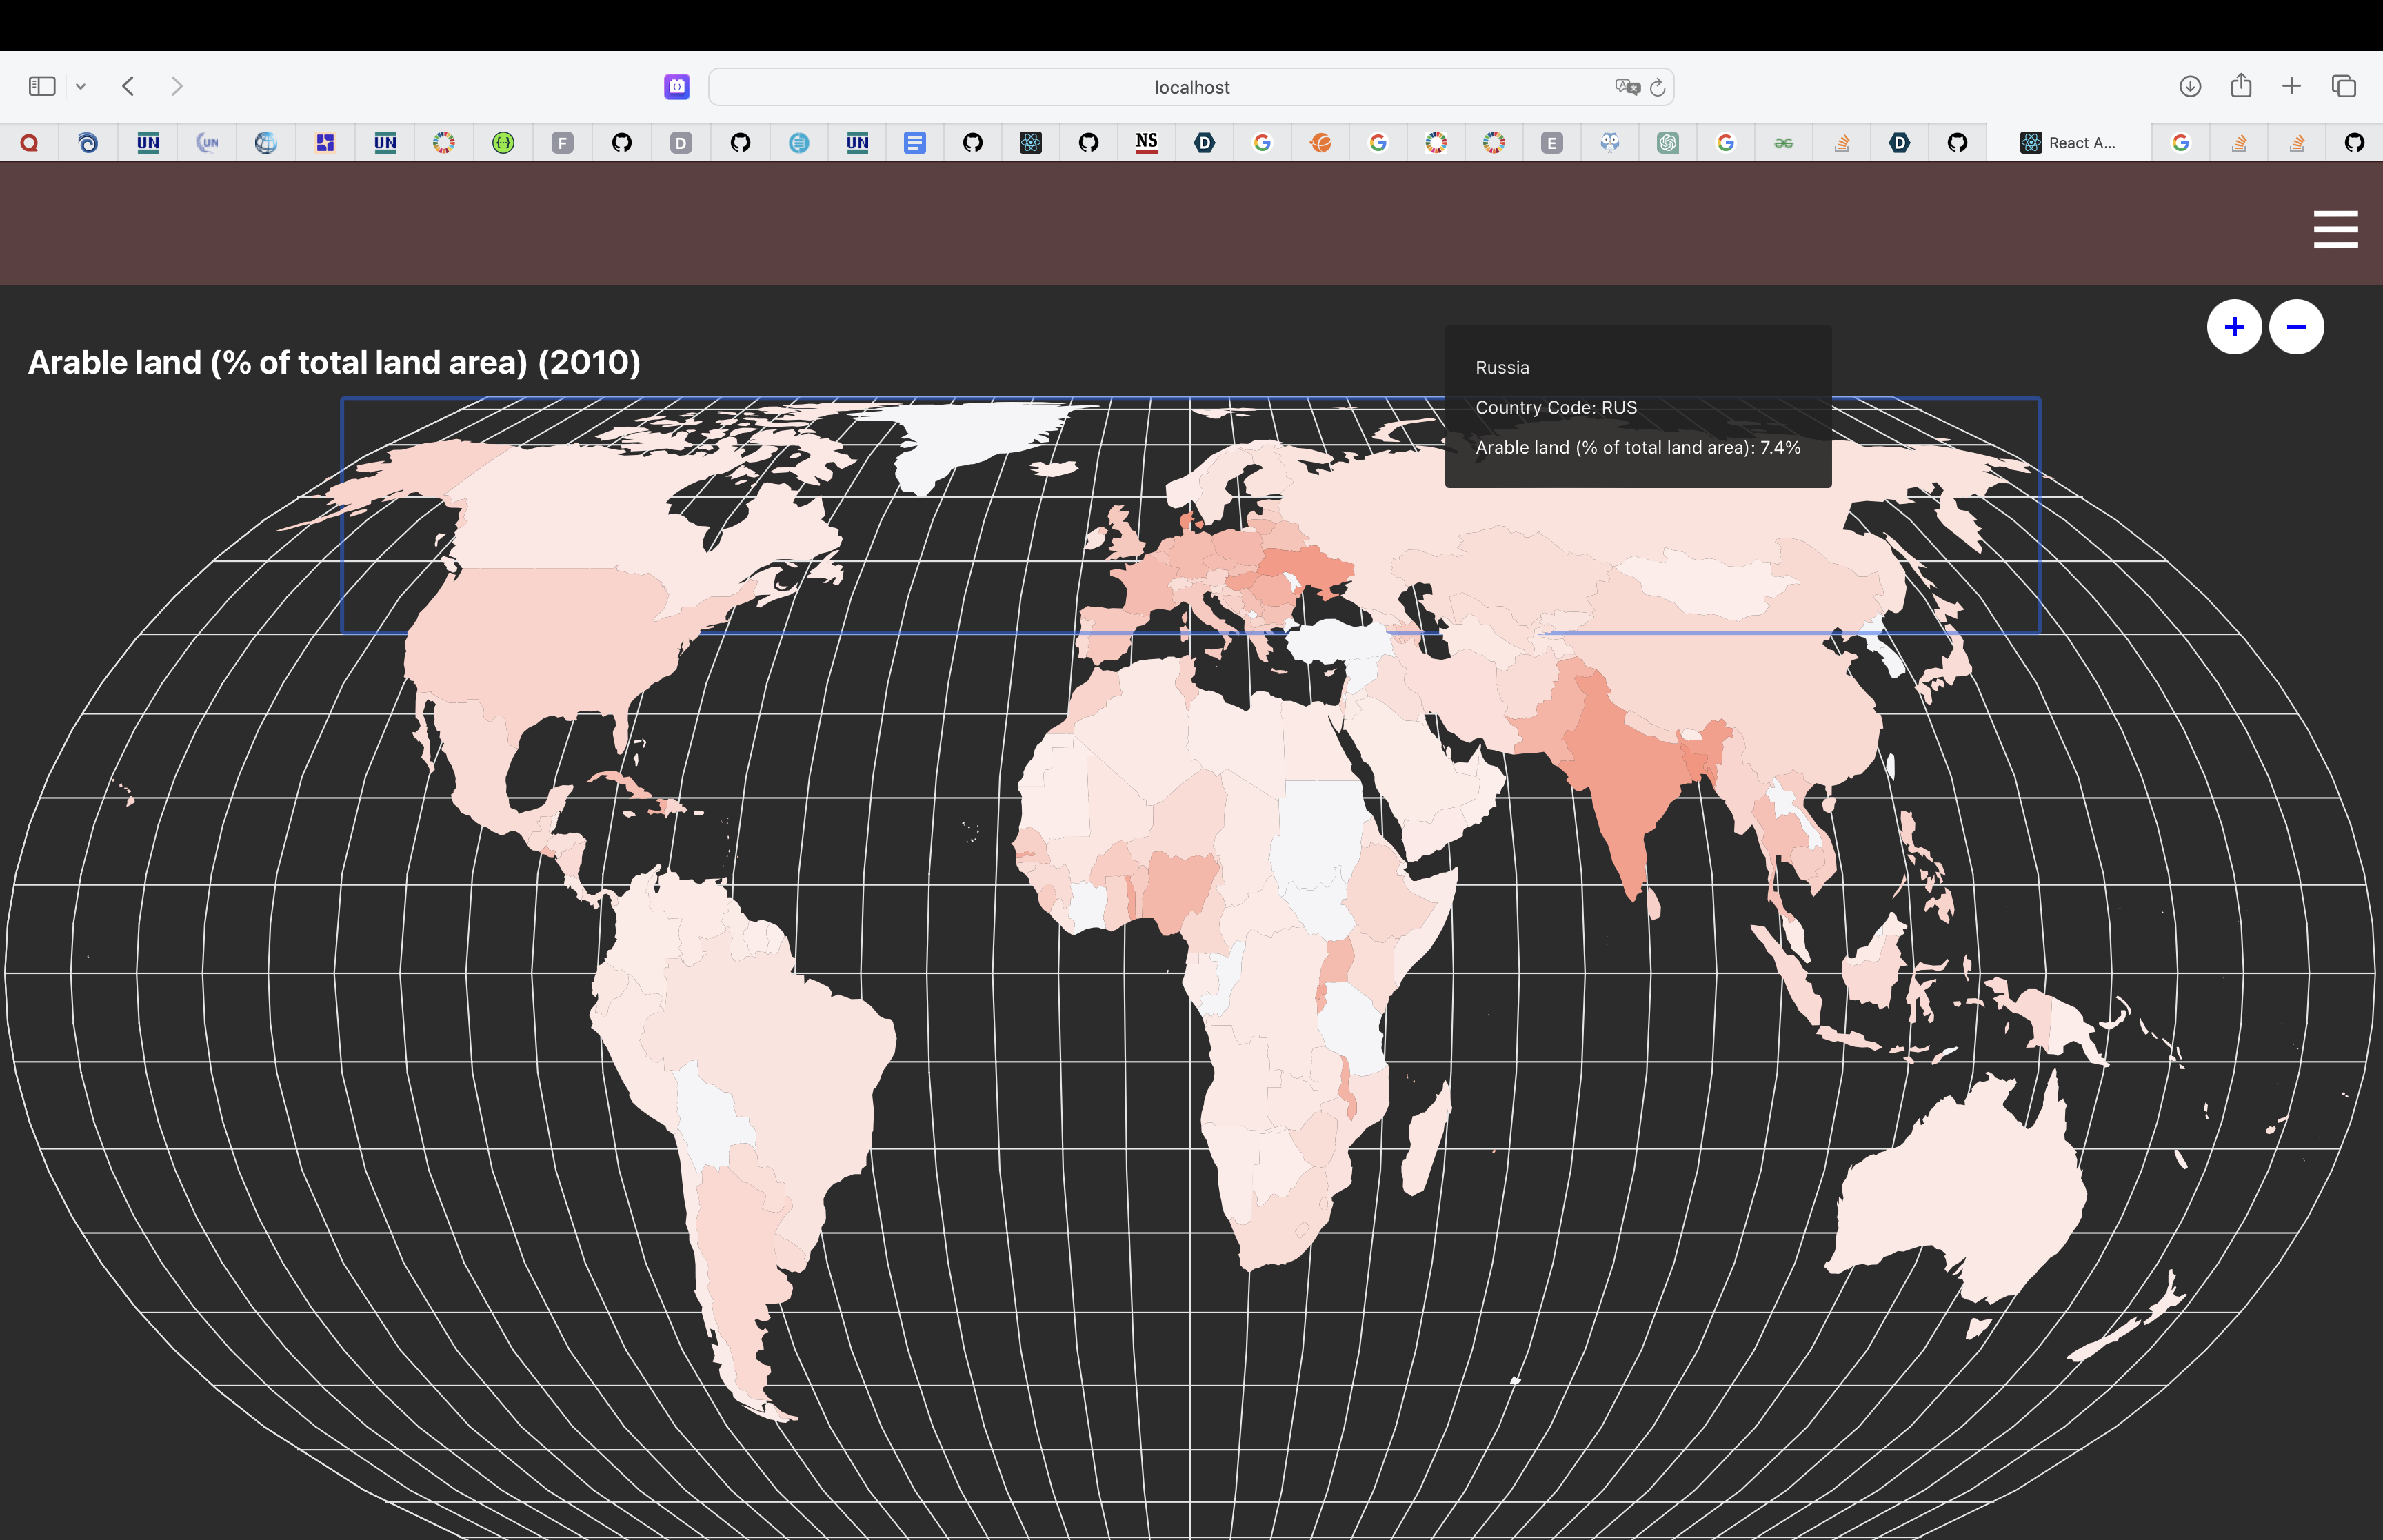
Our project features an interactable world map, where you can hover over each country to display information about how arable the land is, how much forest is covering the land, and the permanent crops.
How we built it
We used HTML, CSS, and JavaScript with the React.JS framework for the frontend and Javawith the Spring Boot framework for the backend.
Challenges we ran into
We had trouble finding the data to display on the maps, trouble displaying the nav bar, and implementing the data onto the map.
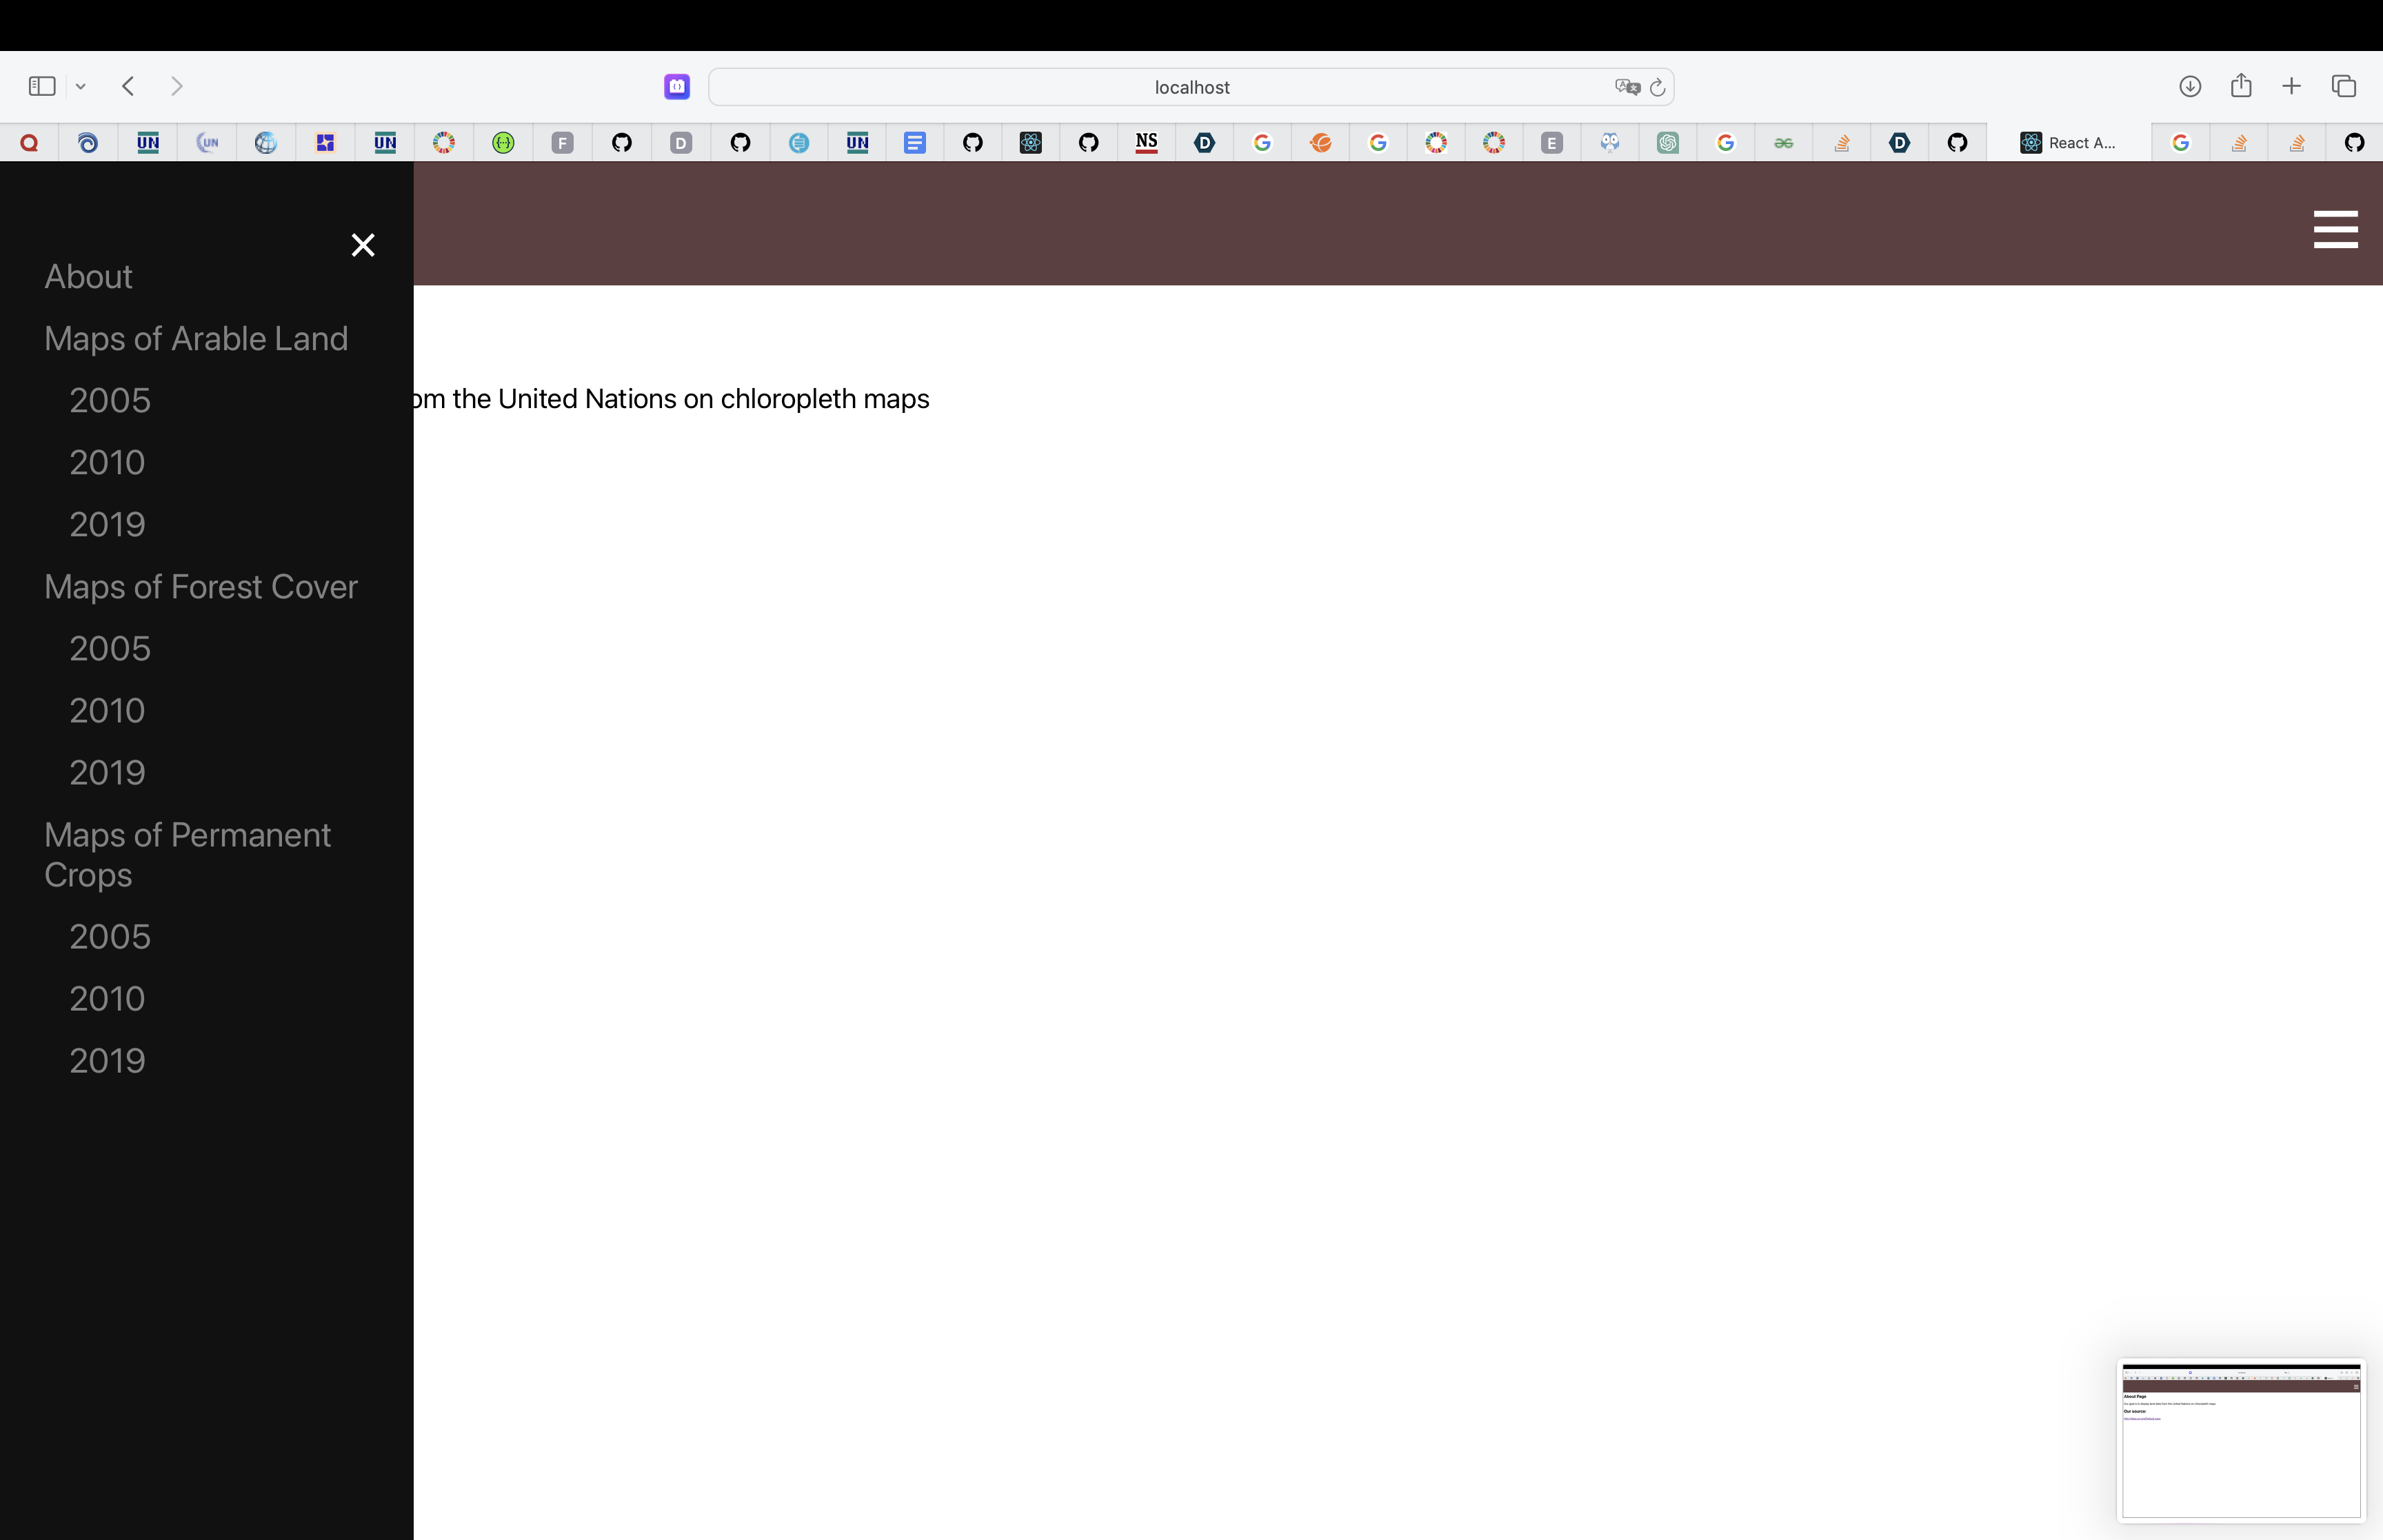
Accomplishments that we're proud of
We've successfully created an interactive map, added the data to the backend and displayed onto the frontend, and created a sliding navbar.
What we learned
We've learned how to create the map and by adding details like choropleth, putting data onto the tooltips from the backend, and how the frontend and backend tie in together to fit our needs.
What's next for World Eco Data
We plan on adding more info into the About pages, and adding a map of the US at a state level view with more types of statistics.

Log in or sign up for Devpost to join the conversation.