-
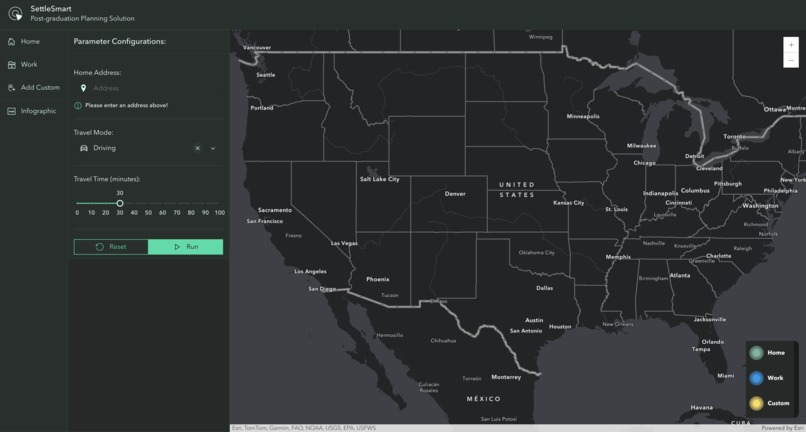
Main page application (Click image for better quality)
-
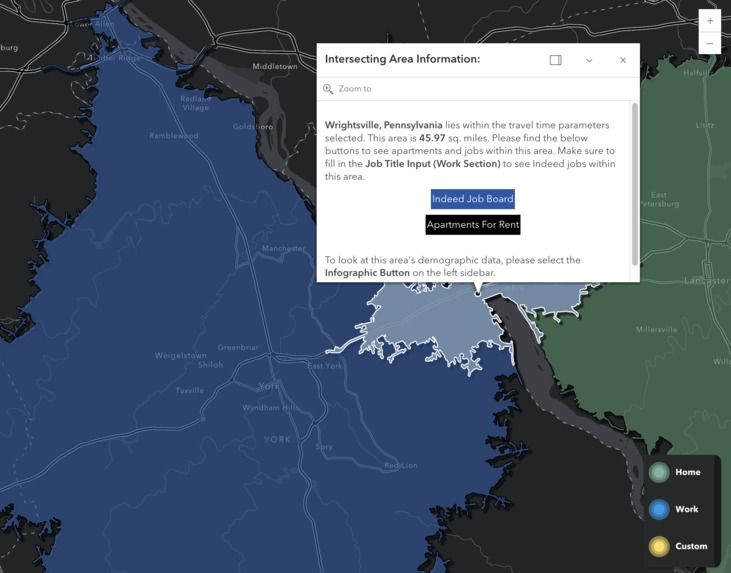
Intersecting area pop-up (Click image for better quality)
-
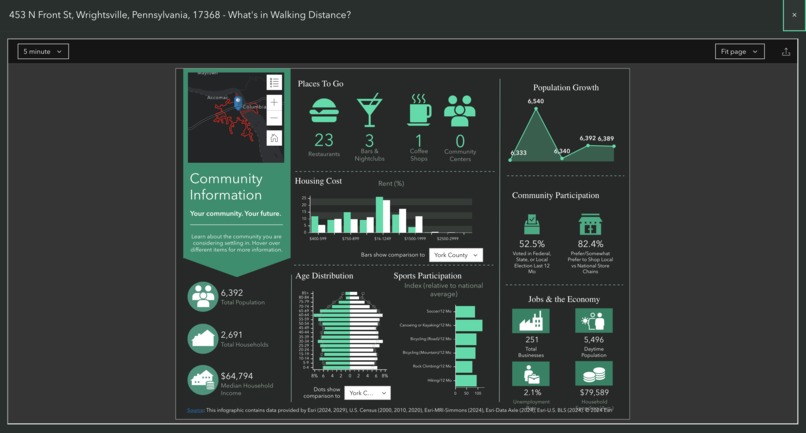
Infographic Modal (Click image for better quality)

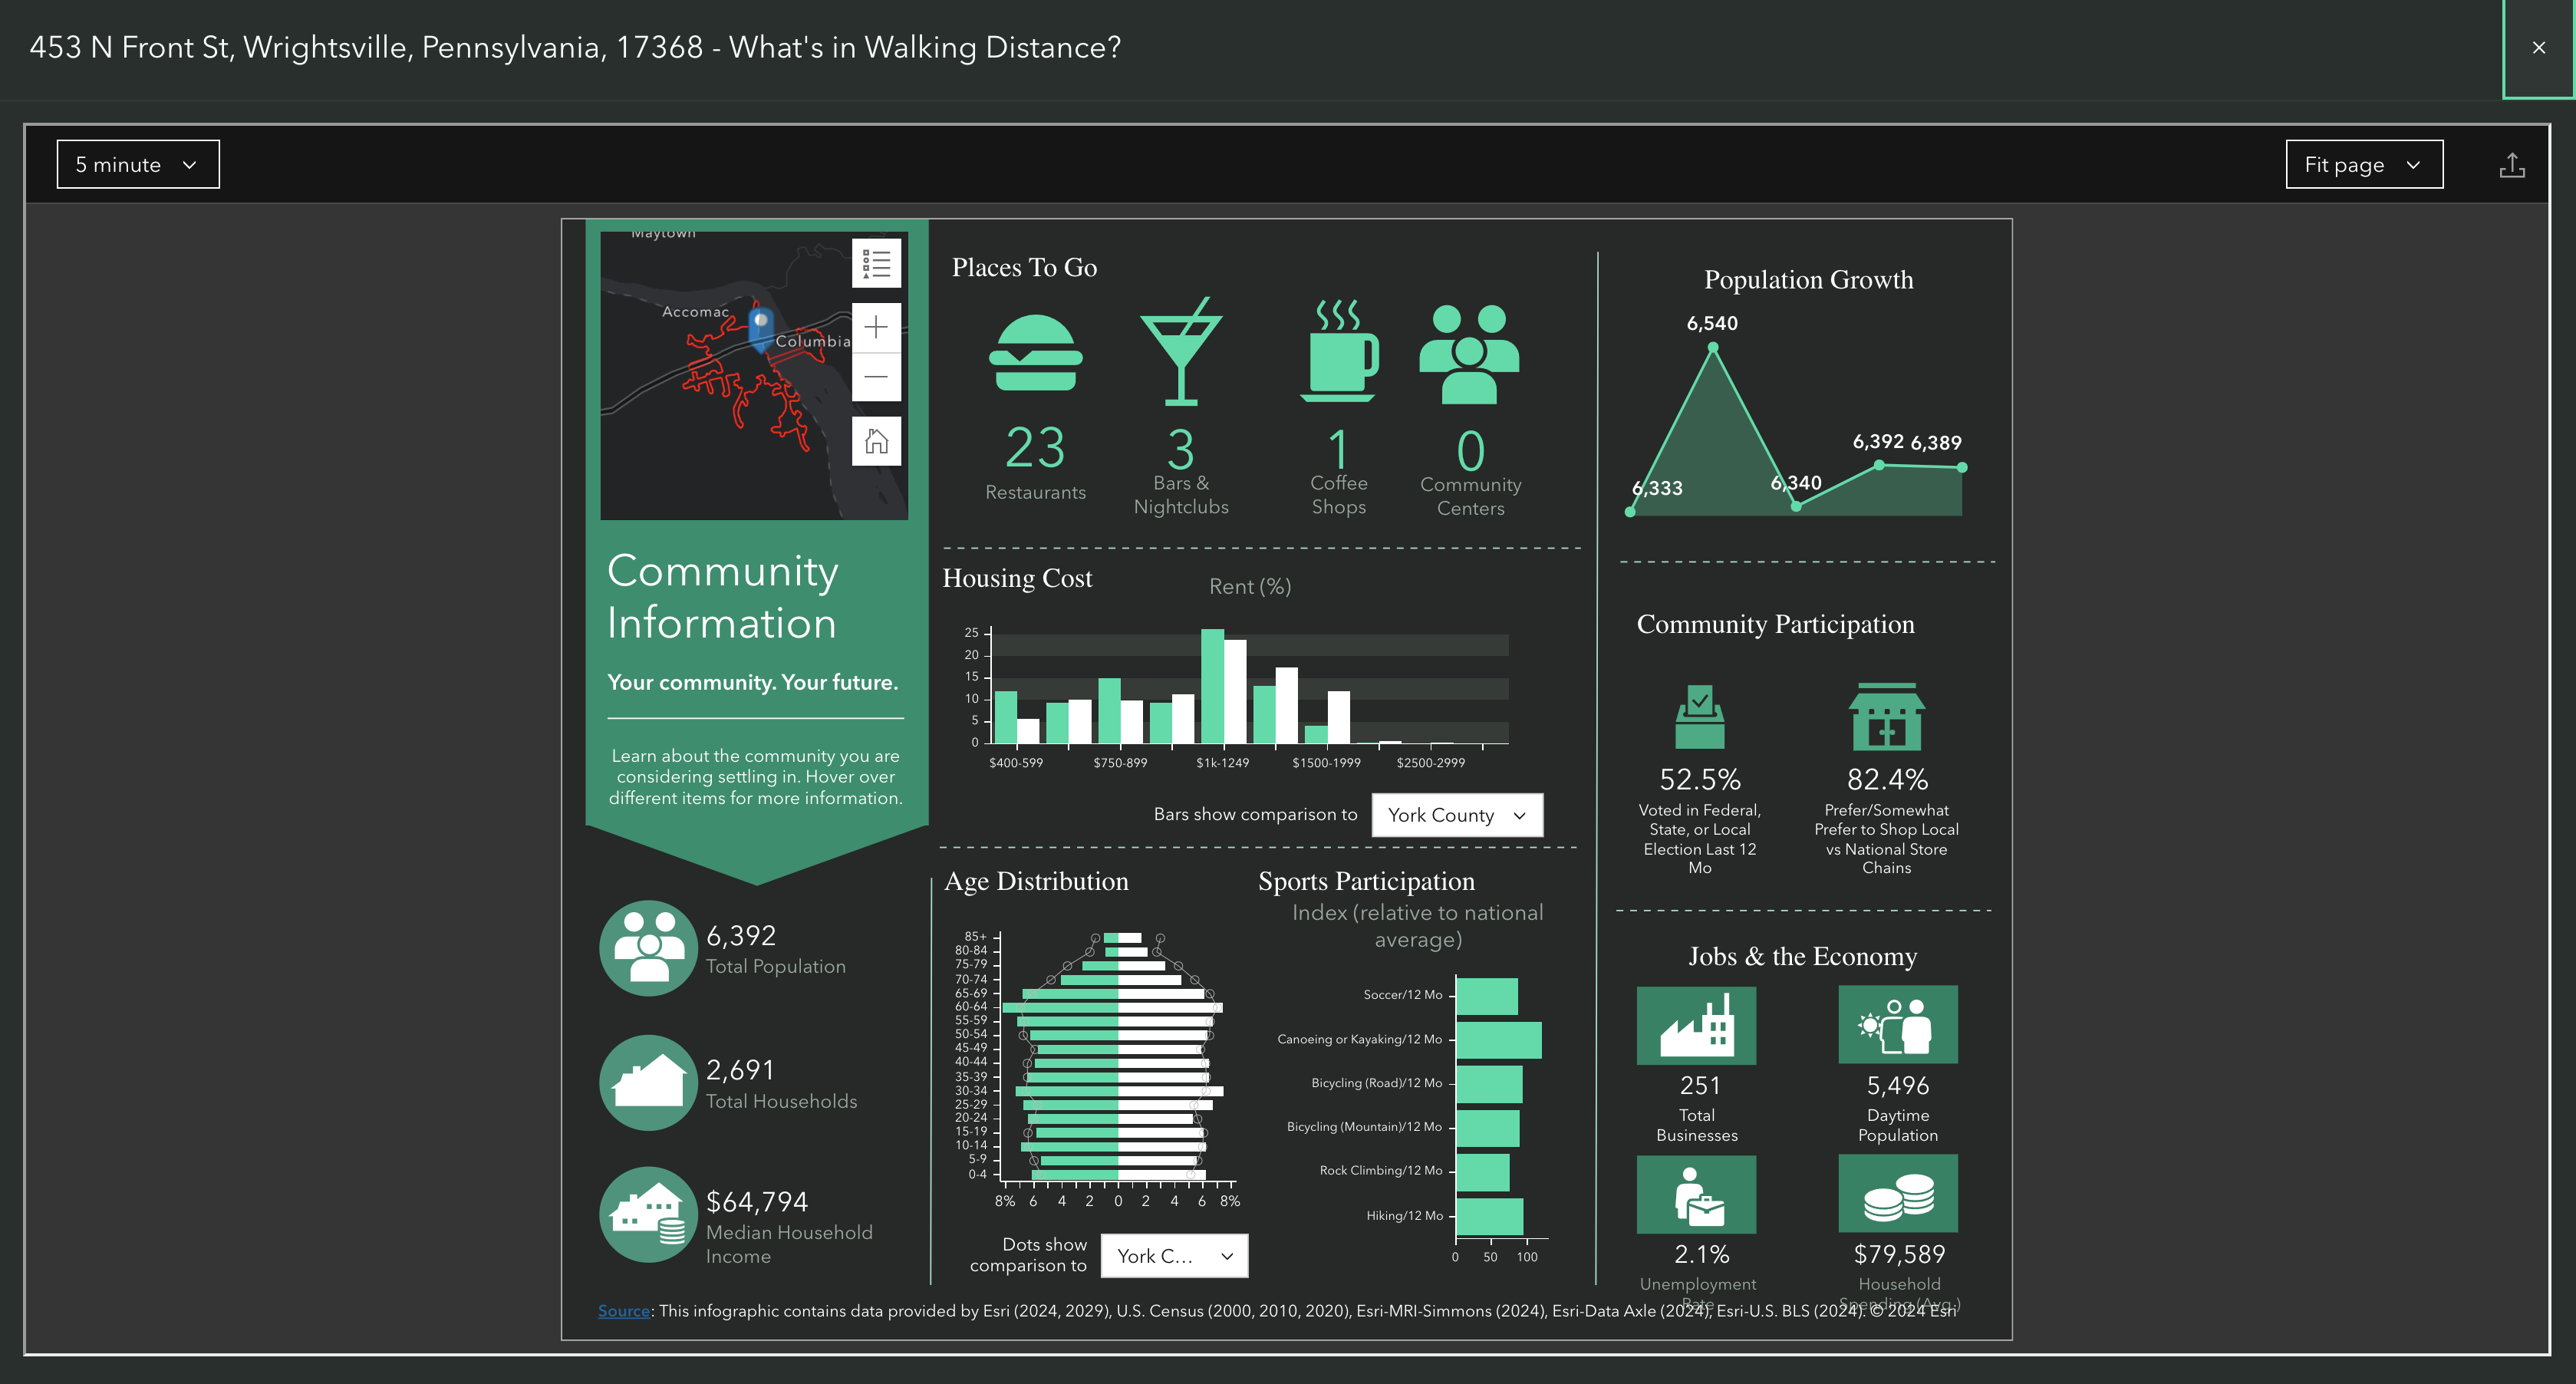
We had this observation for many college students graduating without a solid plan for their lives, especially where they want to live and work. Using the SettleSmart App, users can select Home, Work, and other areas and specify the desired commute distance to those areas. It also finds overlapping areas where users can live and reach Home, Work, and another area in the desired time frame. For overlapping areas, display an infographic showing data about the area and links to job postings and apartment listings. Lastly, it visualizes job opportunities within the preferred commute distance. Integrate live job postings tailored to your criteria and explore accommodations choices near potential workplaces. We built this app using Business Analyst API Call, ArcGIS JavaScript API, Calcite, Vite framework, and Infographics. The challenges we encountered involved the code needing to be recovered/overwritten when merging repository branches. We also needed more documentation on specific SDK workflows. Then, we had a wide range of accounting user behavior edge cases. Lastly, we had a challenge restructuring the codebase to accommodate growing functionality. Despite the challenges, we accomplished some things, such as deploying a functioning, live site built from scratch, cleaning an intuitive user interface, being consistent among design choices, and integrating job listings with the Indeed query and apartment listings with the apartments.com query. We’ve learned about the procedures for simultaneous software development, processes for merging conflicting code branches, scaling JavaScript projects or multi-user functionality, and the best practices to ensure success from project initialization to live deployments. In the future, we plan to add more infographics with the option to select walk or drive time for infographics, improve search boxes (type ahead, instant search), and allow users to toggle over map layers.
What inspired us is our observation of college students struggling with figuring out their lifestyles after graduation.
What it does (Visualizing job opportunities within preferred commute distance. Integrate live job postings tailored to your criteria and explore accommodation choices near potential workplaces.)
- User can select Home, Work and other areas and specifies desired commute distance to those areas
- App finds overlapping area where user can live and reach Home, Work and other area in desired time frame
- For overlapping area, display inforgraphic showing data about the area along with links to job postings and apartment li
- postings tailored to your criteria and explore accommodation choices near potential workplaces.
Challenges we ran into
- Code being lost/overwritten when merging repository branches
- Accounting wide range of user behavior edge cases '
- Restructuring codebase to accommodate growing functionality
Accomplishments that we're proud of
- Deployment of a functioning, live site built from scratch-
- Clean and intuitive user interface
- Consistency among design choices
- Integrated job listings with Indeed query
- Integrated apartment listings with Apartments.com query
What we learned
- Procedures for simultaneous software development-
- Processes for merging conflicting code branches
- Scaling Javascript projects to multi-user functionality
- Best practices to ensure success from project initialization to live deployment
What's next for Worklife Search
- More infographics with option to select-
- Add option to select walk/drive time for infographics
- Improve search boxes - type ahead, instant search
- Allowing user toggle over map layers
How we built it
- Initialized Github repository to hold our code
- Utilized Vite as our build tool to scaffold our project
- Calcite Design System Components to block out our UI
- ArcGIS Javascript SDK to add functionality to the components
- Made frequent commits/pulls from Github repository
- Collaborated with Github Codespaces and Visual Studio Code LiveShare to track changes in real time
- Incorporated infographic using ArcGIS Business Analyst API for demographic/income data
- Deployed live site to Github pages


Log in or sign up for Devpost to join the conversation.