-
-
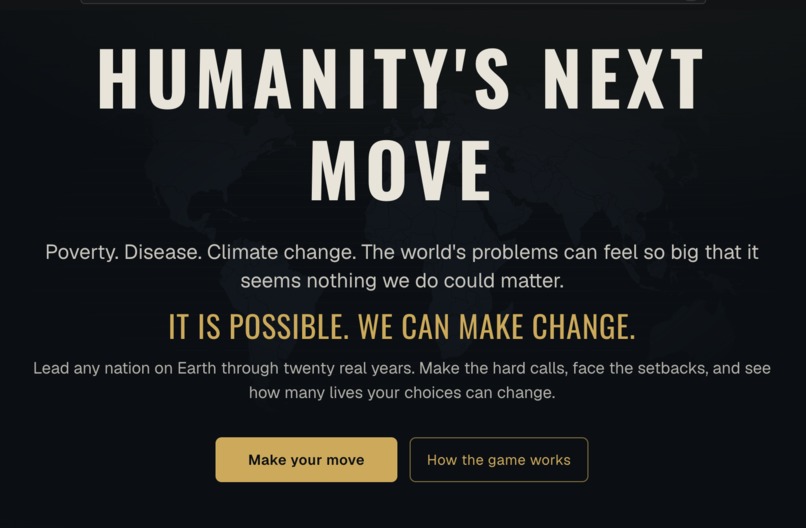
The landing page
-
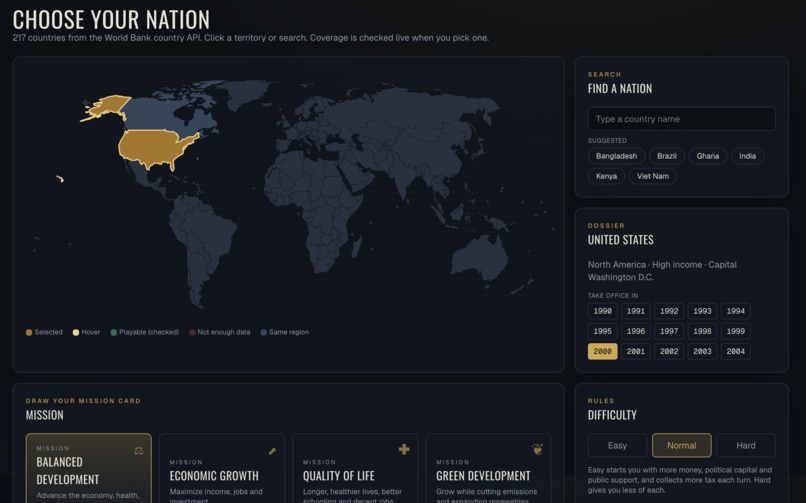
Select your nation
-
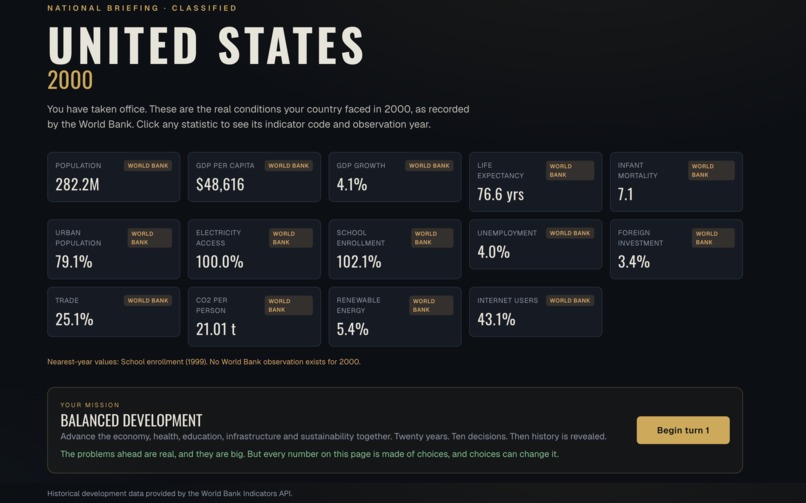
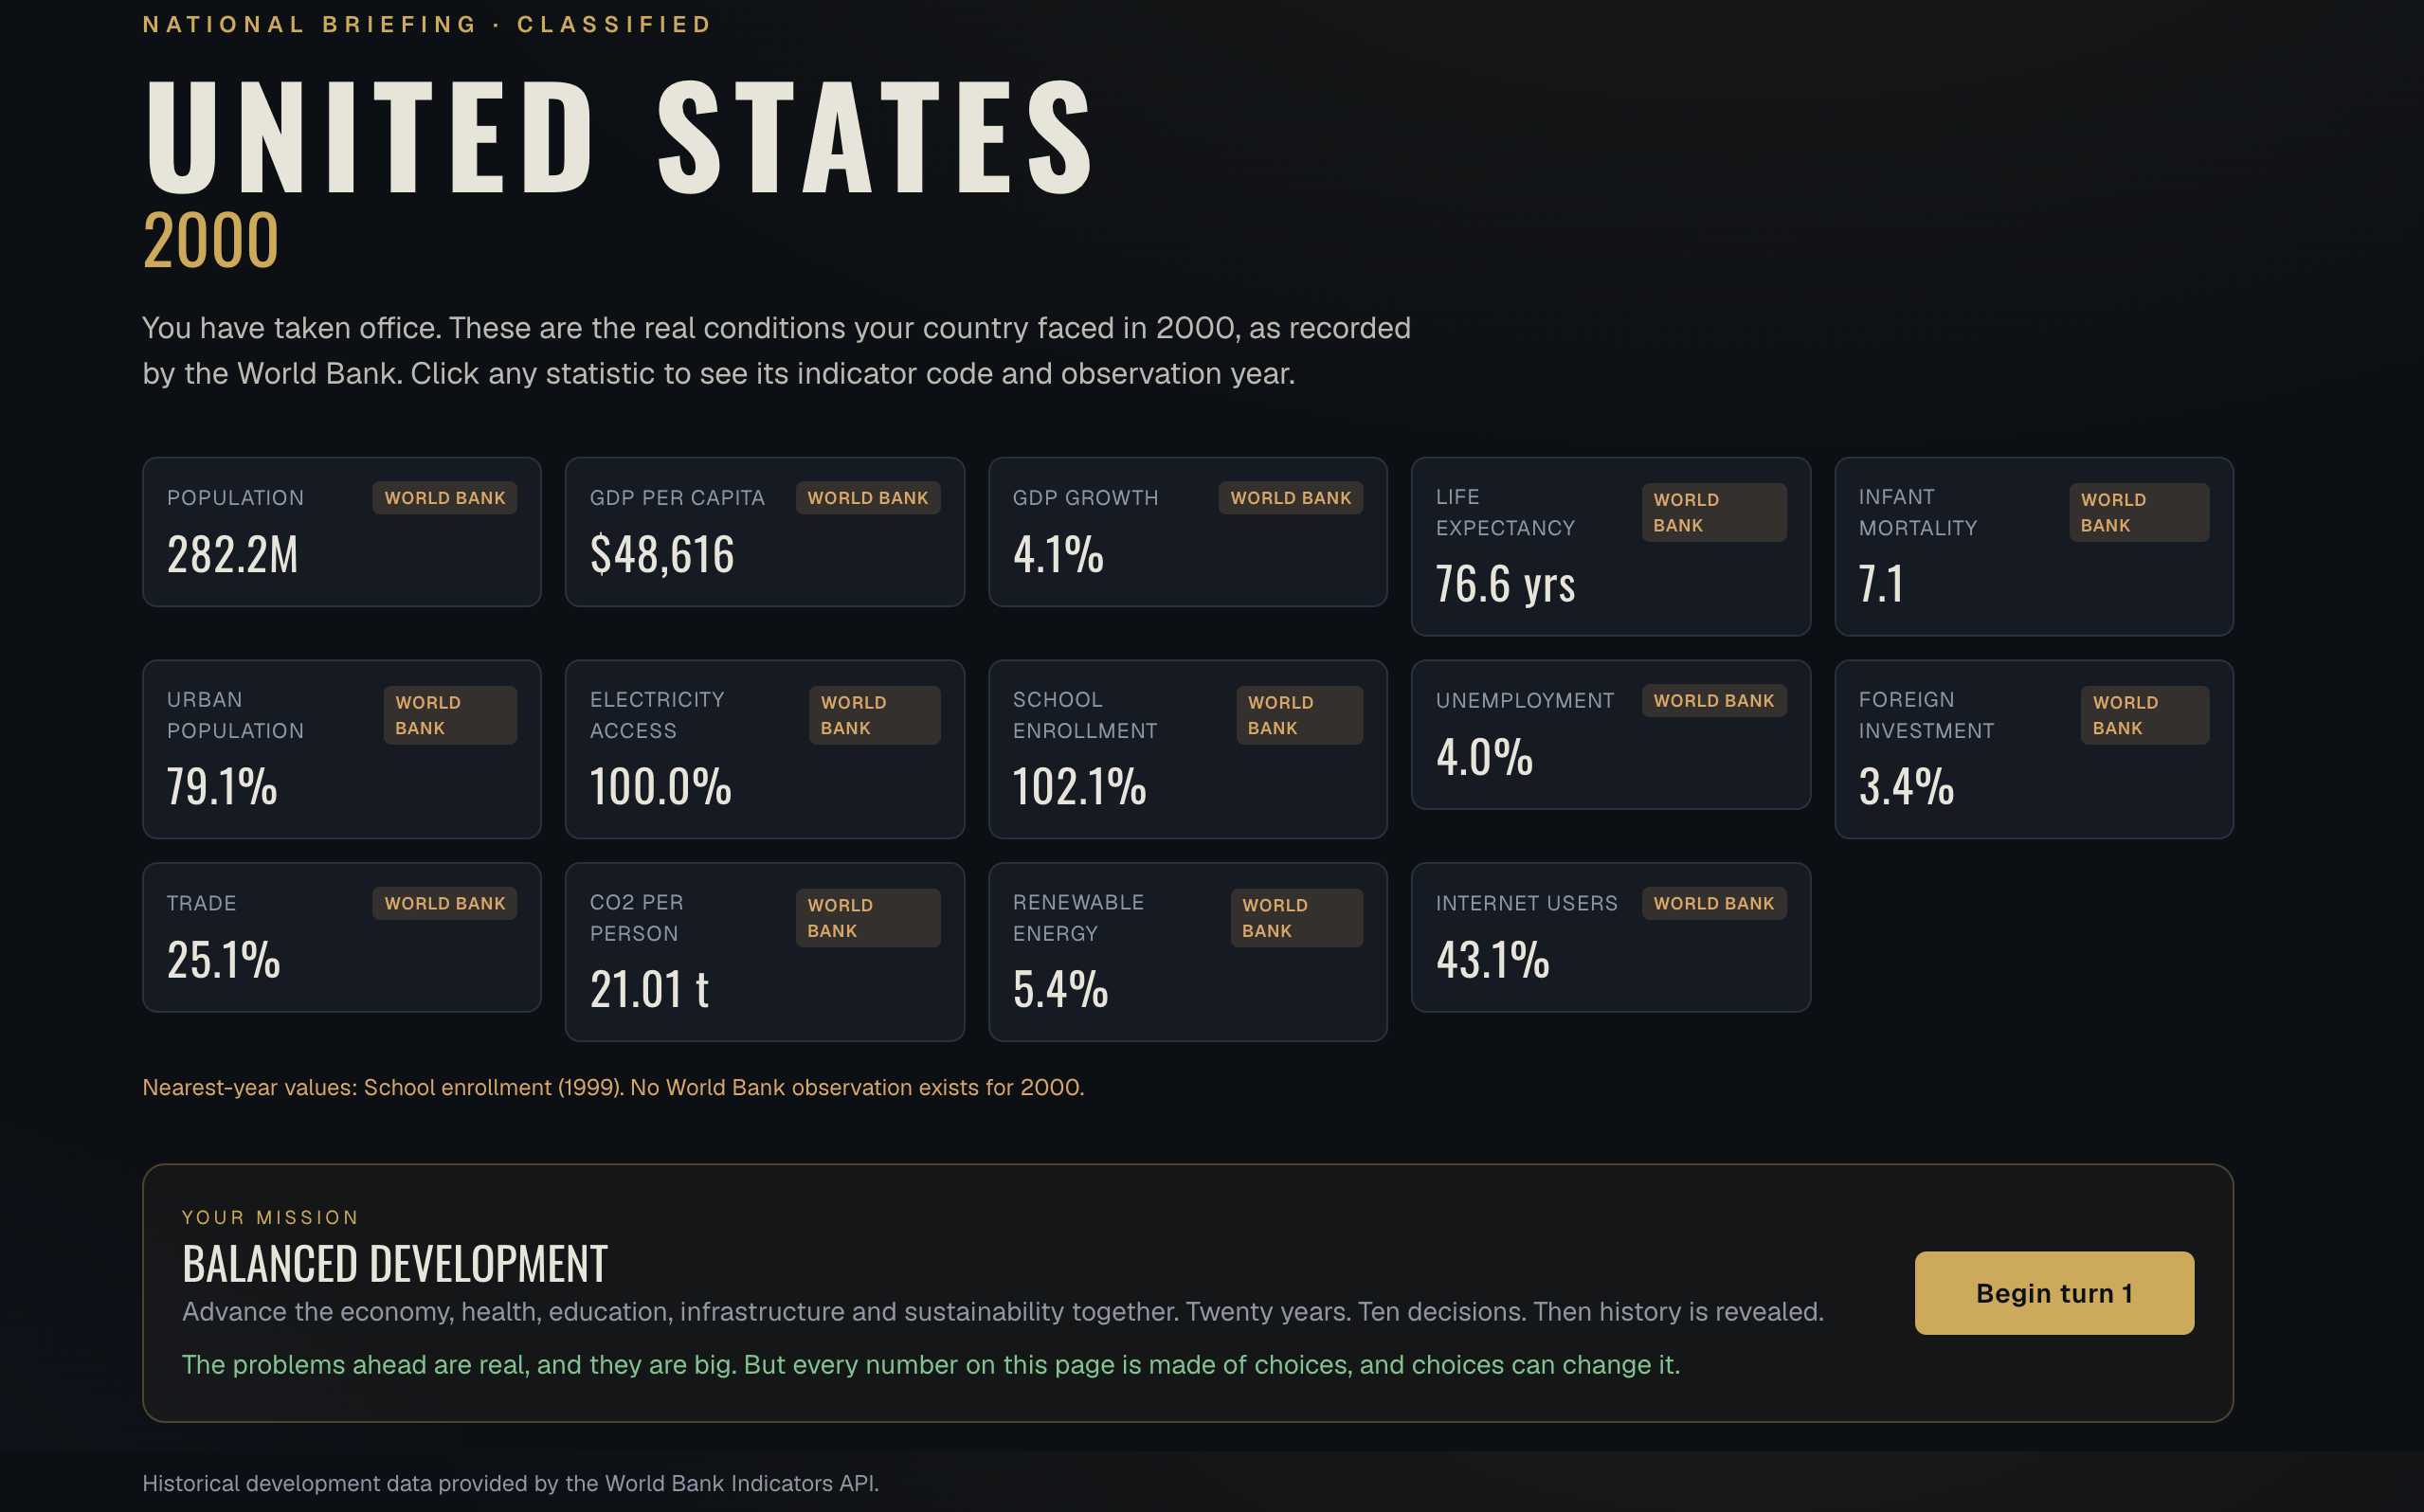
National briefing
-
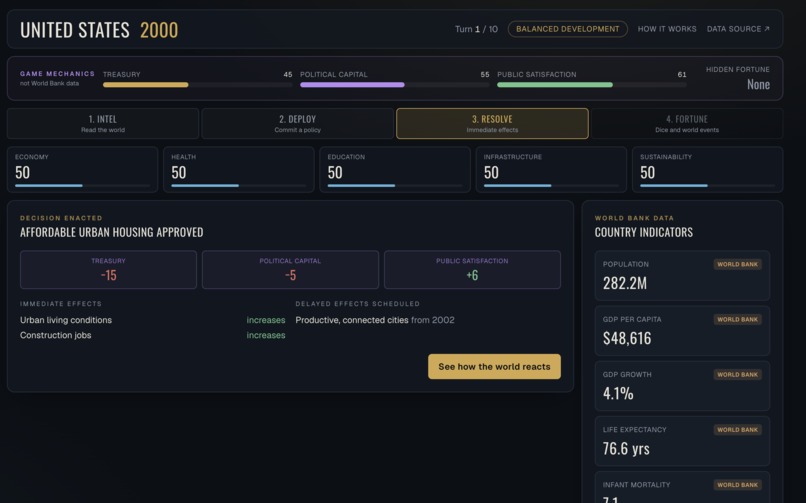
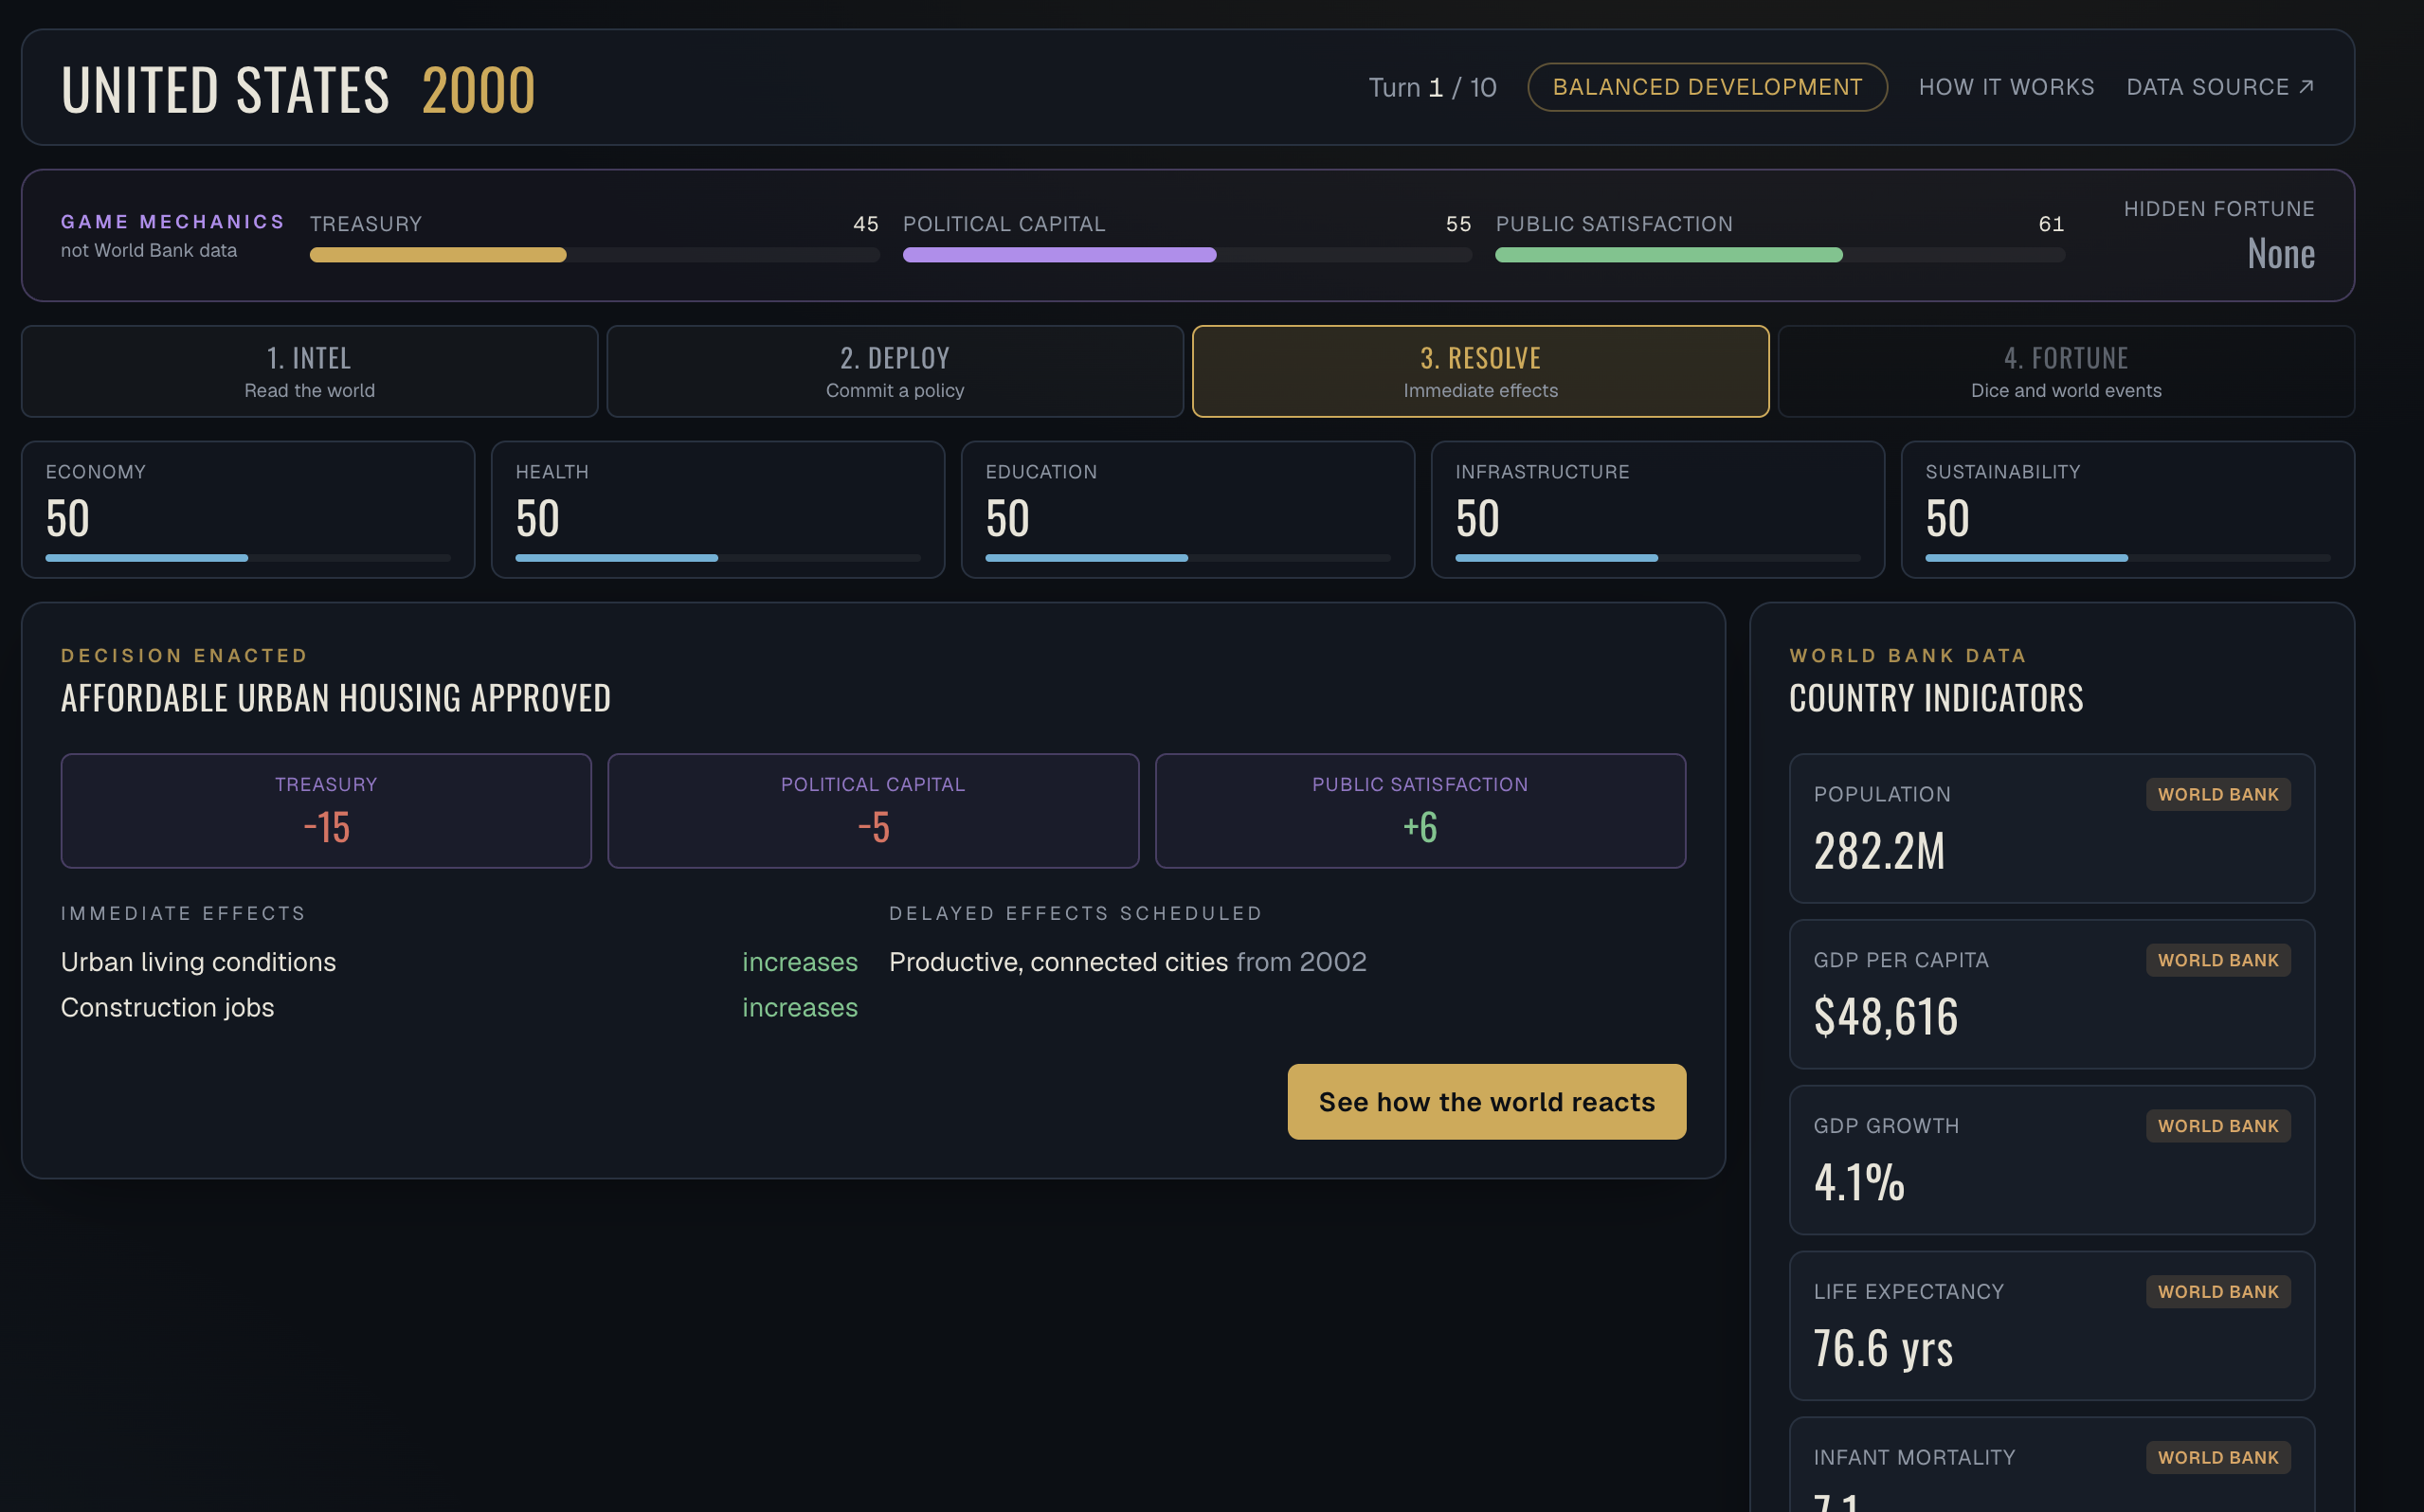
Resolve phase
-
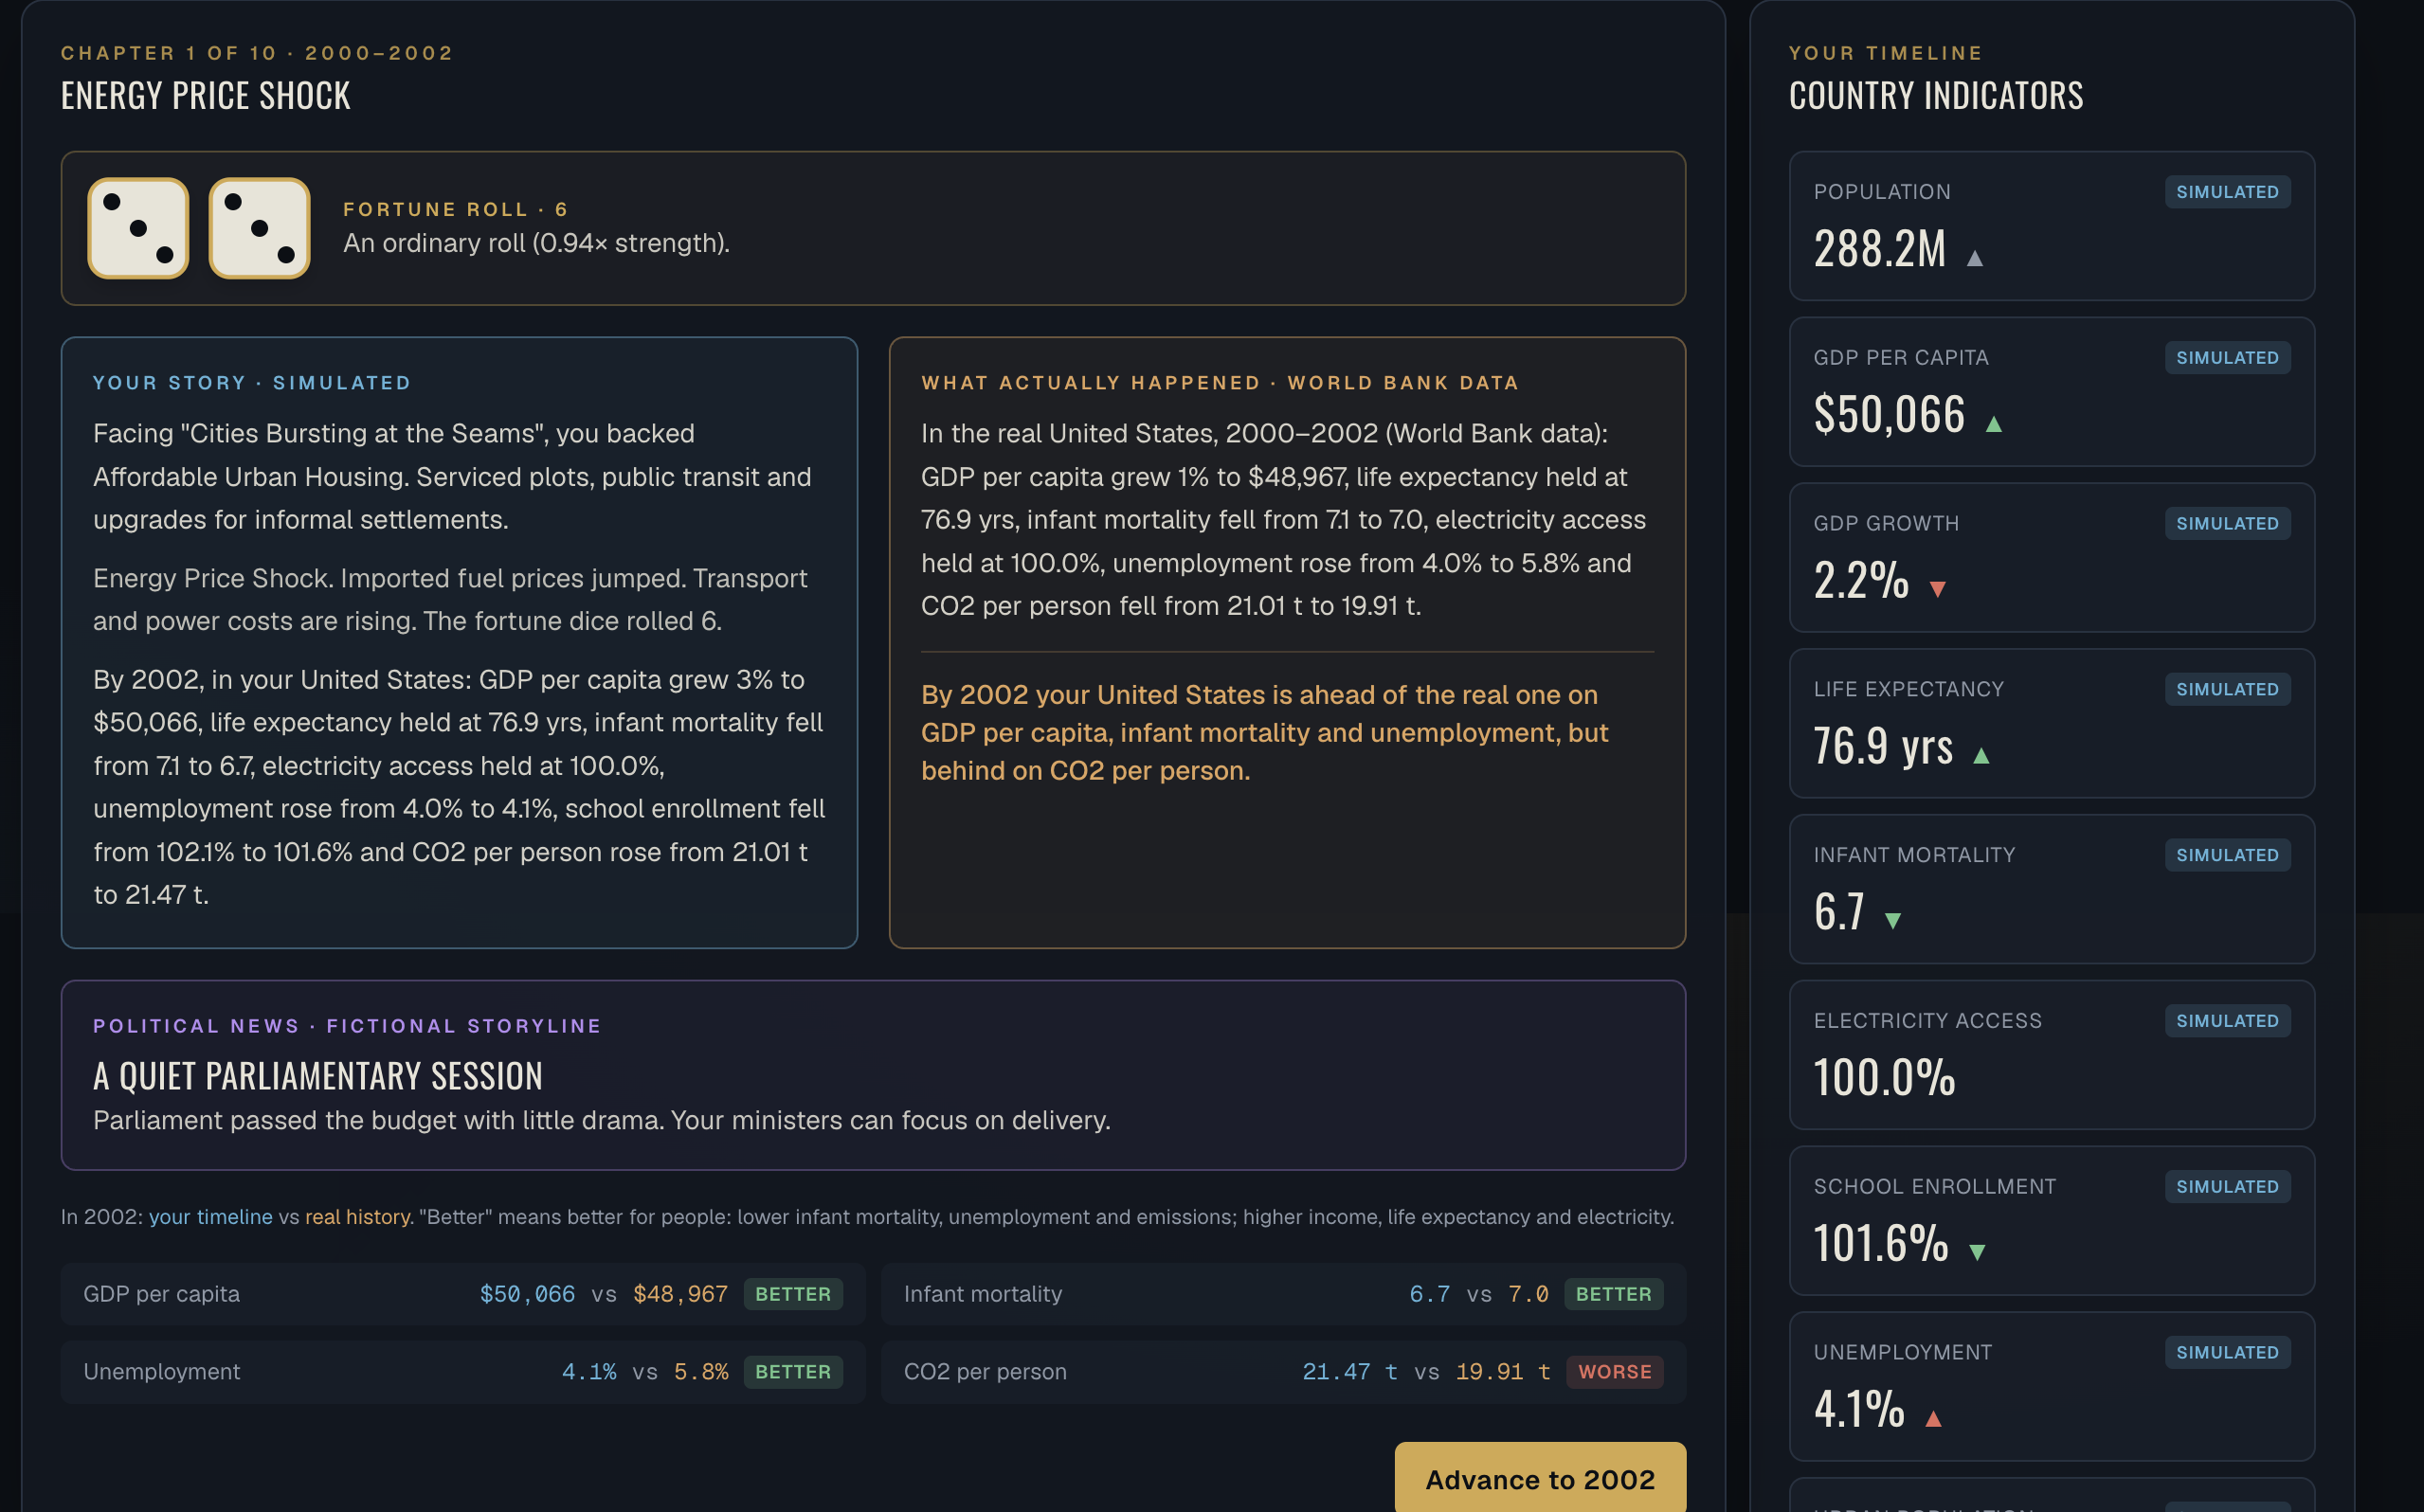
Chapter results
-
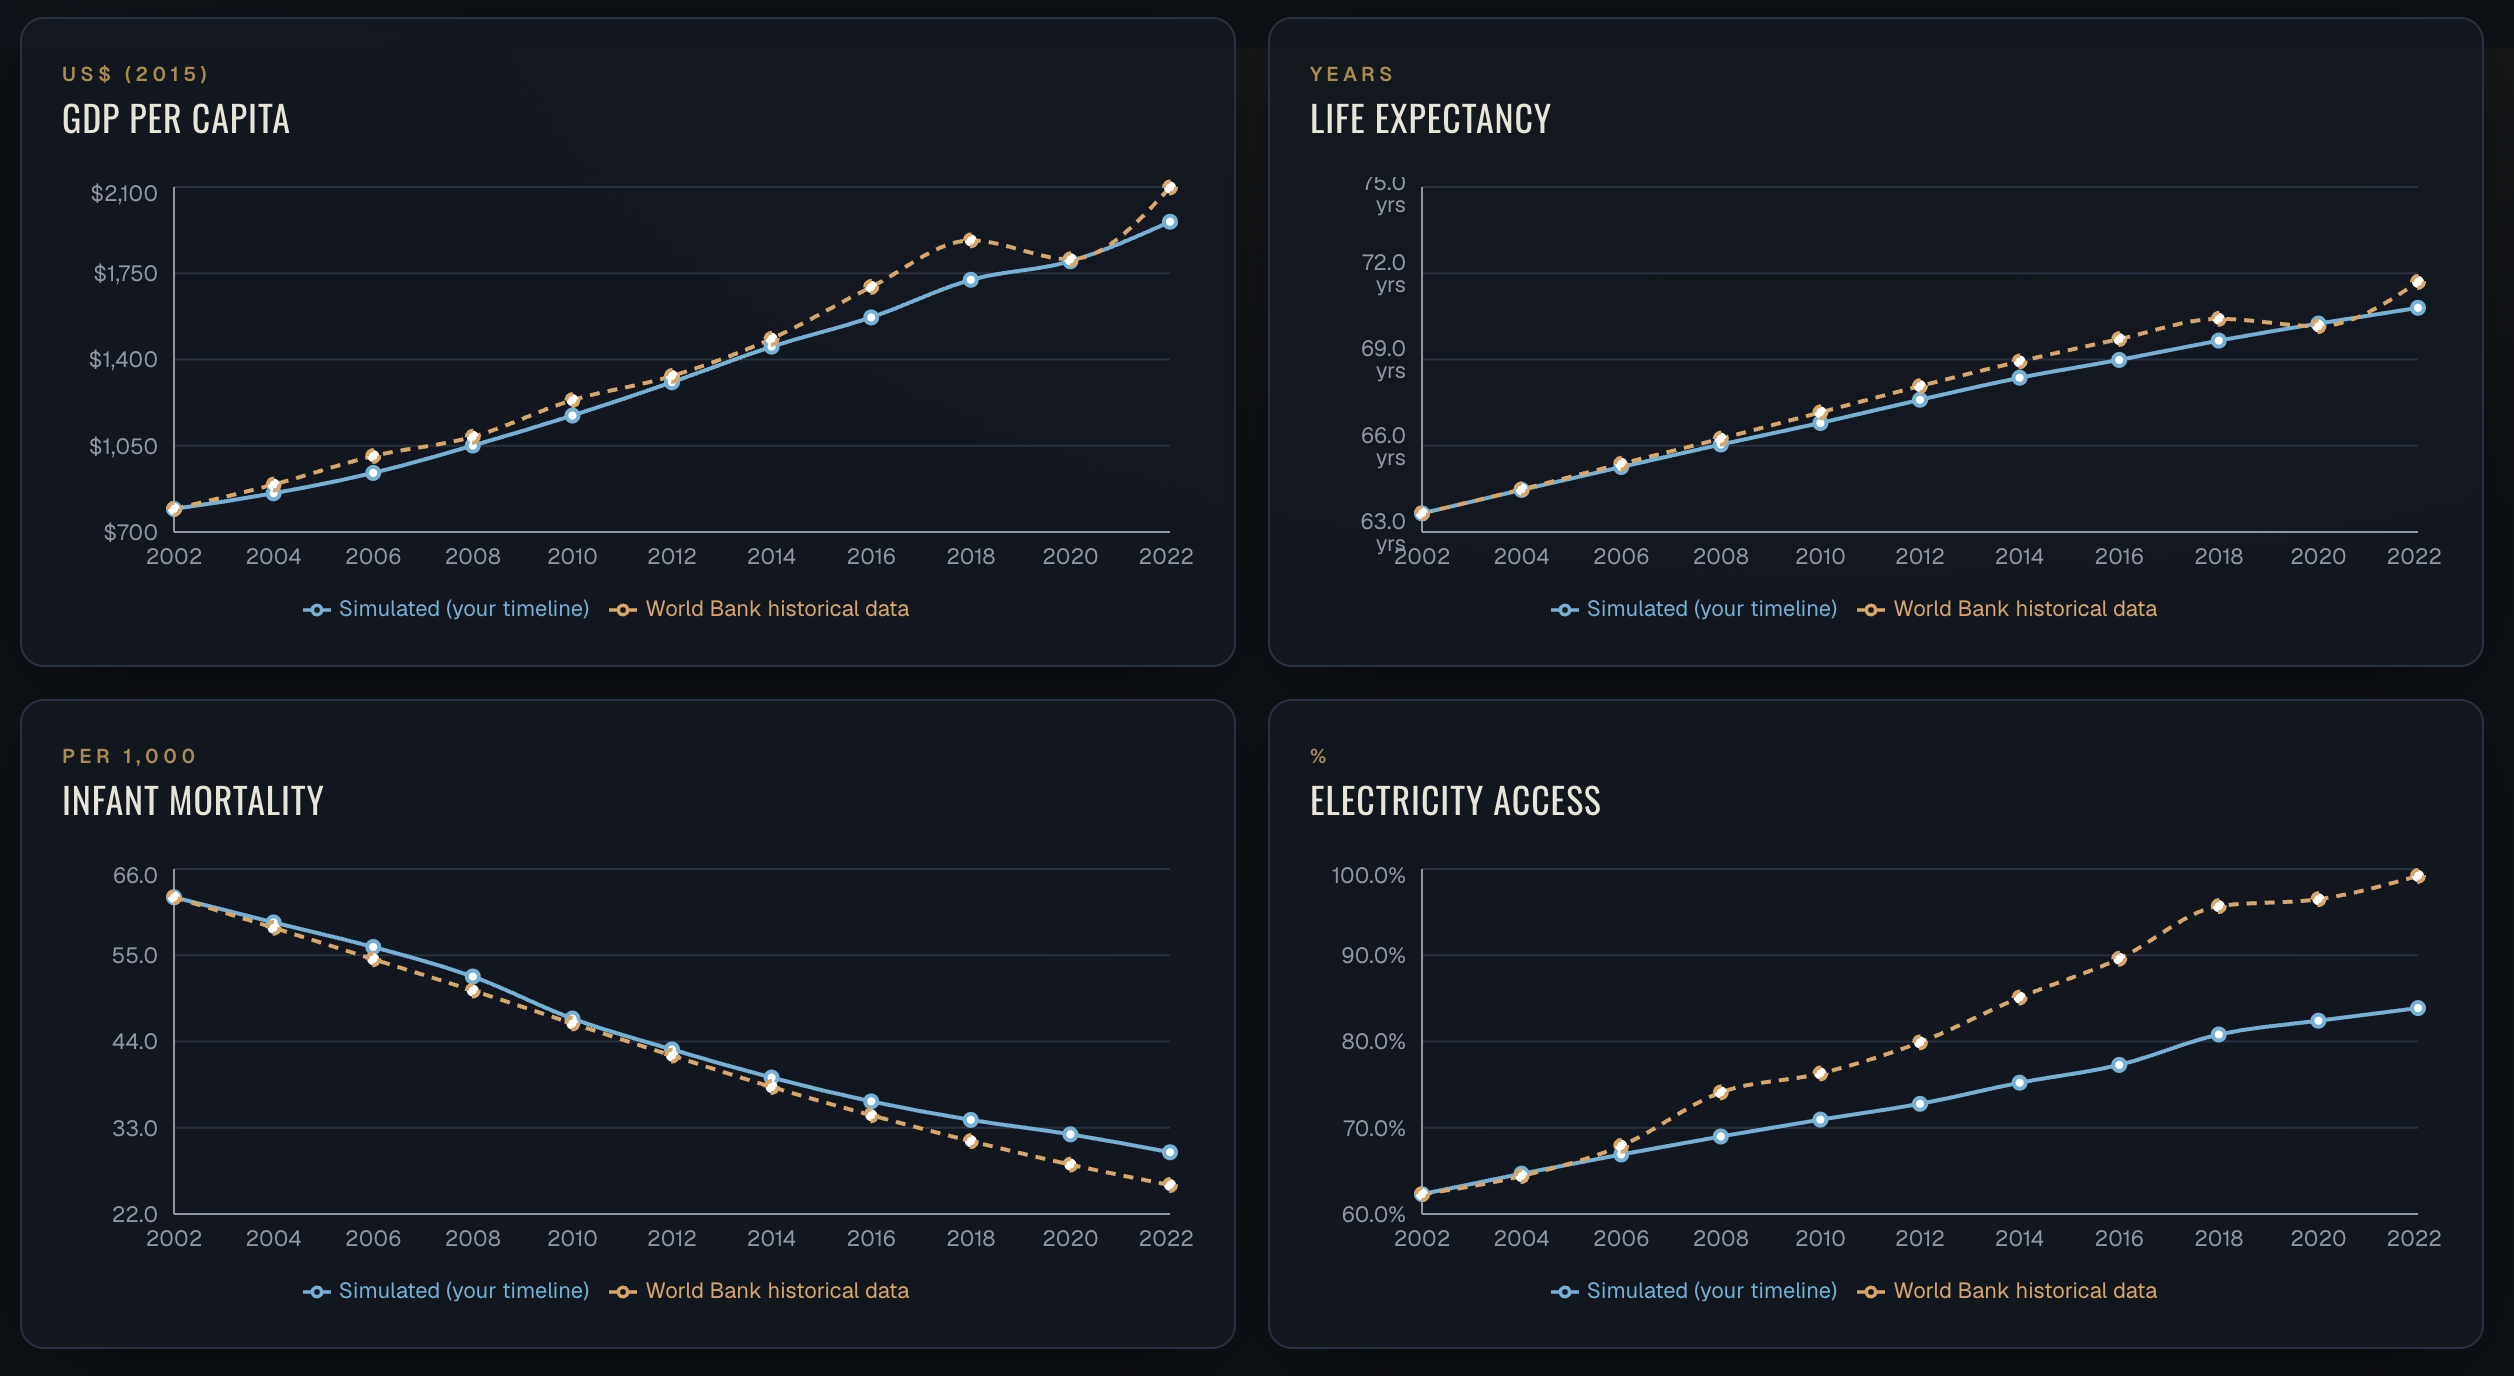
End of game results
Inspiration
Development statistics shape billions of lives, yet most people only ever meet them as charts they scroll past. We wanted people to feel the tradeoffs behind those numbers: why electrifying a country fast can mean burning coal, why schools built today only pay off a decade later, and why a global recession can undo years of progress. So we turned the World Bank's development data into a game where you make those decisions yourself, and then face what really happened.
What it does
Humanity's Next Move is a turn-based strategy game built on real data from the World Bank Indicators API.
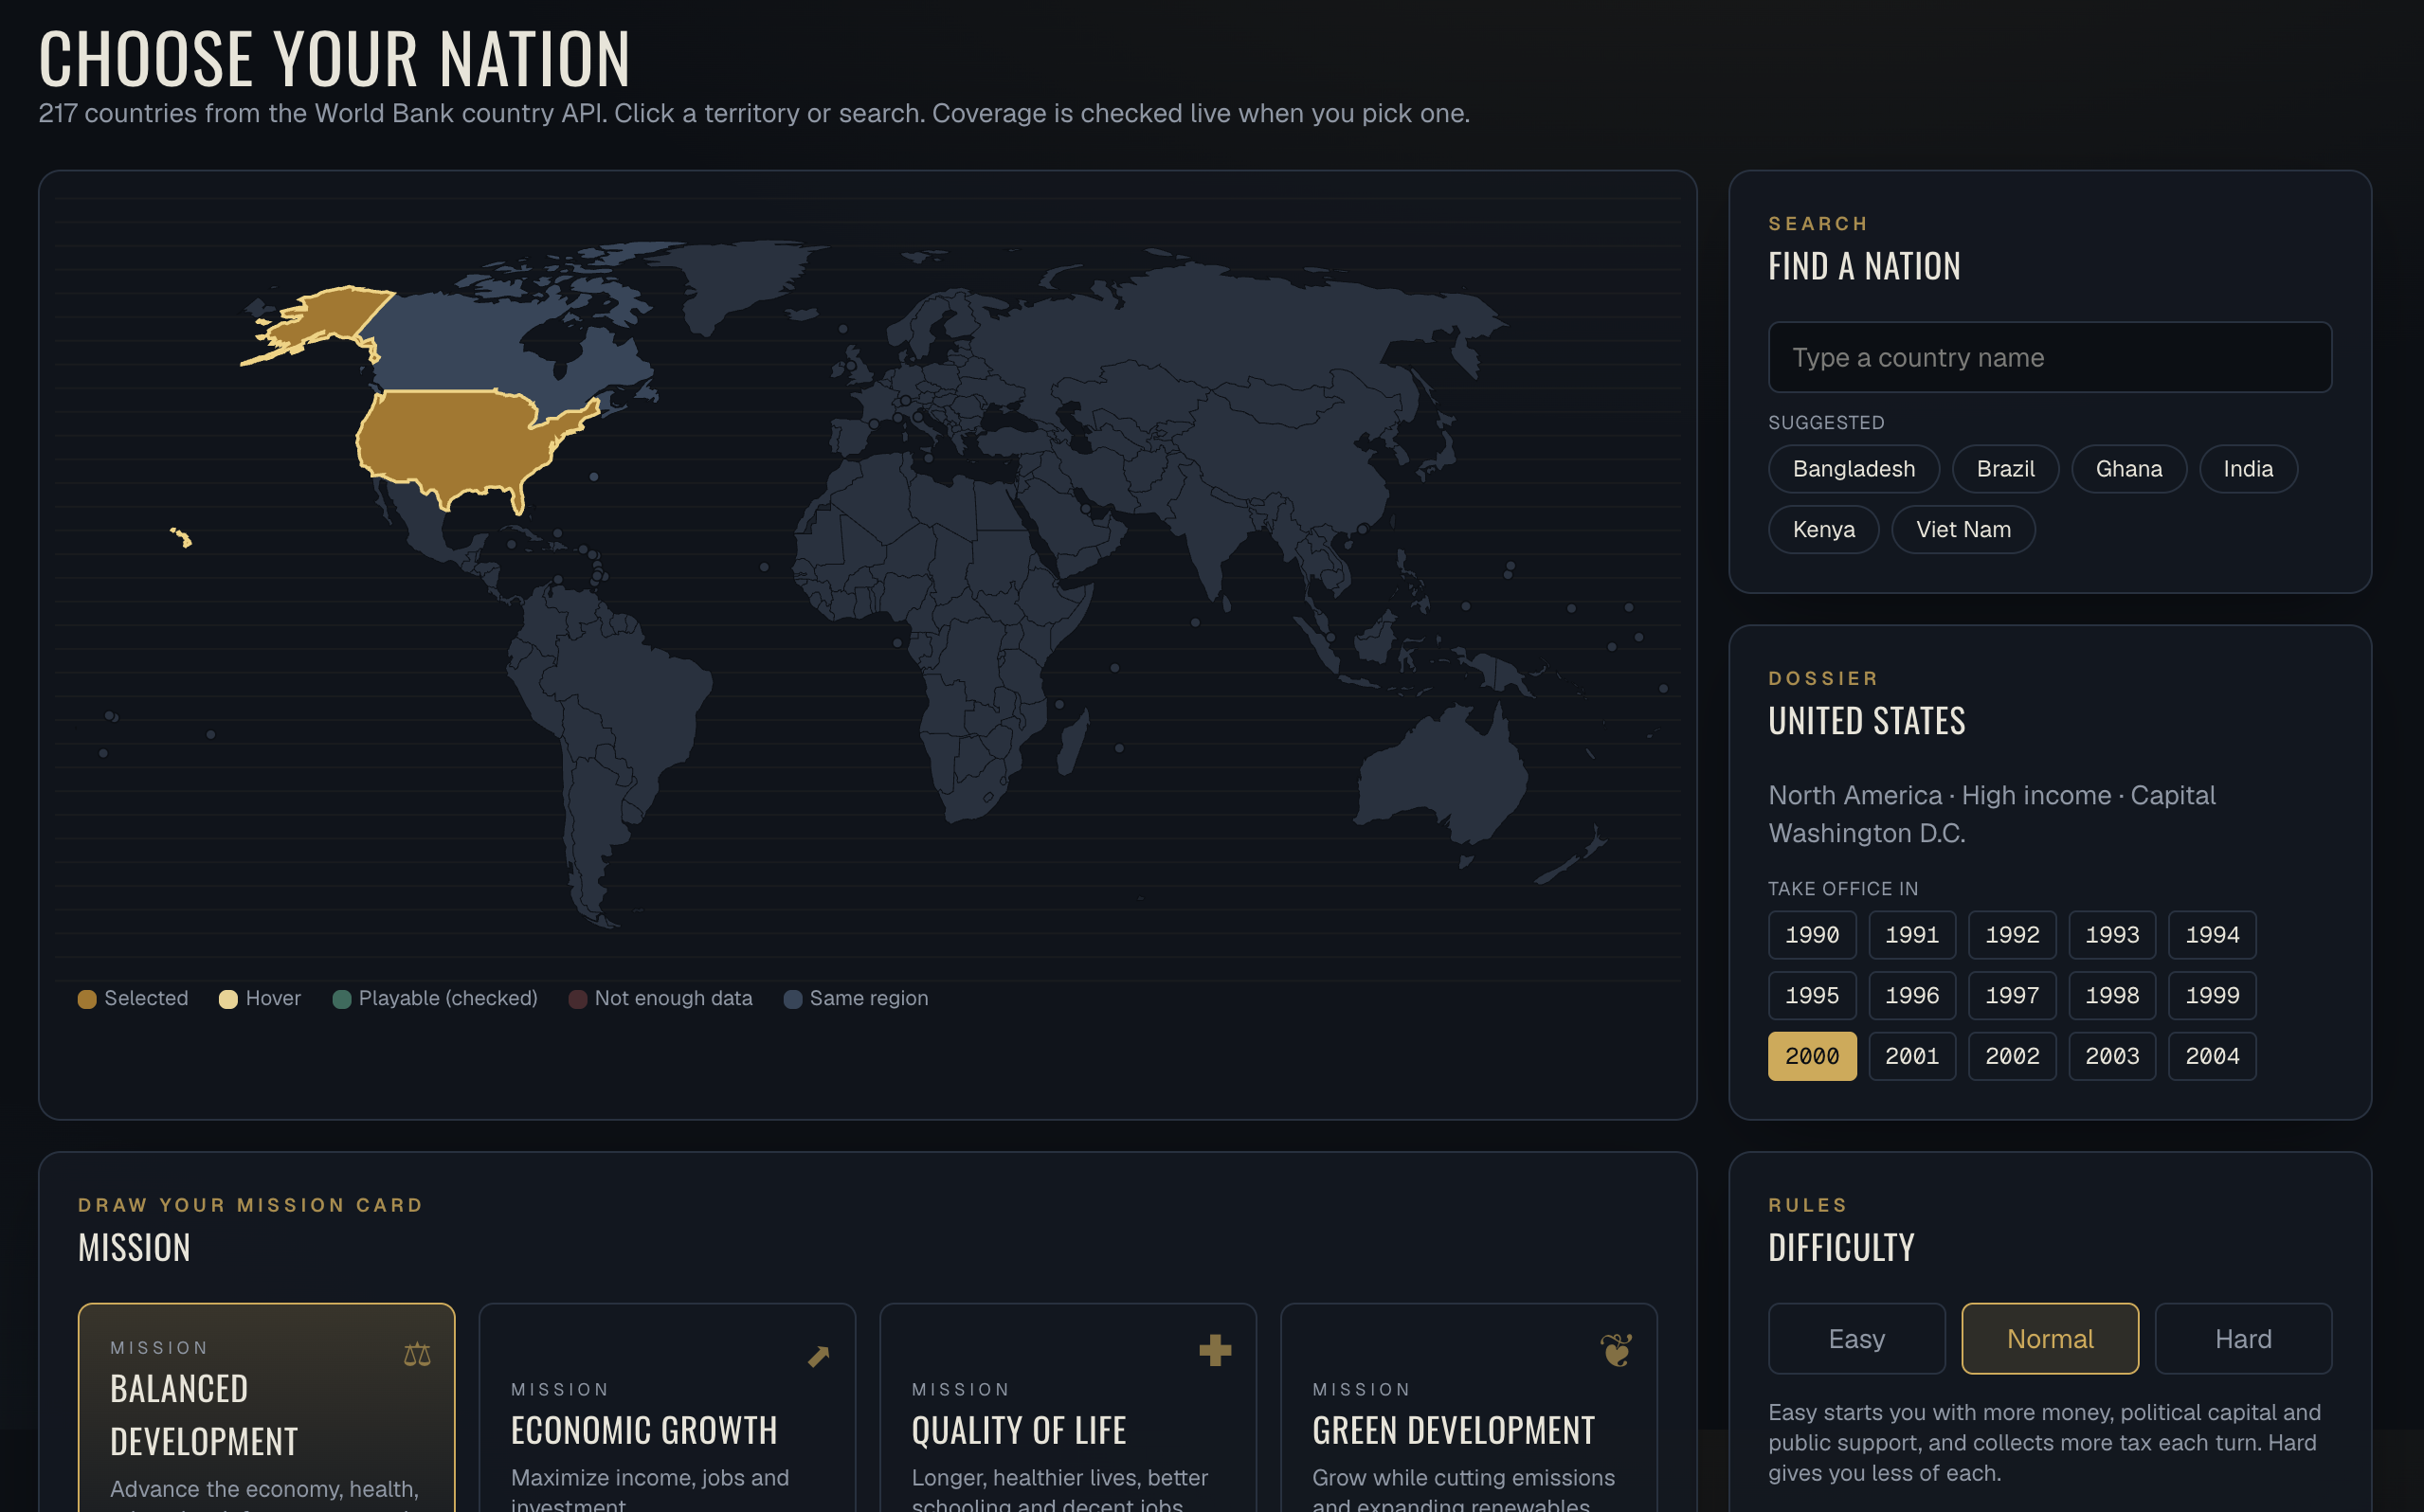
- Pick any nation on an interactive world map. 187 of the 217 countries in the World Bank data have enough coverage for a 20-year game, and start years are enabled only where real data exists.
- Take office in a real year and see the country's real starting conditions: population, income, life expectancy, infant mortality, electricity access, schooling, emissions and more. Every number shows its World Bank indicator code and observation year.
- Govern for 10 turns of 2 years. Each turn you read a world briefing built from real global data, face a national problem generated from your country's weaknesses, and deploy one policy (clinics, power grids, girls' education, renewable energy, tax reform and more). Policies have costs, risks and delayed effects that pay off turns later.
- Roll the fortune dice. The world reacts with a slowdown, commodity boom, drought or investment wave. The odds come from real world data and your economy's structure, and two dice decide how hard the event hits.
- Compete on the regional board. Your real neighbors are your rivals. When your simulated development passes theirs, their territory turns your color. Lead your region to earn a bonus. You win by saving lives and raising living standards, never by conquest.
- Make high-stakes calls. Each national problem comes with the responses most relevant to your country, ranked from its own data with a reason for each. Many are real-world big bets, such as an IMF adjustment loan, a mega-dam, free primary education, or nationalizing oil, with large payoffs and a real chance of backfiring.
- Spot the bad deal. Every turn hides one or two harmful choices among the genuine options, with respectable names like "Discretionary Development Fund" or "Grand Presidential Palace and National Stadium." Only after you enact one does the fine print reveal the slush fund, the crony contracts, the cuts to clinics, how much reached your pocket, and what it cost your people.
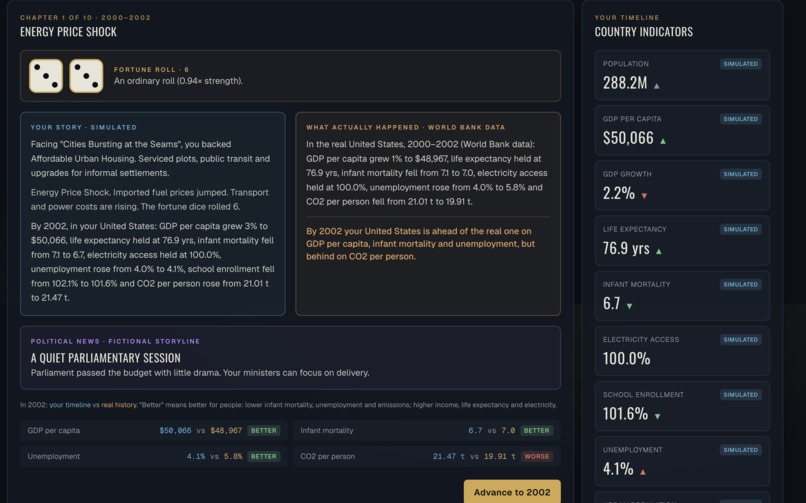
- Live the story. Every turn ends with a chapter: what happened in your country because of your choice, the world event, a fictional political twist (elections every four years, protests, scandals), and then what actually happened in the real country over the same two years, straight from World Bank data.
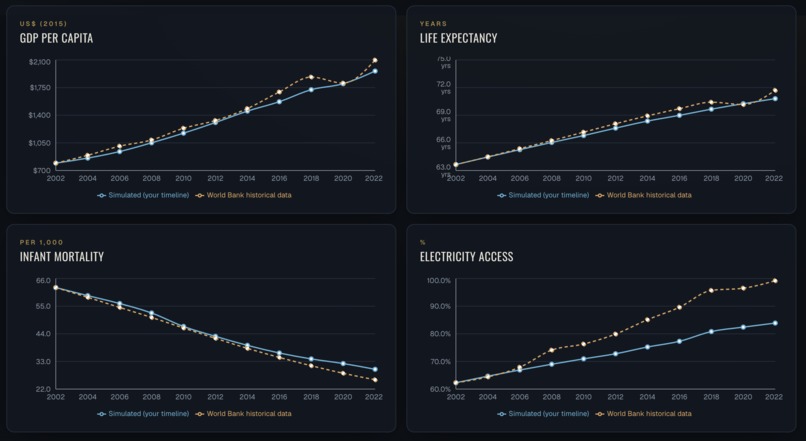
- The reveal. At the end, the game shows your full timeline against the country's real World Bank history. Charts, a "History Delta" by category, and an impact ledger translate the difference into infant lives saved, people with electricity, and tonnes of CO₂.
How it addresses AI for Social Good
- It is built for education. Students and the public can explore development tradeoffs for almost any country on Earth. By following each decision across 20 years, players see how choices made today lead to real change over time and that the problems these countries face are hard but not impossible to solve.
- The goal of the game is human welfare: the score rewards health, education, infrastructure, income, and sustainability, and every policy is tagged with the UN Sustainable Development Goals it targets.
- The impact ledger turns abstract indicator changes into people: babies who survived their first year, households with power, and emissions avoided or added.
How we built it
- Data: the World Bank Indicators API v2 (JSON, no key). The app requests each country's full history in one batched call (several indicators joined with semicolons,
source=2), fetches world and regional aggregates for global conditions, and batches all regional rivals into one multi-country request. Responses are validated with Zod, paginated, retried on failure, and cached for 7 days. Missing values are never treated as zero: the game uses the exact year, then the nearest real observation within 2 years (flagged in the interface), then leaves the indicator out. - No peeking at the future: during play, the browser only receives your country's data up to the start year. Its real future is requested only for the final reveal.
- Simulation: a deterministic, seeded engine. Each simulated year combines the previous value, the country's own trend before the game started, the player's policy, delayed effects of earlier policies, the world event, and interactions such as trade exposure amplifying global slowdowns. All rules live in one file, so they are easy to explain and tune. The same seed and the same decisions always produce the same game.
- Country-relevant options: each national problem has a pool of candidate policies, ranked for the chosen country from its own data (farming share, electricity access, income level, emissions, and more).
- Storytelling: each turn's chapter is generated from the simulation and, separately, from real World Bank data for the same two years, fetched turn by turn so later history stays hidden. Political events are fictional and labeled as such.
- Realistic, risky options: twelve high-stakes reforms drawn from real policy debates, each with delayed effects and a 25 to 40 percent chance of a serious setback, offered only where the country's data makes them plausible (for example, nationalization only where natural resource rents are significant).
- Scoring: each indicator scores 50 + 50 × tanh(change ÷ scale), so 50 means no change. Categories average their indicators and the chosen mission weights the categories. History is scored with exactly the same formula, using only indicators with a real end-year observation.
- Calibration: we played hundreds of automated games per country against real data and tuned policy strength so that active play beats "doing nothing" by several points, while beating history still depends on what really happened in that country.
- Stack: Next.js (App Router), TypeScript, React, Tailwind CSS, Recharts, d3-geo with world-atlas map shapes, Zod, Vitest, and Playwright for browser testing.
Challenges we ran into
- Uneven data coverage. Some indicators start late (Vietnam's electricity data begins in 1997) and one code from our original plan has been removed from the API (
EN.ATM.CO2E.PC, replaced byEN.GHG.CO2.PC.CE.AR5). We built a coverage check that measures real availability per country and year, which expanded the playable set from 3 countries to 187. - Balance. Our first model let almost any choices beat history; after scaling policies down, decisions stopped mattering. Automated calibration runs against real data helped us find a balance where choices matter and history is still a real opponent.
- Honesty about simulated numbers. We kept real and simulated data separate in the code's types and in the interface, labeled every value by source, and made sure missing data never turned into a zero.
Accomplishments that we're proud of
- Any of 187 countries is playable, all from live API calls, with no historical values hard-coded.
- The final reveal: your timeline, the AI's timeline, and real history, scored with the same formula.
- An impact ledger that makes the stakes human.
- A data transparency page that runs a live World Bank API request and shows the exact URL and values.
- 40 automated tests and full browser playthroughs across countries in different regions.
What we learned
- Real development data is patchy, and handling gaps honestly is a design problem, not just a cleanup task.
- A small, explainable model with clear rules is easier to trust and to present than a complex one.
- Games are a powerful way to communicate tradeoffs that charts alone do not convey.
What's next
- A public deployment so anyone can play.
- A historical analog engine that finds similar country-years to inform plausible ranges.
- Classroom mode and multiplayer, with several players governing neighbors in the same region.
- Daily challenge seeds and shareable result cards.
Limitations
- Policy effects are simplified game rules chosen to be plausible and explainable; they are not estimated causal effects.
- The regional development index is a simple game index, not the UN Human Development Index.
- Impact ledger figures are simulated estimates from simplified formulas.
Data sources and credits
- World Bank Indicators API (development indicators, country list, regional and world aggregates). Historical development data provided by the World Bank Indicators API. The World Bank does not endorse the game's simulated outcomes.
- Natural Earth map shapes via the world-atlas package (public domain).
- i18n-iso-countries package for matching map shapes to country codes.
Use of generative AI
This project was built with the help of Claude Code, Anthropic's AI coding assistant. Claude Code generated most of the application code, tests, and documentation under our direction, including the data layer, simulation engine, storytelling, and interface. We designed the concept, directed the features, reviewed and tested the output, and made the product decisions. The game itself makes no calls to any AI service.
Built With
- d3.js
- nextjs
- playwright
- react
- recharts
- tailwindcss
- typescript
- vitest
- world-bank-api


Log in or sign up for Devpost to join the conversation.