-
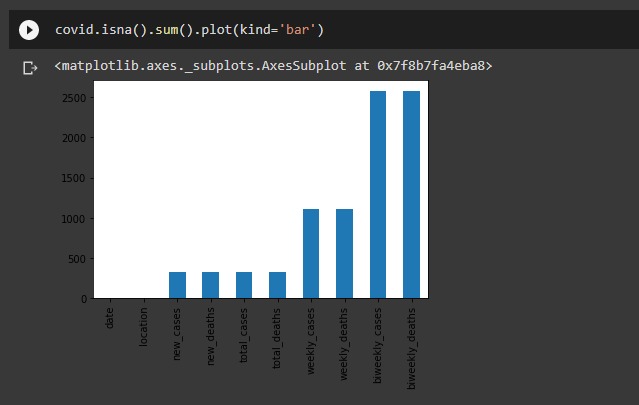
The output, its from an old data set

Inspiration
I always wondered how the websites publish an increase or decrease of covid patients in an area just by the dataset
What it does
Though its an old dataset, it shows the trends of covid patients
How we built it
I used the dataset from https://covid.ourworldindata.org/data/ecdc/full_data.csv and Google Collab for this
Challenges we ran into
I am just learning python, so you can see that the starting snippets will be something very basic commands in python
Accomplishments that we're proud of
I finally created a bar graph with the trend of covid patients ( its an old dataset)
What we learned
To use python and machine learning
What's next for Working with data set
I want to explore more, create linear regression models and test it
Built With
- googlecollab
- python

Log in or sign up for Devpost to join the conversation.