-

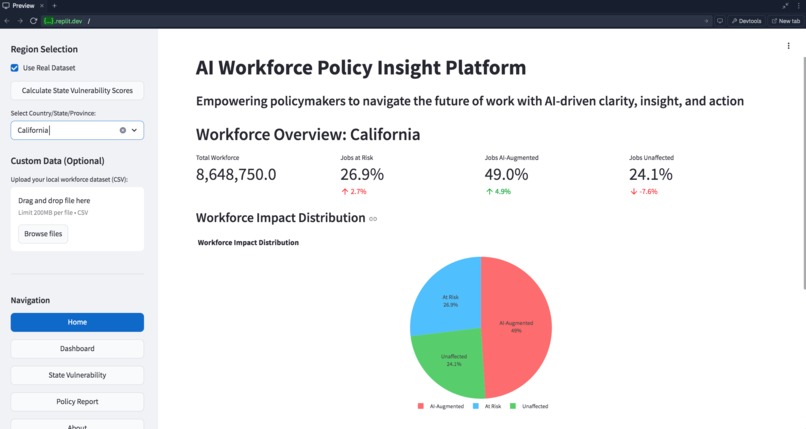
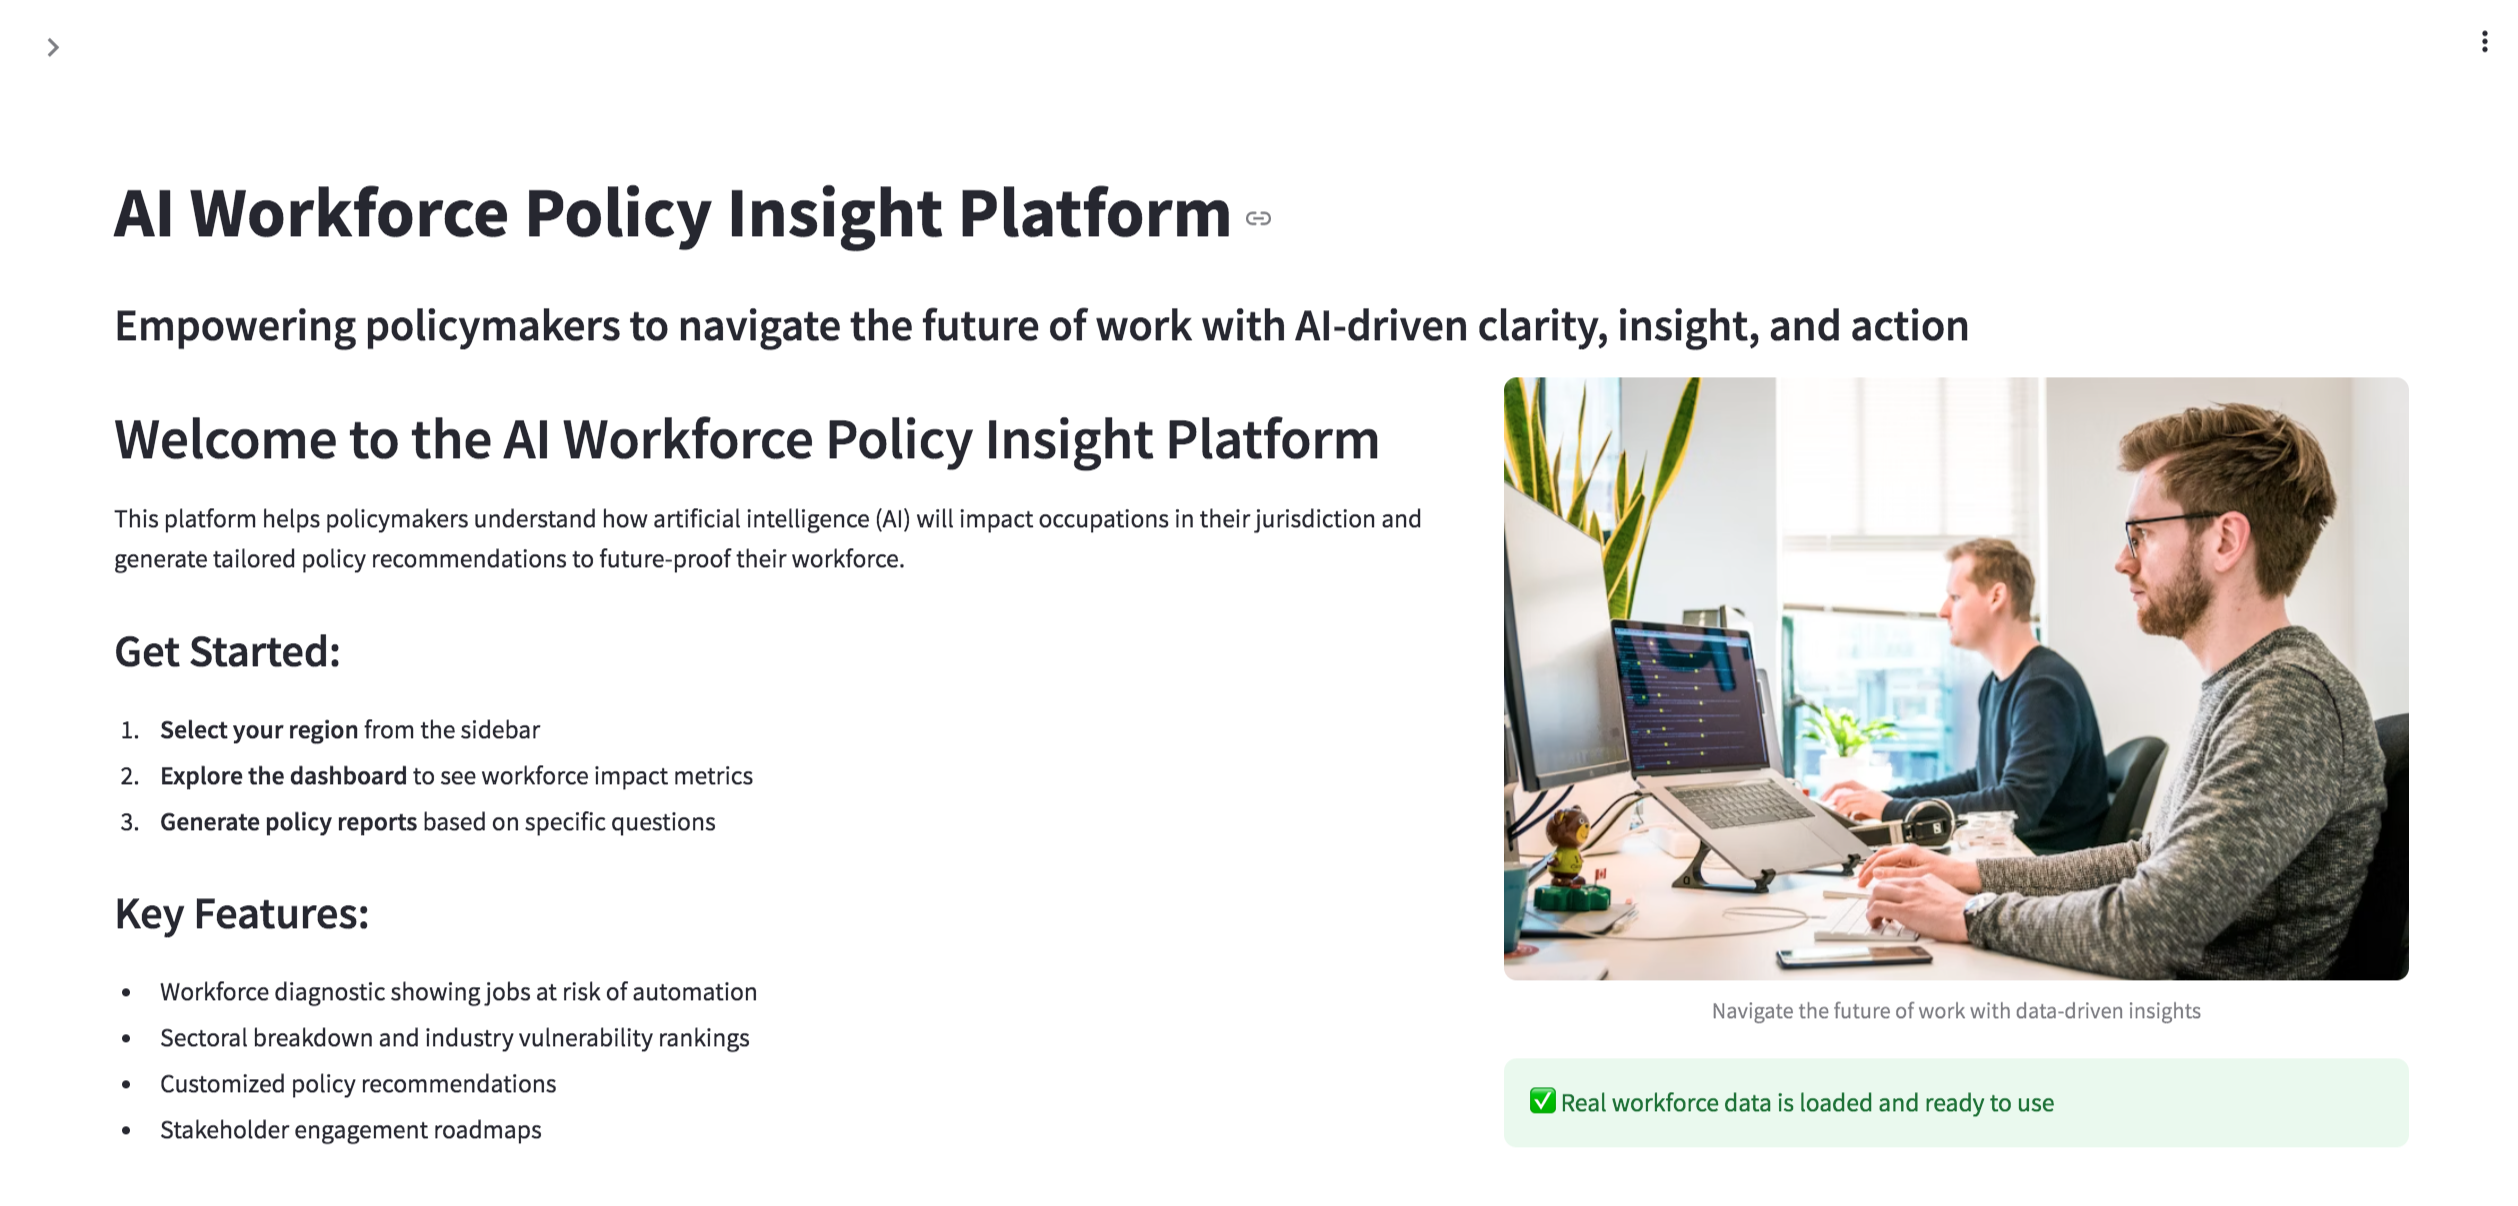
Landing page
-
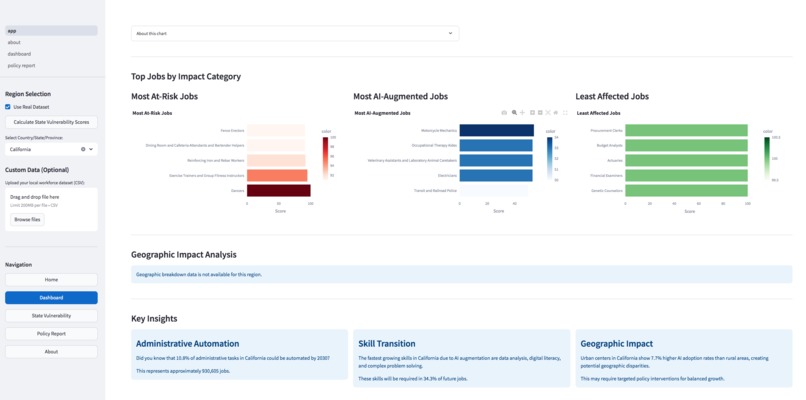
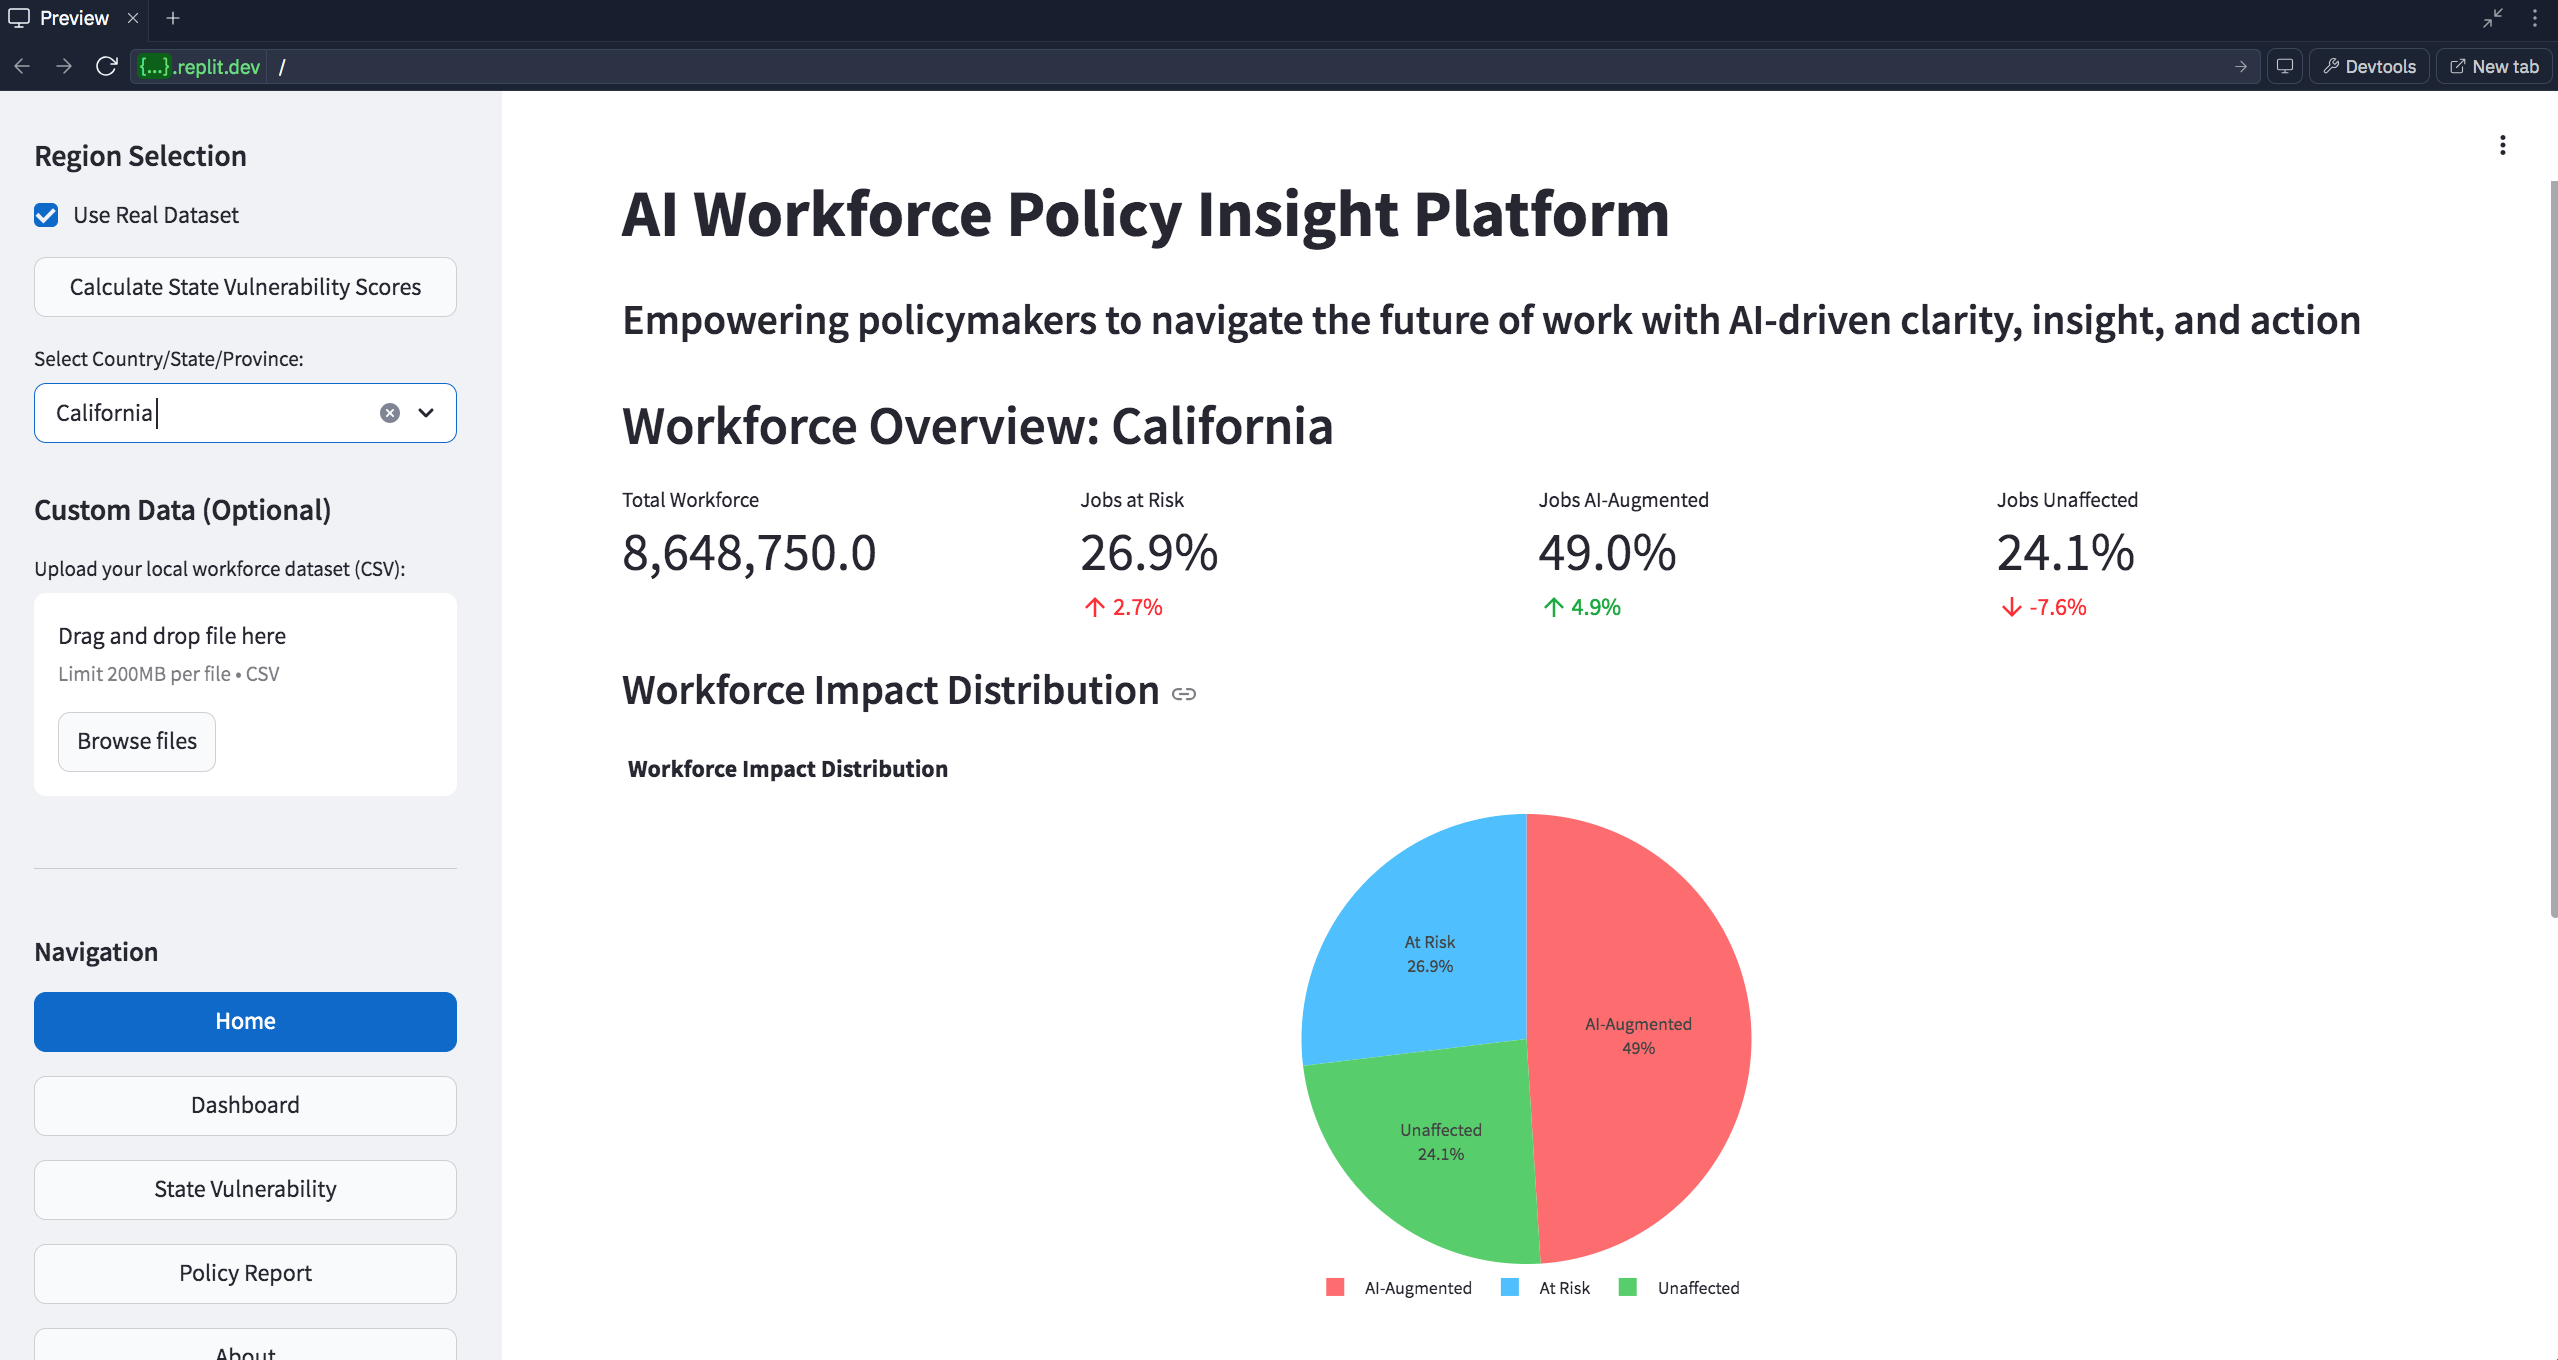
State-level dashboard
-

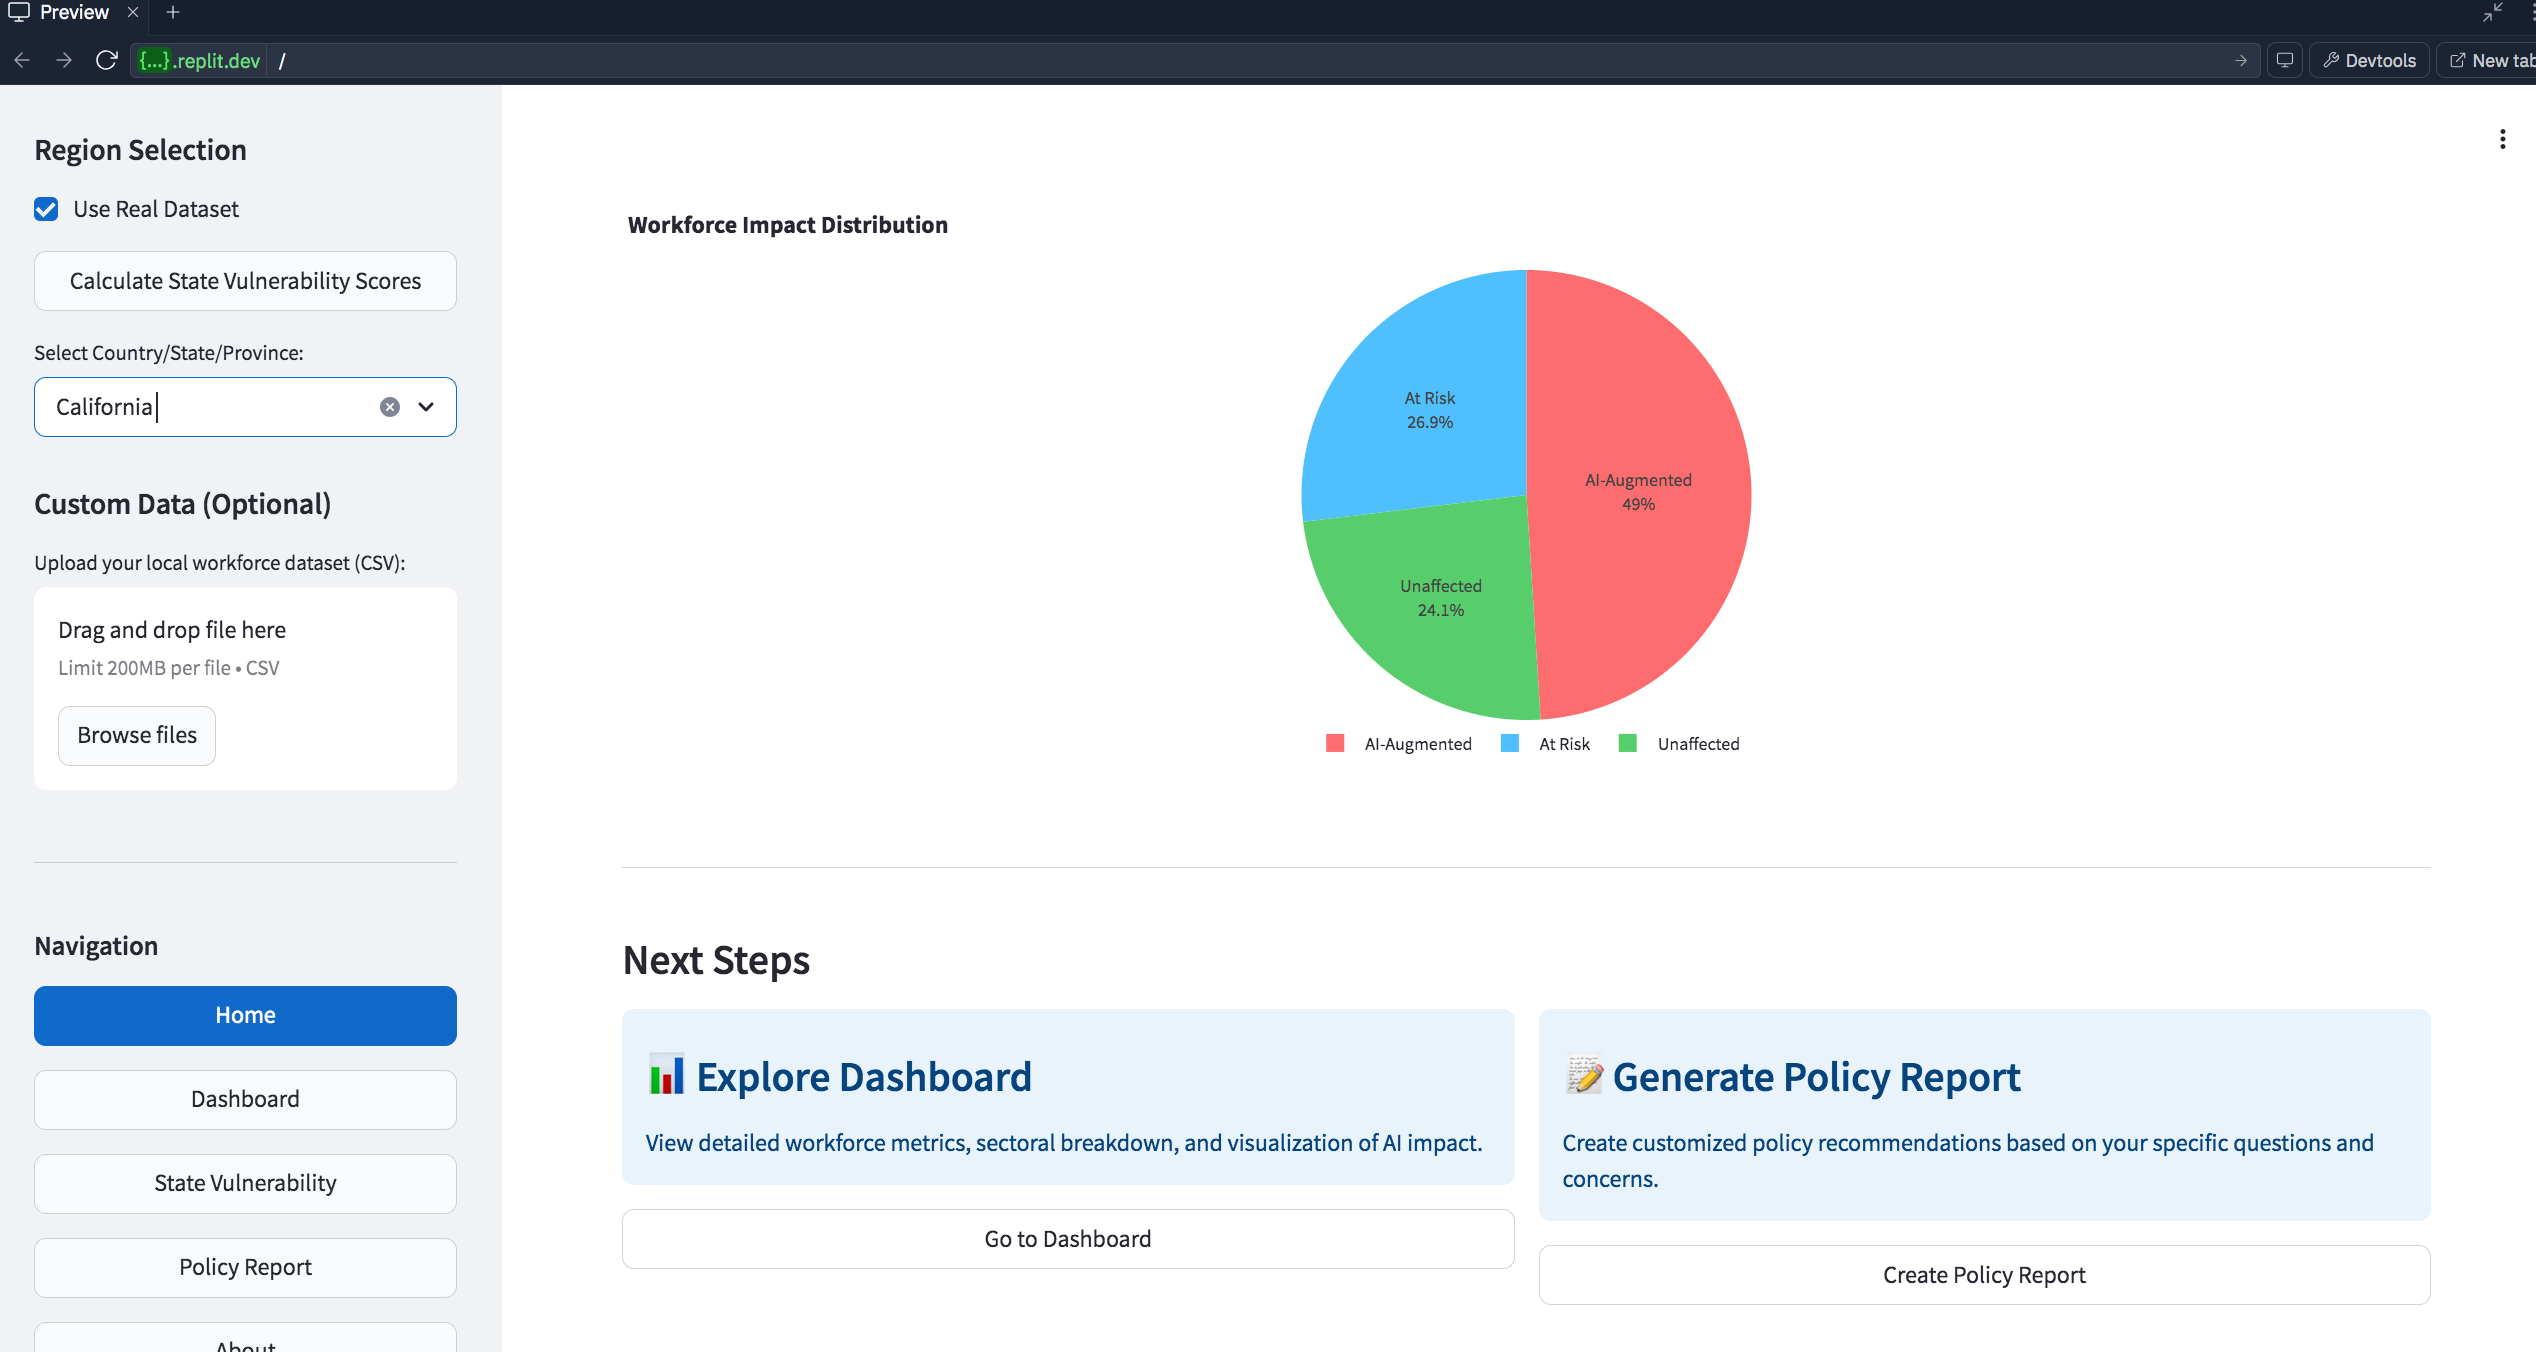
State-level dashboard
-
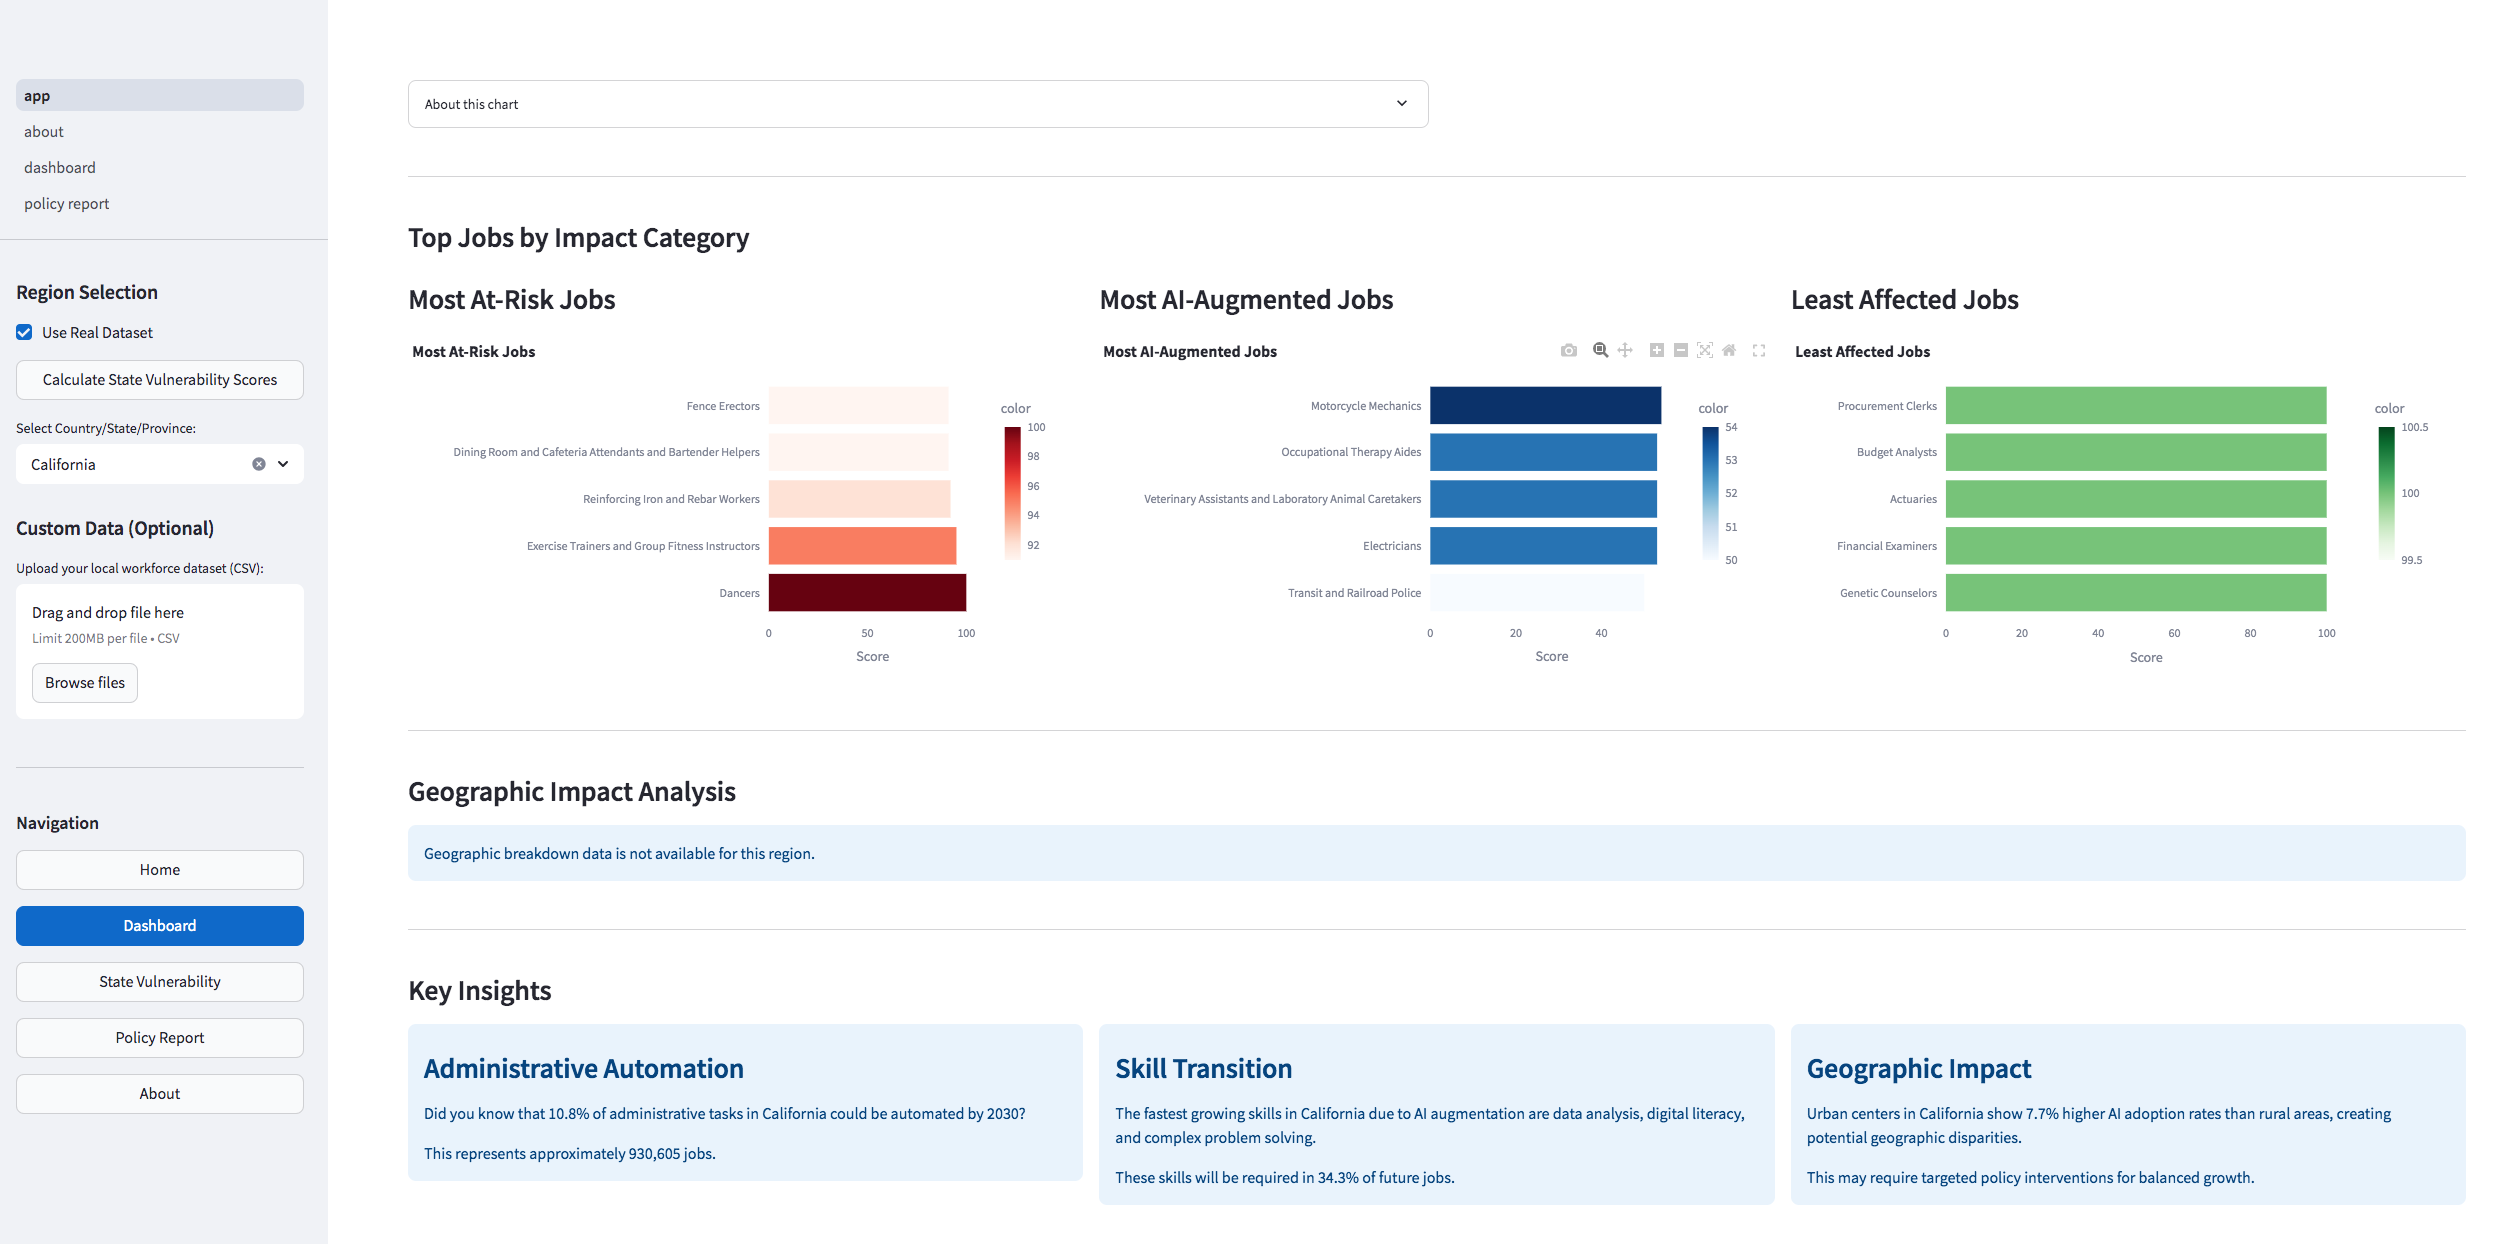
State-level dashboard
-
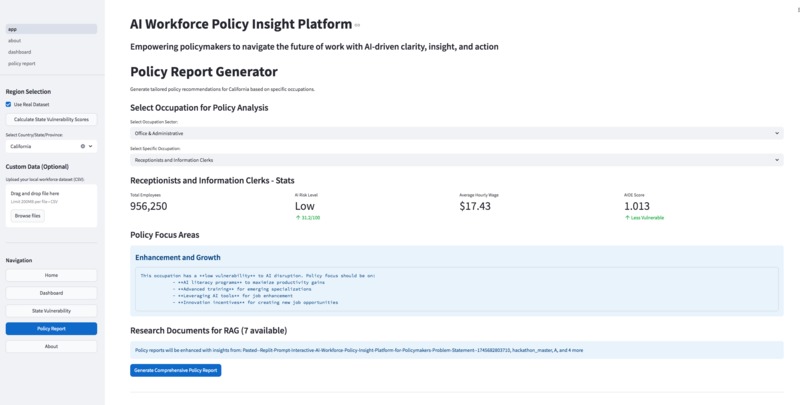
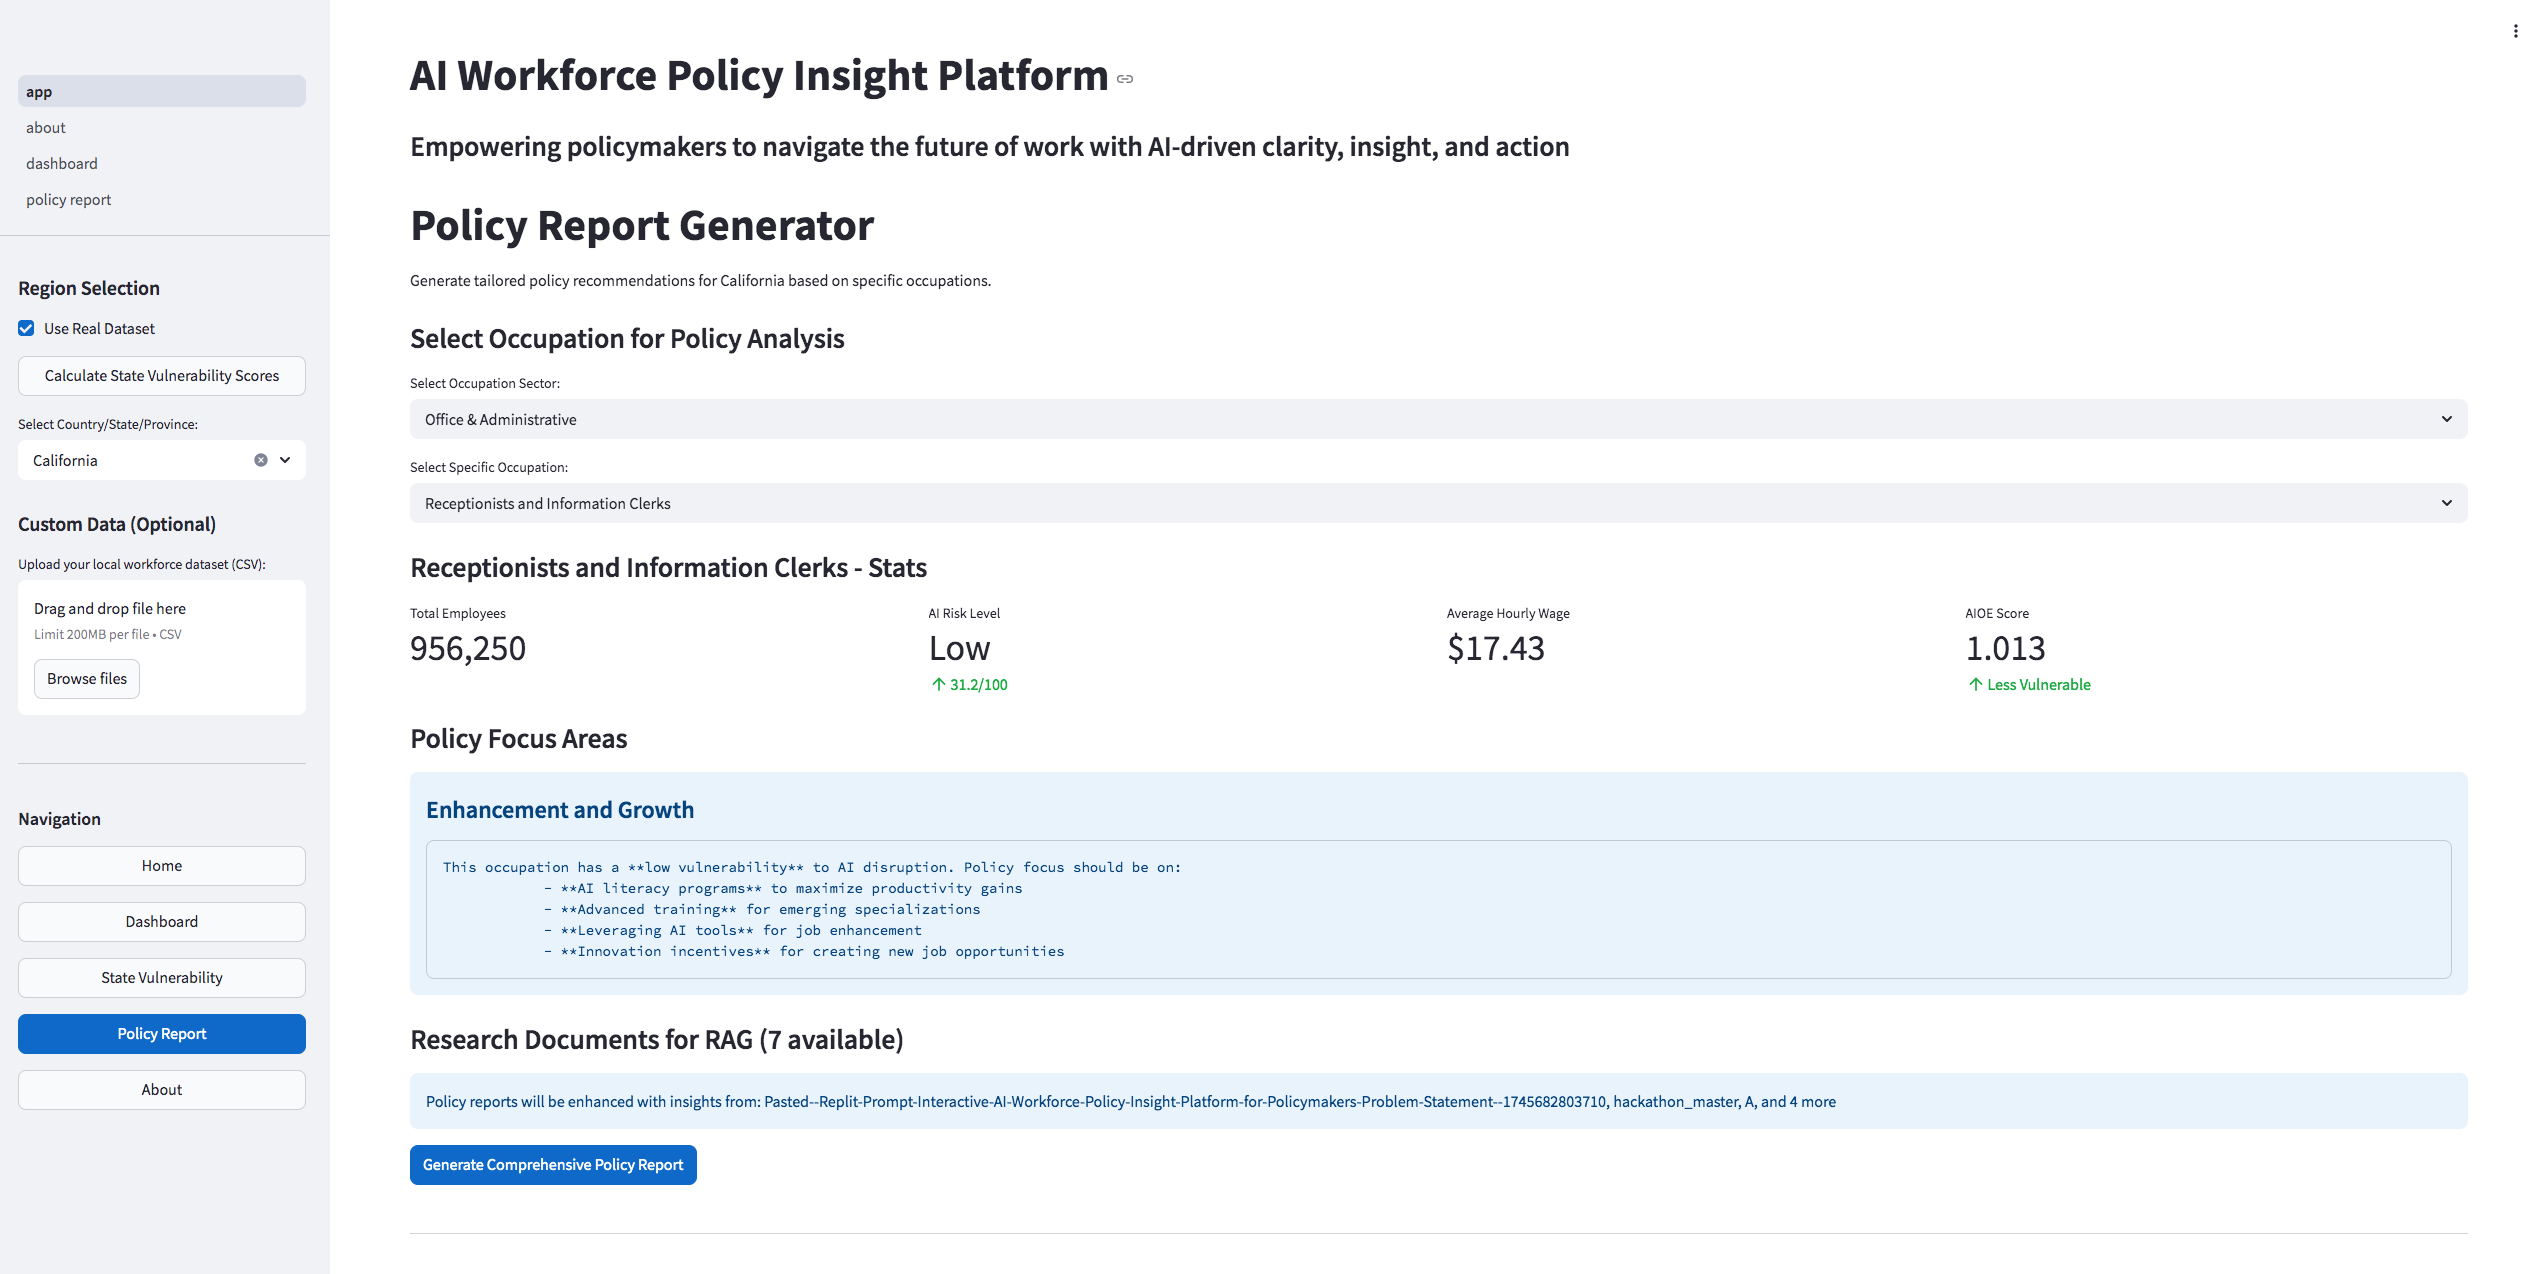
Policy report generator
-
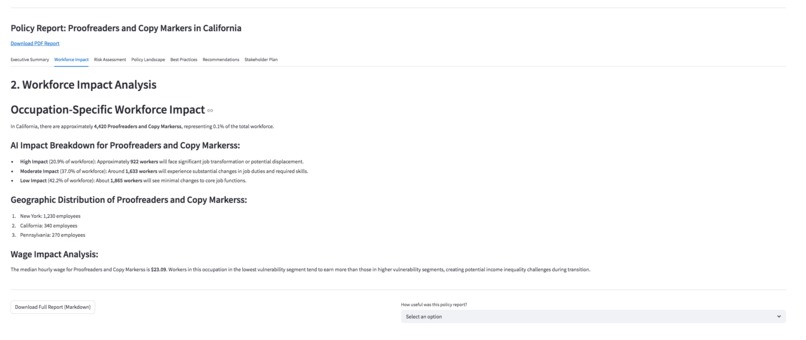
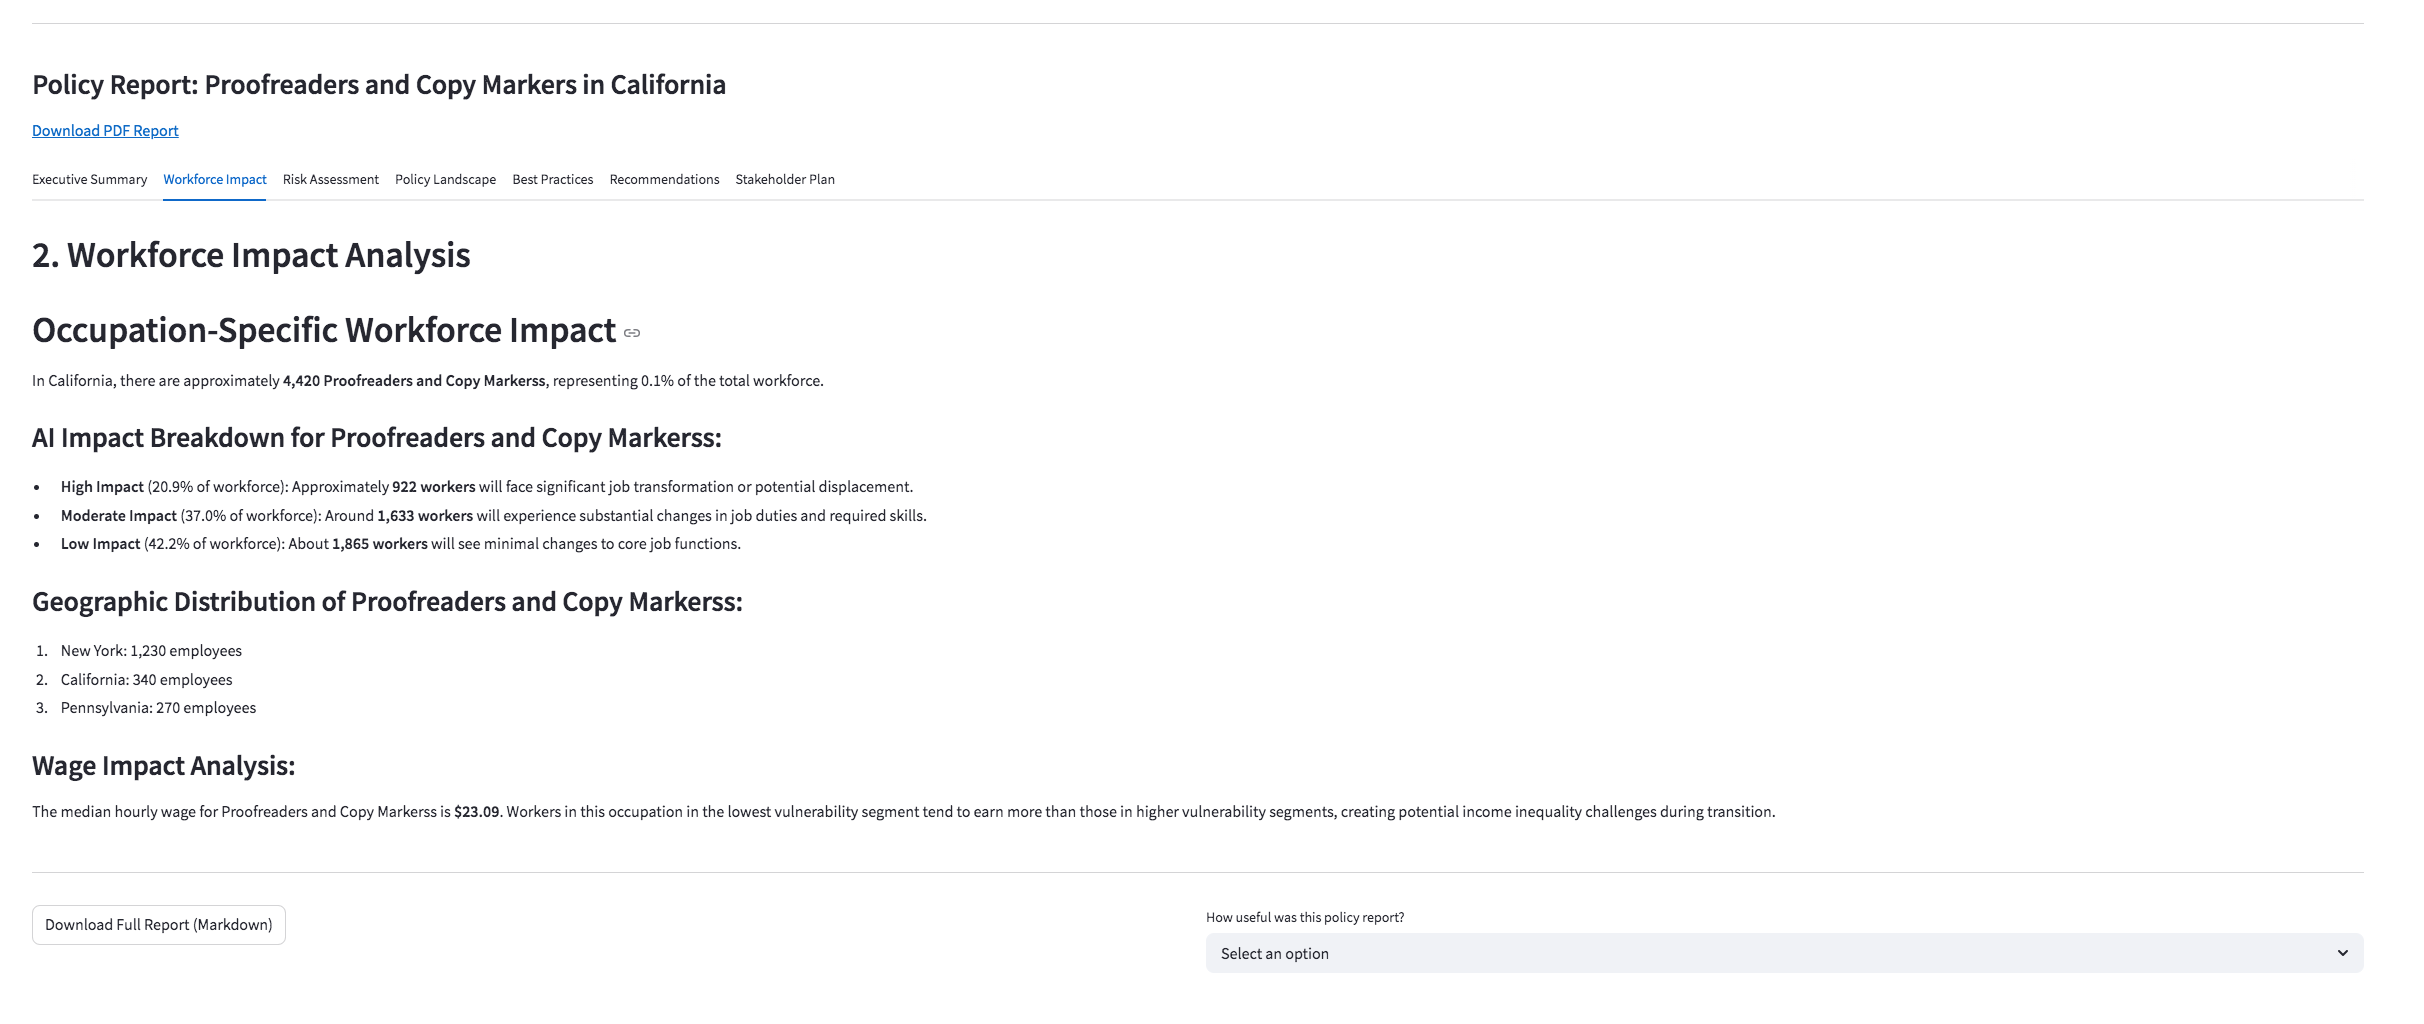
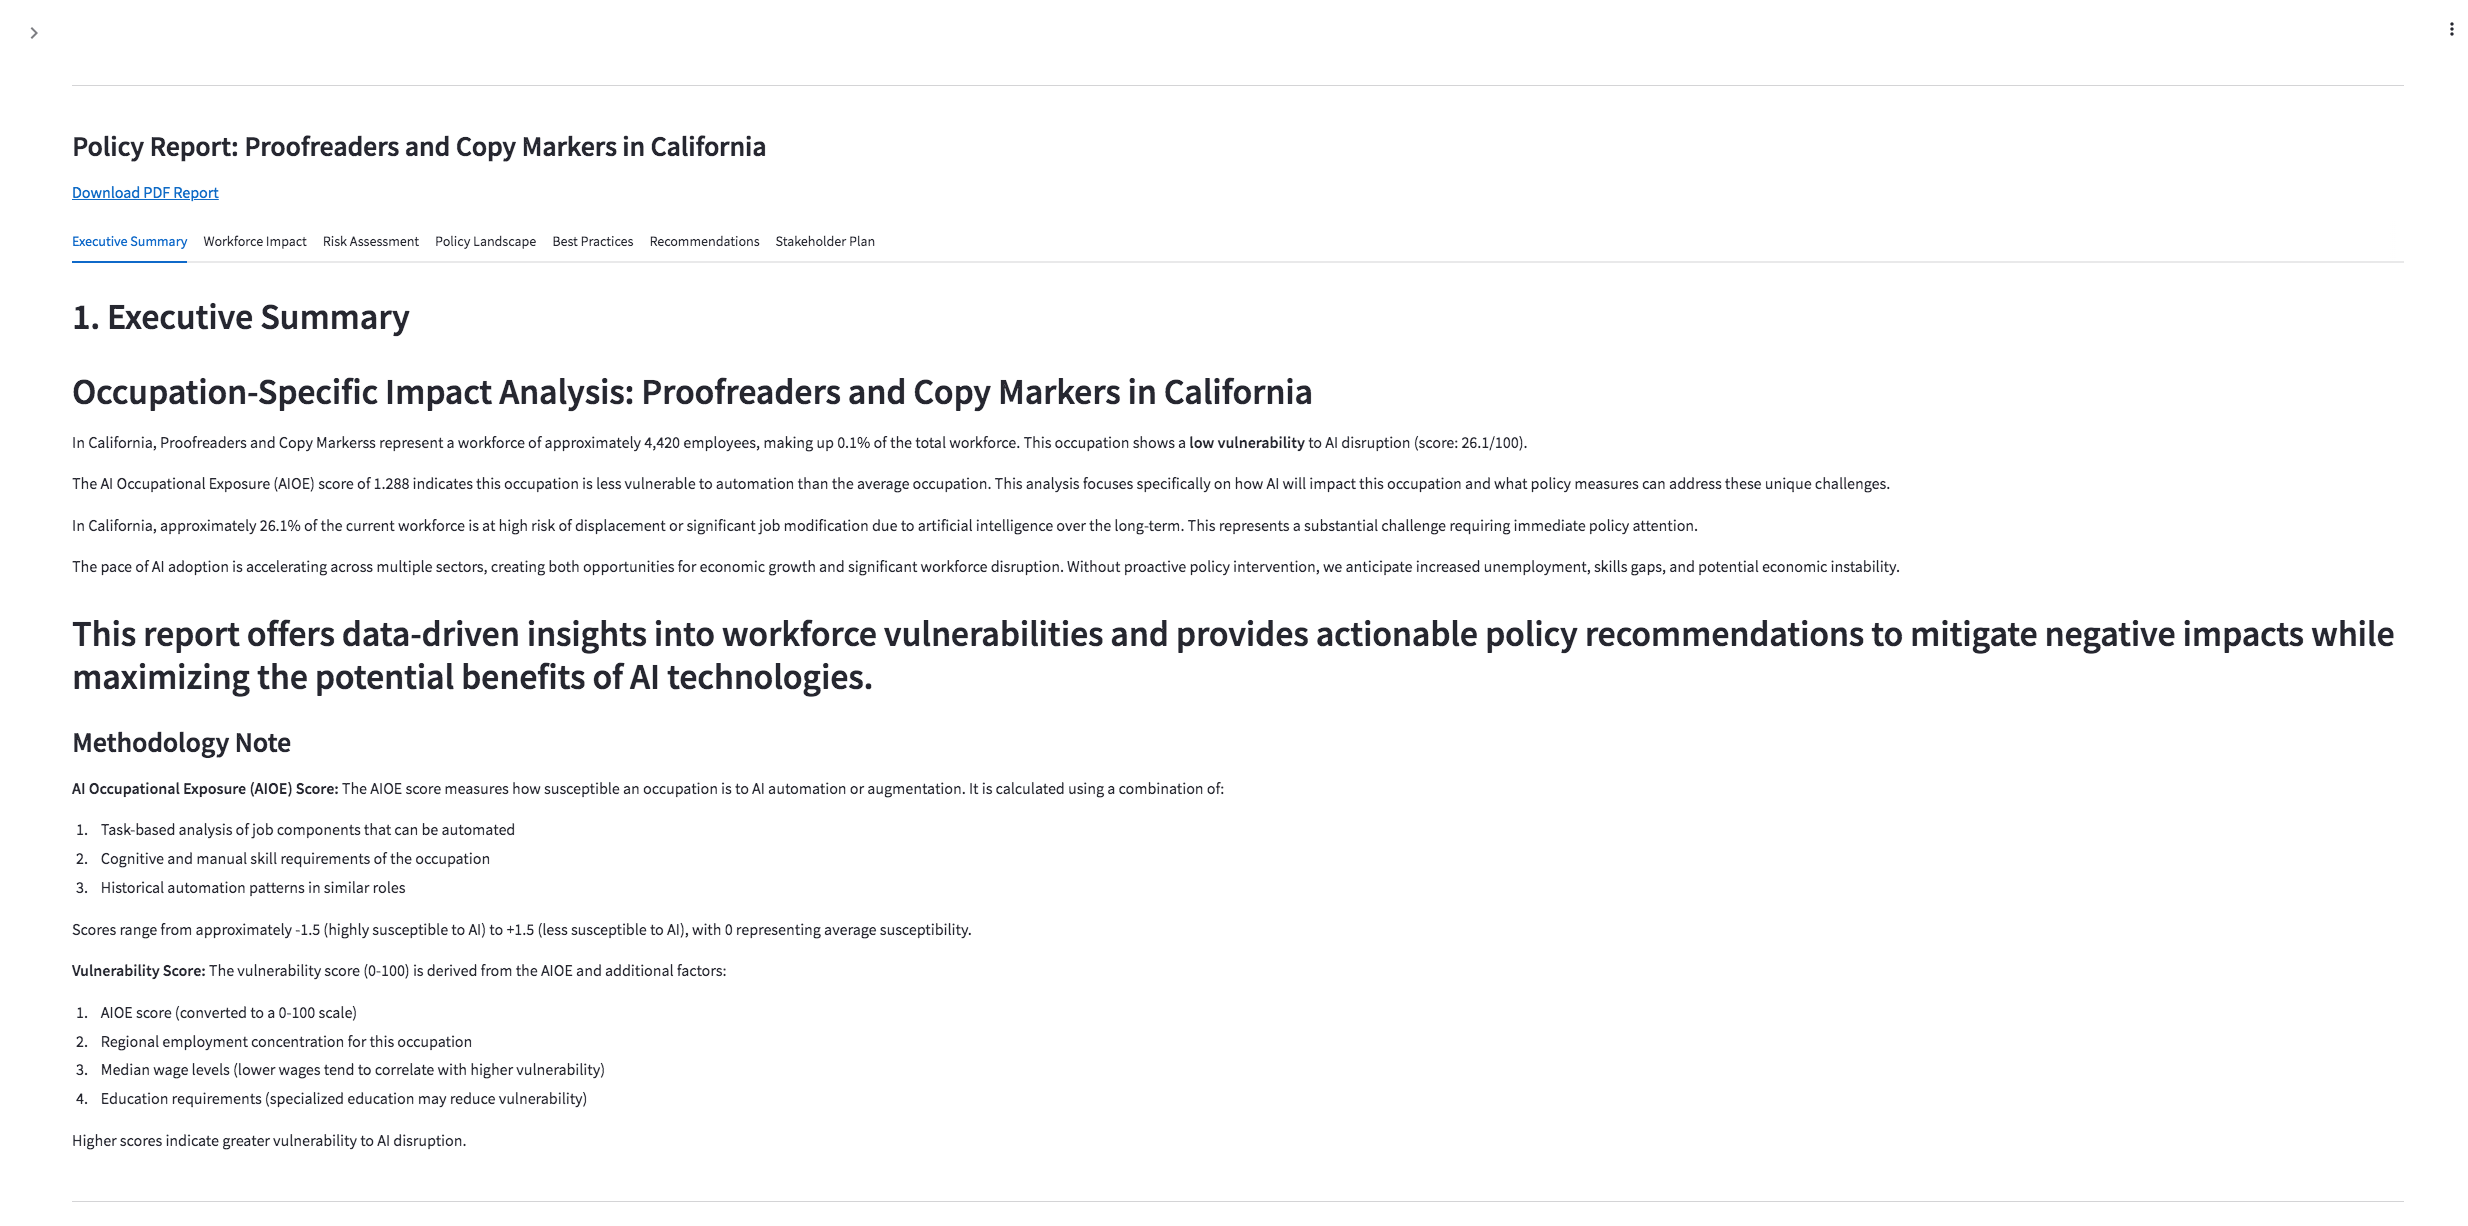
Sample policy report output
-

Sample policy report output
Inspiration
The rise of artificial intelligence has fundamentally shifted the nature of work, leaving policymakers with urgent questions and few clear answers. Traditional labor market analysis tools are no longer sufficient to keep pace with AI’s rapid disruption. We were inspired to build a platform that not only diagnoses where AI-related risks exist in the workforce but also translates data into action — empowering policymakers to future-proof their communities through informed, strategic decisions.
Our goal: "Turning uncertainty into strategy — an AI platform helping leaders navigate the future of work with clarity, insight, and action."
What it does
Workforce Analytics for a Future with AI is a policymaker-focused platform designed to:
- Diagnose AI exposure at the sector and occupation level.
- Prioritize high-risk populations based on economic and social importance.
- Recommend research-backed, actionable policy solutions tailored to local contexts.
User Journey:
- Policymakers select their jurisdiction (e.g., U.S. state, region, or country).
- View an intuitive dashboard showing: a. Workforce size and structure b. % of jobs at risk (automation, augmentation, unaffected) c. Sectoral breakdowns and future 5–10 year trends d. Top 5 occupations most at risk, most augmented, least affected
- Use a report generator to request tailored AI Workforce Risk Diagnostic Reports, containing: a. Executive summary b. Workforce impact analysis c. Job displacement statistics d. Current regulatory gaps e. Global best practices and comparative insights f. AI-generated policy recommendations (e.g., regulation, grants, reskilling programs, safety nets) g. Roadmap for action h. Stakeholder engagement plans with influence/support mapping
Value Proposition: "From data to direction: guiding policymakers through AI’s workforce revolution."
How we built it
- Data Aggregation: We integrated national and state-level labor force data, AI exposure indices (based on task automation risk models), and projections from economic forecasts.
- Dashboard Interface: Built a user-friendly frontend with customizable filters, overview cards, and dynamic state-by-state views using Replit
- Natural Language Report Generator: Developed a large language model layer that interprets workforce data and composes customized policy reports based on user prompts using Replit
Built With
- lovable
- replit

Log in or sign up for Devpost to join the conversation.