-
-
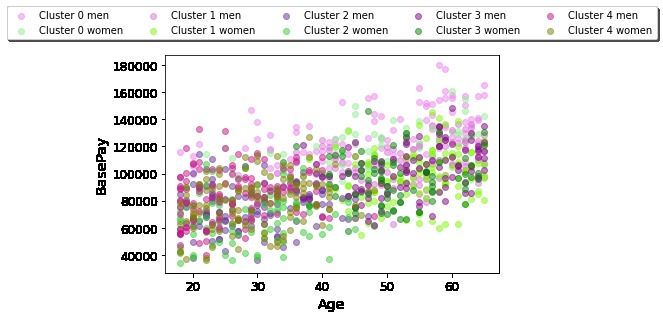
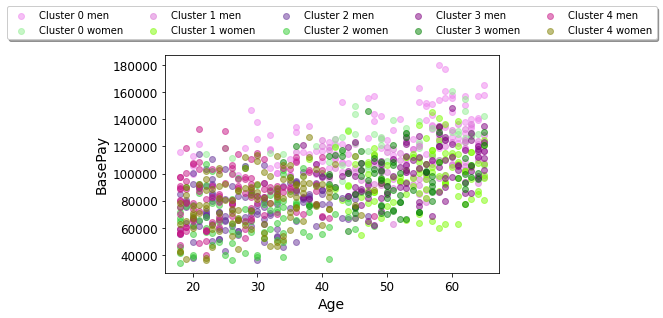
Age vs. Base Pay for the whole data set, symbolized by gender
-
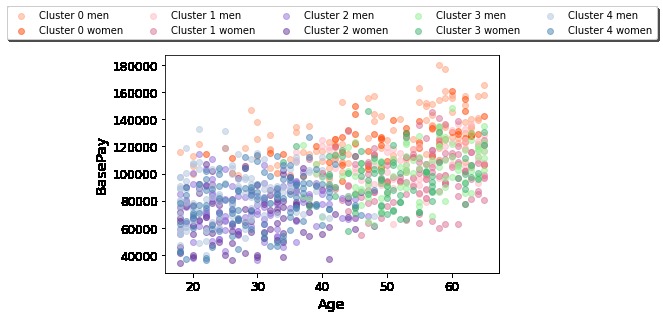
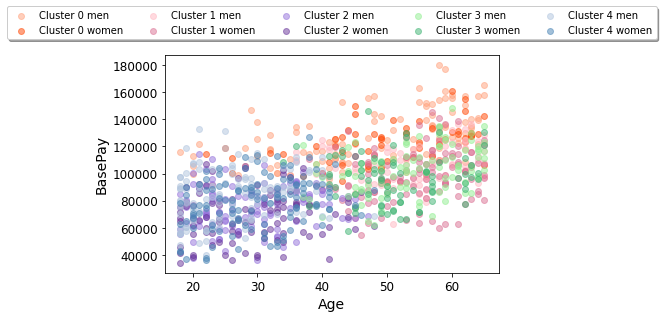
Age vs. Base Pay for the whole data set, symbolized by employee cluster
-
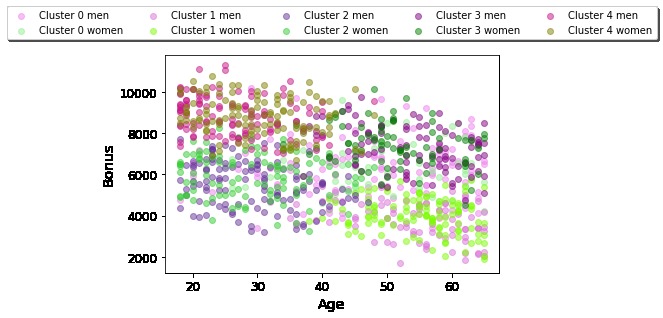
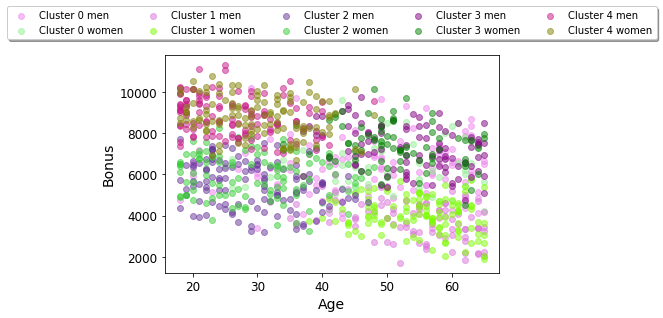
Age vs. Bonus for the whole data set, symbolized by gender
-
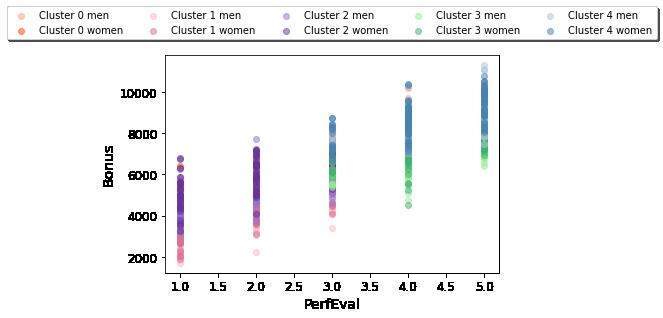
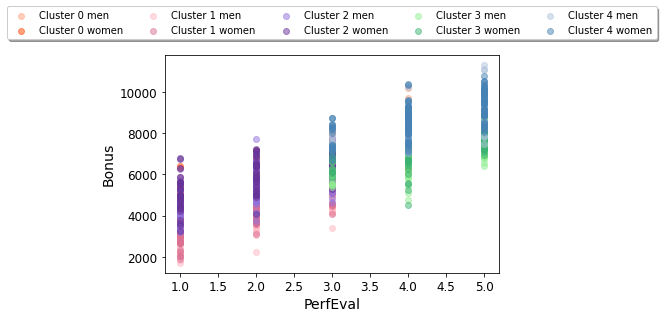
Performance Evaluation vs. Bonus, symbolized by cluster
-
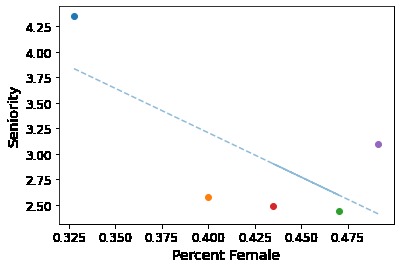
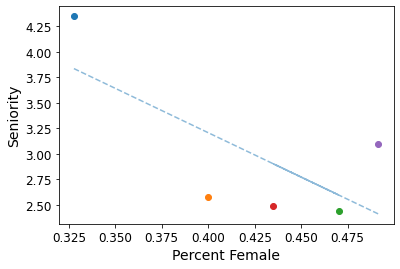
Percent Female vs. Seniority per Cluster
-
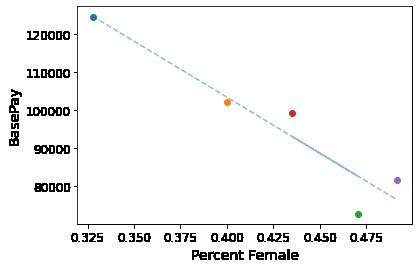
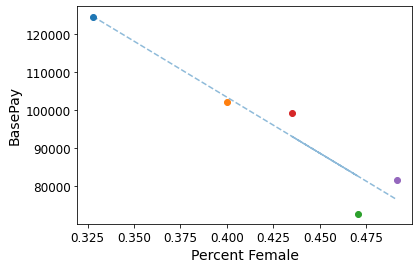
Percent Female vs. Mean Base Pay per Cluster
-
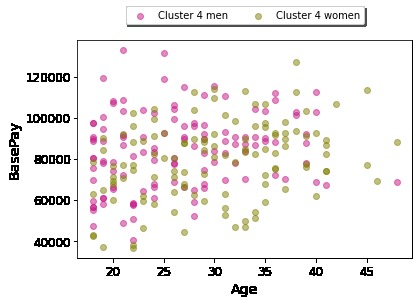
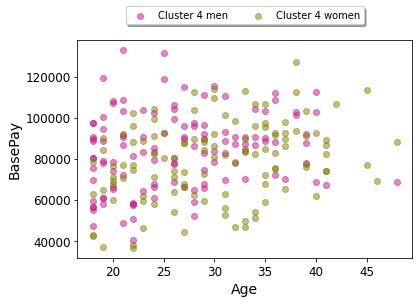
Age vs. Base Pay for Cluster 4 (e.g. of an Individual Cluster Visualization)
-
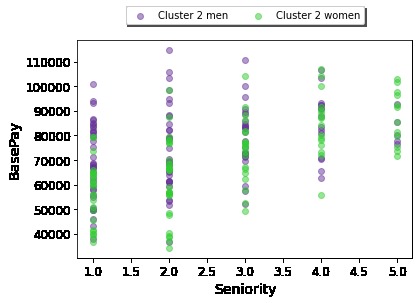
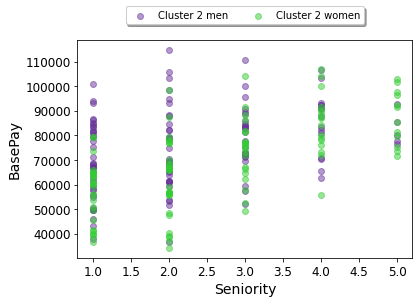
Seniority vs. Base Pay for Cluster 2 (e.g. of an Individual Cluster Visualization)
The Problem
In 2020, women earned $0.82 for every dollar earned by men, according to the Bureau of Labor Statistics. The gender pay gap is not a novel idea in society, but recent statistics such as this show that the problem has yet to be resolved.
Employers may wonder "How can I be sure that I'm not contributing to this phenomenon?" Meanwhile, female and non-binary professionals may wonder how they can be sure that their employer has made meaningful efforts toward empowering them in the workplace.
The problem is, unconscious bias is hard to spot, and thus hard to mitigate. In fact, its very definition is “unintentional and automatic mental associations based on gender, stemming from traditions, norms, values, culture and/or experience.” Unintentional mental associations based on gender may contribute to the disparities in experience between women, men, and other gender identities in the workplace.
The Idea
Employers need a quantitative tool to help them verify that they haven’t been treating their female and male employees differently. That’s where our EmployeeEmpower tool comes in. Using a machine learning clustering model on employee information, our tool groups people into clusters of similar employees. By visualizing the mean features for each cluster, as well as the percent gender makeup of the clusters, we can see groups of employees that are treated similarly by their employer (for example, we may see one cluster of lower paid employees who happen to have less experience than other employees, which would not indicate gender bias, but we may also see a lower paid cluster with similar experience to other clusters but with a higher percentage of women, indicating gender bias). In this way, employers can identify pools of their employees and spot potential unconscious bias.
Our Core Concept:
What if we could help employees quantify and understand gender disparities affecting career progression in the workplace? Then employees could advocate for themselves and others for fair and equal opportunities relating to their careers at a company.
What if employers want to visualize the career progression of their employees? Then employers can upload their own company statistics to the model and be made aware of gender disparities that exist.
What it does
Our project takes in data relating to gender disparities in the workplace. We organized this data into a model that creates clusters of employees with a similar background based on variables like job position, age, pay, etc. We then visualized the data to look at each cluster of employees to see any differences between men and women for each variable tested.
How we built it
Employee Empower was built in Python on Google Colaboratory Notebooks. The dataset was acquired from Kaggle’s open datasets; specifically, we used a dataset from Glassdoor. We utilized Pandas and NumPy for their data-processing capabilities and Sci-Kit Learn, a machine-learning library, to create our model. Visualizations were made possible through the use of Matplotlib.
Challenges we ran into
When we first conceptualized this project, we researched possible datasets about diversity and women's inclusion in the workplace. We were surprised and disappointed to find that extensive data about this issue was not available. We could find small datasets with a few features like equality indices, but not a comprehensive source. After researching for some time, we came across a dataset on Kaggle from Glassdoor that had information and features about the gender pay gap. Through continued research and perseverance, we discovered a starting point for our project. The next issue we ran into pertained to the model selection process. We attempted to use a Random Forest Classifier to predict employee performance evaluations. Unfortunately, this model did not give greater insights as to what features were the strongest predictors. We discussed this issue with the model and decided to go in another direction; classifying groups of similar employees. We agreed to use the K-means algorithm since we wanted to visualize the data and see any trends or gender inequalities among the features.
Accomplishments that we're proud of
We're proud of the technical capacity we've accomplished in this project given our past experience. Additionally, we're proud of how we have successfully completed an entire end-to-end machine-learning project in the span of 48 hours. Furthermore, it was exciting visualizing different trends and patterns within our data, especially differences in male and female career progression across different sectors. This problem means a lot to us, since we're all women in computer science.
What we learned
We're third and fourth-year CS majors in the Engineering School at UVA who are currently enrolled in the machine learning class here. We learned about the K-means algorithm less than a month ago, and it was exciting applying the algorithm outside of our classwork. We learned that K-means is a better algorithm for data visualization than Random Forest Classifier (which tries to predict a model rather than reveal data patterns and insights). Additionally, we learned how difficult it is to find datasets in the real world with a high number of features and entries.
What's next for EmployeeEmpower
The next step for EmployeeEmpower would be to create a user-friendly GUI that could be used by employees and employers to easily visualize disparities in their workplace. This GUI could be in the form of a website since this medium would be highly accessible. We could add a feature for employers to add their own company statistics to the website. The model could then create personalized results for each company using the site. Additionally, employers could choose which visualization method to use and which features to plot.
Our current project doesn't encompass non-binary gender identities due to limitations put upon us by the dataset. We intend to train our model on different datasets in the future that hopefully have more diverse and accommodating features.
Built With
- google-colab
- kaggle
- matplotlib
- numpy
- pandas
- python
- scikit-learn


Log in or sign up for Devpost to join the conversation.