Woodpecker AI - Finds Hidden Hotspots in Power Lines
🪶 Inspiration
Power line failures cost utilities billions of dollars annually and cause widespread outages affecting millions. The 2021 Texas power crisis alone resulted in $195 billion in damages. The core problem? **Most electrical defects are invisible to the naked eye until it's too late.
Traditional power line inspections are slow, expensive, and only cover 1-2% of infrastructure annually. By the time a technician visually spots a problem, the equipment is often already failing. We needed a solution that could find problems before they become disasters.
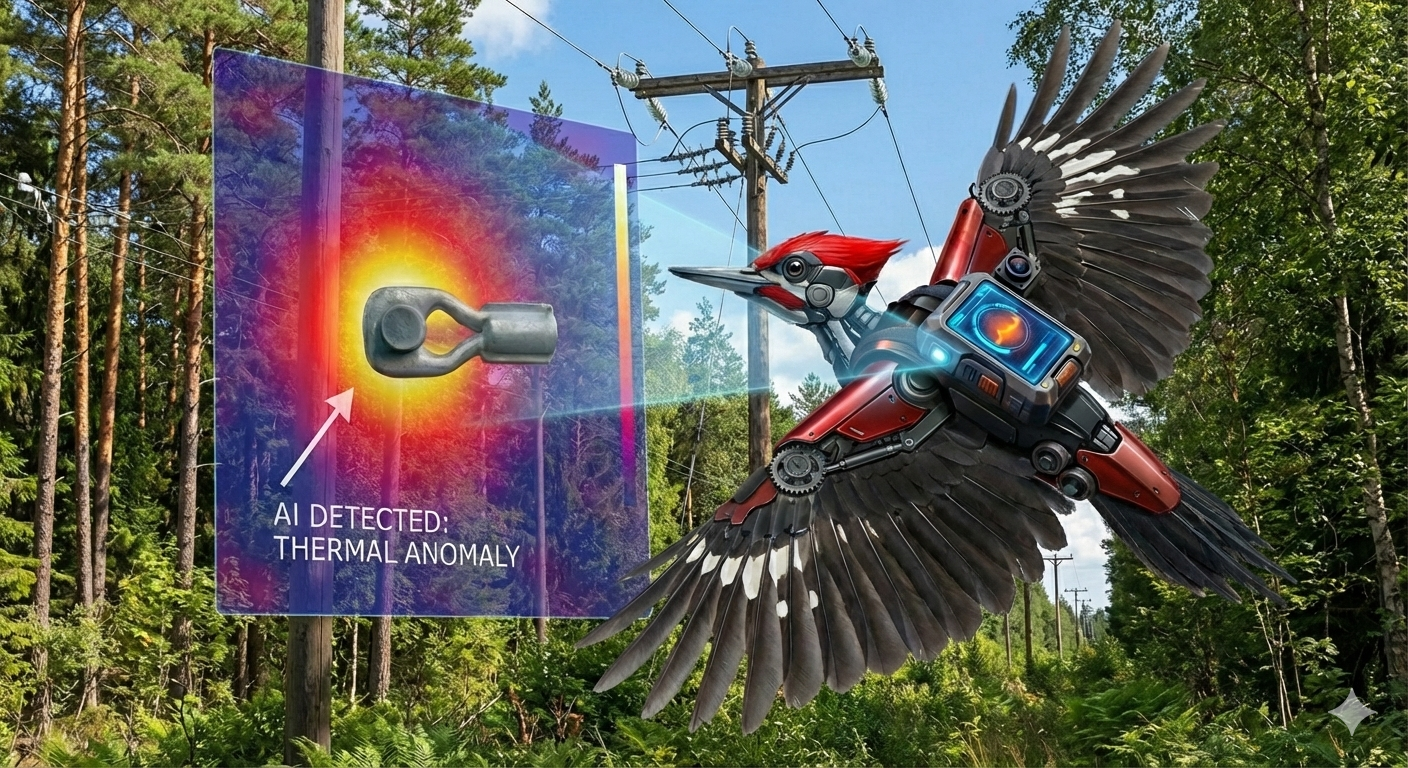
That's when it hit us: just like a woodpecker finds hidden insects inside trees by detecting subtle anomalies, AI can find hidden hotspots in power lines by analyzing thermal patterns invisible to humans.
Thus, Woodpecker AI was born—a real-time system that turns every drone flight into an intelligent inspection, catching critical issues before they cause million-dollar outages.
⚡ What it does
Woodpecker AI is a real-time drone-based power line inspection system powered by streaming data and multimodal AI.
Here's how it works:
Drones fly along power lines, capturing thermal images and telemetry data (GPS, temperature readings)
Data streams in real-time through Confluent Kafka at realtime—no batch processing delays
Google's Gemini 2.5 Flash analyzes every image as it arrives, looking for visual thermal anomalies that temperature sensors alone would miss
Hotspots are detected instantly and displayed on a live dashboard with risk scores, GPS coordinates, and AI-generated explanations
Field crews get immediate alerts about which locations need urgent attention—preventing failures before they happen
The entire pipeline—from drone to decision—takes under 5 seconds per image. In a 34-second flight, Woodpecker AI can inspect 34 locations and identify critical issues in real-time.
Key Features:
- 🚁 Real-time drone telemetry streaming via Confluent Kafka
- 🔥 Multimodal AI hotspot detection using Google Gemini
- 📊 Live dashboard with animated drone tracking and interactive map
- 🔍 Complete event lineage—trace any detection back through the data pipeline
- ⚡ Parallel processing—AI analyzes images while the drone is still flying
🛠️ How we built it
Architecture:
We built Woodpecker AI as a cloud-native streaming application with three main components:
1. Data Ingestion Layer
- Drone Simulator (Python): Generates realistic telemetry events (GPS coordinates, temperature readings, thermal images)
- Google Cloud Storage: Hosts 34 actual thermal images of power line infrastructure
- Confluent Kafka: Ingests streaming data into
gridpulse.framestopic at 1 event/second
2. AI Processing Layer
- AI Consumer (Python + Kafka): Subscribes to raw events in real-time
- Google Gemini 2.5 Flash: Multimodal AI model that analyzes thermal images
- Downloads each image from GCS, generates signed URLs, and sends to Gemini API
- Gemini returns structured JSON with hotspot classification, risk score (0-100), visual reasoning, and recommended action
- Results are published to
gridpulse.anomaliestopic (only actual hotspots—no noise)
3. Visualization Layer
- Backend API (FastAPI): Dual Kafka consumer that reads both
frames(drone movement) andanomalies(AI results) - WebSocket Server: Streams real-time updates to frontend
- Frontend Dashboard (Vue.js + Leaflet.js): Interactive map with animated drone, pin drops, event cards, and statistics
- Historical event loading for browser refresh persistence
Technology Stack:
- Streaming: Confluent Kafka Cloud (real-time data ingestion)
- Stream Processing: Apache Flink SQL (enrichment pipeline)
- AI/ML: Google Gemini 2.5 Flash (multimodal hotspot detection)
- Storage: Google Cloud Storage (thermal images)
- Backend: Python, FastAPI, WebSockets
- Frontend: Vue.js, Leaflet.js, HTML5/CSS3
- Infrastructure: Google Cloud Platform
Data Flow:
Drone → Kafka (frames) → AI Consumer → Gemini AI → Kafka (anomalies) → Dashboard
                    ↓
                Dashboard (drone movement)
Key Design Decisions:
- Dual topic strategy:
framesfor all events (drone movement),anomaliesfor AI results only—keeps signal-to-noise ratio high - 1-hour retention: Balances demo freshness with data persistence (cleanup script temporarily sets 5-second retention to purge old data, then restores 1-hour for viewing)
- Signed URLs: Secure, temporary access to GCS images without making bucket public
- 1-to-1 image mapping: Each of 34 events maps to exactly one thermal image (wpi_1.png → wpi_34.png) for predictable demos
💪 Challenges we ran into
1. Apache Flink ML_PREDICT Function Issues
Problem: We initially tried to use Flink's native ML_PREDICT function to call Gemini directly from Flink SQL. Despite creating connections, registering models, and trying multiple approaches, we hit errors - internal error occurred.
Solution: After spending significant time debugging, we pivoted to a Python-based AI consumer approach. This gave us more control over the Gemini API calls, better error handling, and easier debugging. Sometimes the simpler solution is the right one!
5. Dashboard Not Showing Events After Browser Refresh
Problem: WebSocket streams new events, but refreshing the browser lost all historical data.
Solution: Added historical event storage in backend memory (last 100 events/anomalies) and a new /api/events endpoint. On page load, frontend fetches history, restores drone position, rebuilds trail, and repopulates AI detections panel—then connects WebSocket for new events.
🎉 Accomplishments that we're proud of
1. End-to-End Real-Time Streaming Pipeline
We built a production-grade streaming architecture that processes data in under 5 seconds from drone to dashboard. The feeling of watching the drone fly, seeing Gemini analyze images in the background, and having hotspots appear in real-time is incredibly satisfying.
2. Multimodal AI Integration
Successfully integrated Google Gemini 2.5 Flash for visual thermal analysis. The AI doesn't just look at numbers—it sees bright spots, heat distributions, and visual anomalies that temperature sensors alone would miss. This is true multimodal intelligence.
3. Production-Ready UI/UX
Built a beautiful, interactive dashboard with animated drone movement, pin drop animations, real-time statistics, and event tracing. It's not just functional—it's engaging and demo-ready.
4. Resilient Error Handling
After multiple architecture pivots, we have robust error handling: fresh signed URLs for each image, retry logic, graceful degradation, and comprehensive logging. The system handles Gemini API timeouts, GCS failures, and Kafka connection issues without crashing.
5. Smart Demo Infrastructure
Created a sophisticated cleanup script that manages Kafka retention dynamically, ensuring fresh demos with 0/0/0 stats while keeping events visible for 1 hour. Also built historical event loading so browser refreshes don't lose data.
6. Complete Observability
Every event has a UUID and is traceable through the entire pipeline. You can click "Trace" on any hotspot and see exactly where it appeared in Kafka topics—complete event lineage from ingestion to detection.
7. Clear Value Proposition
"Woodpecker AI finds hidden hotspots in power lines" is simple, memorable, and immediately communicates what the system does. The metaphor resonates with everyone from engineers to executives.
📚 What we learned
Technical Learnings:
Streaming vs. Batch Processing
- Real-time streaming isn't just faster—it enables fundamentally different workflows
- Seeing data flow instantly changes how users interact with the system
- The psychological impact of "live" data is powerful in demos
When to Use Flink (and When Not To)
- Flink is amazing for stateful stream processing and complex transformations
- But for simple AI API calls, a lightweight Python consumer can be simpler and more maintainable
- Don't over-engineer—choose the right tool for each job
Prompt Engineering Matters
- The difference between "use temperature threshold" and "look at visual content" was dramatic
- AI prompts are code—they need iteration, testing, and refinement
- Being specific about what to look for (bright spots, concentrated heat) improved accuracy significantly
Kafka Topic Design
- Having separate topics for raw events (
frames) and AI results (anomalies) kept concerns separated - Topic retention is critical for demos—too short and data disappears, too long and cleanup is slow
- Consumer group management matters for stateful applications
- Having separate topics for raw events (
Real-Time UI Challenges
- WebSockets are great for streaming but require historical data APIs for persistence
- Users expect instant feedback—showing drone movement immediately while AI processes in background is more engaging than waiting
- Animations and visual feedback make streaming data feel alive
Non-Technical Learnings:
Demo Storytelling
- A good metaphor ("woodpecker finding insects") makes complex tech instantly understandable
- Showing parallel processing (drone flying while AI analyzes) is more impressive than hiding the latency
- Letting the audience see the AI's reasoning ("bright thermal signature detected") builds trust
Pivoting is OK
- We spent hours trying to make Flink ML_PREDICT work before pivoting to Python
- The pivot saved time in the long run and gave us more control
- Sometimes the "less elegant" solution is the right one
Production-Ready Details Matter
- Fresh signed URLs, proper error messages, loading states, browser refresh handling
- These aren't "nice to have"—they're what separates a prototype from a product
- Spending time on polish pays off in demo confidence
🚀 What's next for Woodpecker AI - Finds Hidden Hotspots in Power Lines
Short Term (Next 3 Months):
Real Drone Integration
- Replace simulator with actual DJI drone telemetry via MAVLink protocol
- Deploy on field tests with utility partners
- Collect real-world performance data
Enhanced AI Models
- Fine-tune Gemini on power line defect datasets
- Train custom models for specific defect types (corrosion, broken insulators, vegetation encroachment)
- Add multi-model ensemble for higher accuracy
Automated Alerting
- SMS/email notifications for high-risk hotspots
- Integration with work order management systems
- Priority routing based on risk score and location
BigQuery Analytics
- Store all detections in BigQuery for long-term analysis
- Build dashboards for trending, failure prediction, and ROI tracking
- ML models to predict equipment lifespan based on thermal patterns
Medium Term (6-12 Months):
Multi-Drone Orchestration
- Scale to 10+ drones operating simultaneously
- Kafka partition strategy for horizontal scaling
- Distributed Flink jobs for parallel processing
Edge AI Processing
- Deploy lightweight models on drone hardware for instant pre-filtering
- Only stream potential hotspots to cloud for detailed analysis
- Reduce bandwidth costs and improve latency
Augmented Reality (AR) Interface
- Overlay AI detections on live video feed for field technicians
- Show historical hotspot data when inspecting equipment
- Voice-guided navigation to detected issues
Predictive Maintenance
- Track temperature trends over time per asset
- Predict failures 30-60 days in advance
- Prescriptive recommendations ("replace this transformer by Q3")
Long Term (1-2 Years):
Full Grid Digitization
- Create digital twins of entire power grids
- Continuous monitoring of all critical infrastructure
- Real-time grid health dashboards for utility operations centers
Industry Expansion
- Oil & gas pipelines (leak detection via thermal + visual AI)
- Solar farms (panel efficiency monitoring)
- Wind turbines (blade damage detection)
- Railway infrastructure (track and catenary inspection)
Autonomous Inspection
- Drones autonomously plan routes based on risk scores
- Automatically re-inspect high-risk areas more frequently
- Self-optimizing inspection schedules based on historical data
Regulatory Compliance Platform
- Automated compliance reporting for NERC, FERC regulations
- Audit trails with complete inspection history
- Risk assessment reports for insurance and stakeholders
Research Directions:
Federated Learning
- Train models across multiple utility companies without sharing sensitive data
- Build industry-wide defect detection models
- Privacy-preserving collaborative AI
Causal AI
- Move beyond correlation to understand why failures happen
- Root cause analysis for outages
- Counterfactual reasoning ("what if we had inspected this last month?")
Multi-Spectral Analysis
- Combine thermal, visual, UV, and LiDAR data streams
- Fusion models that see what no single sensor can
- Defect detection invisible to any single modality
Business Model:
- SaaS Licensing: Per-drone, per-mile, or per-inspection pricing
- Managed Service: Full inspection-as-a-service for utilities
- Data Marketplace: Anonymized grid health insights for equipment manufacturers
- Insurance Products: Risk-based pricing for utilities using Woodpecker AI
🎯 Vision Statement
We envision a world where power outages are predicted and prevented, not just repaired. Where every power line, transformer, and transmission tower is continuously monitored by intelligent drones. Where AI doesn't just detect problems—it predicts them weeks in advance, allowing utilities to fix issues before customers ever notice.
Woodpecker AI isn't just finding hidden hotspots—we're preventing the next grid failure.
Because in an electrified world, reliable power isn't a luxury. It's a necessity.
📊 Impact Potential
If deployed across the U.S. power grid:
- $10-20B annual savings in prevented outages
- 50M+ hours of customer outage time avoided
- 80% reduction in catastrophic equipment failures
- 3x increase in inspection coverage vs. traditional methods
- 90% reduction in inspection costs per mile
Built With
- apache-kafka
- confluent-cloud
- fastapi
- flink
- gcp
- google-gemini-2.5-flash
- javascript
- kafka
- python
- vue.js


Log in or sign up for Devpost to join the conversation.