-
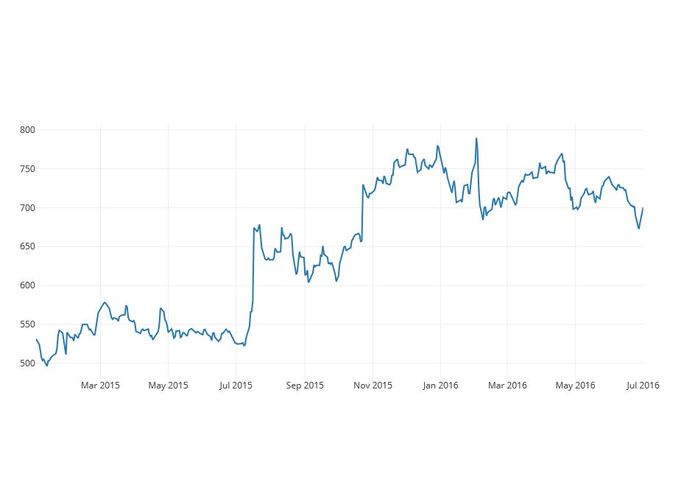
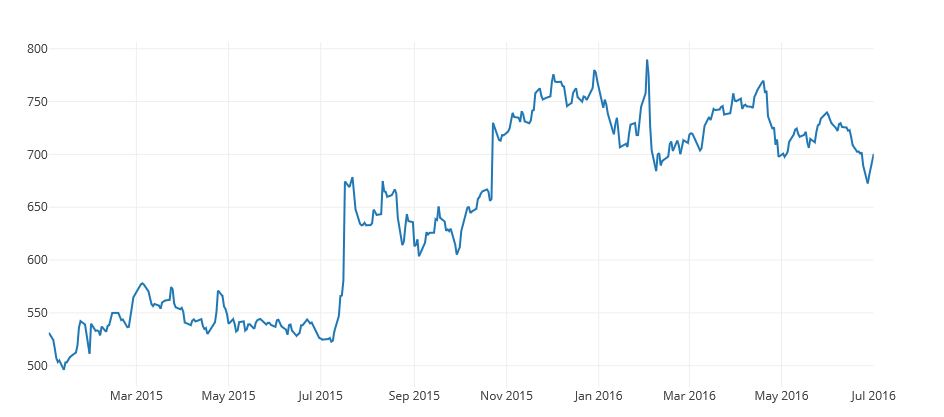
Google Finance stock price data using Plotly
-
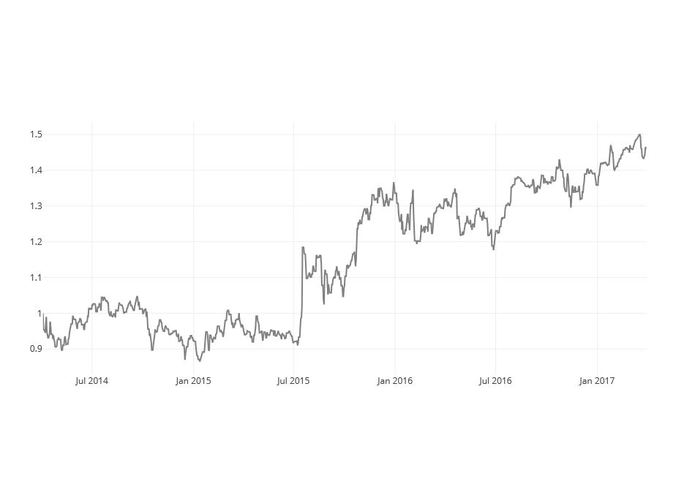
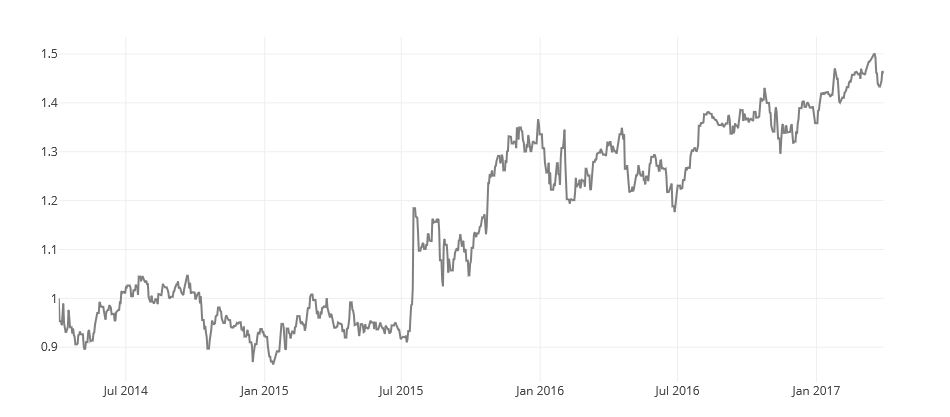
Plottly visualization on python's virtual environment showing Aladdin's volatility data
-
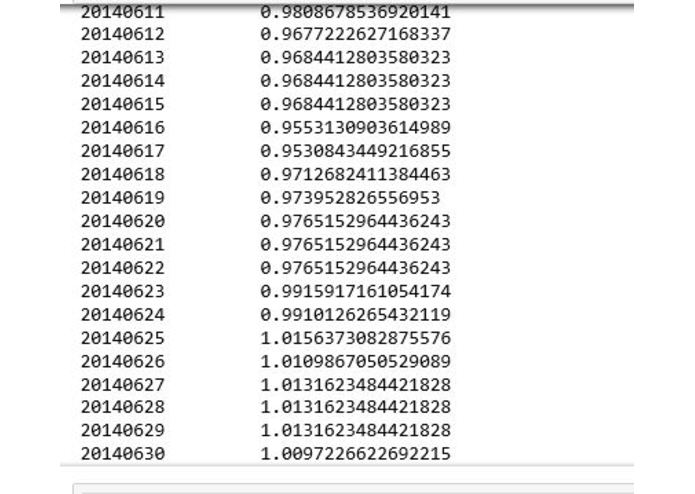
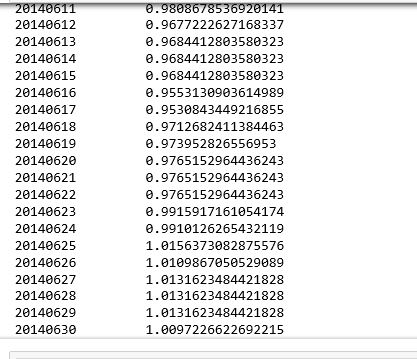
Raw format returned by Aladdin library
Inspiration
Automated trading has been a growing sector since special machine learning algorithms have developed like SVM, Random Forests which have high p-value for predictions and also are really great in identifying and incorporating seasonal and cyclical trends.
This motivated me to leverage advanced plotly visualizations to view time series graphs and make predictions.
What it does
My code uses Blackrock and Google Finance API to collect stock price data of S&P 500 companies by identifying them from Wikipedia.com. I analyze Volatility data and verify the time-series graph with Price data. Finally, I have deployed some machine learning algorithms to predict the stock price data for companies.
How I built it
- I used Anaconda package for coding in Python. Anaconda provides a great interface which compiles into Markdown for ease of access.
- I used Blackrock's Aladdin Performance API to get volatility data and stock price data for more than 10 years.
- using libraries like Matplotlib, Graphlab, Numpy, BeautifulSoup, Pandas, Request, CSV, I created data visualizations and predicted values.
Challenges I ran into
- There were quite a few challenges as I struggled with date formats after making the query and also converting the text data to JSON and then JSON data to csv.
- Also, since the examples were in Jquery, I had to figure out all the functions and data types returned by myself.
Accomplishments that I'm proud of
- Using google finance and Blackrock's Aladdin library, I was able to verify that volatility curve is very similar to stock pricing graph
What I learned
Learned how volatility data is a better predictor for automated stock trading as Risk of buying a share worth $100 will be very different from a $10 share.
What's next for Wolfie-Stock Predictor
- Developing better algorithms where I can achieve r-suqared more than 90% and predict stock rates with more than 95% confidence.

Log in or sign up for Devpost to join the conversation.