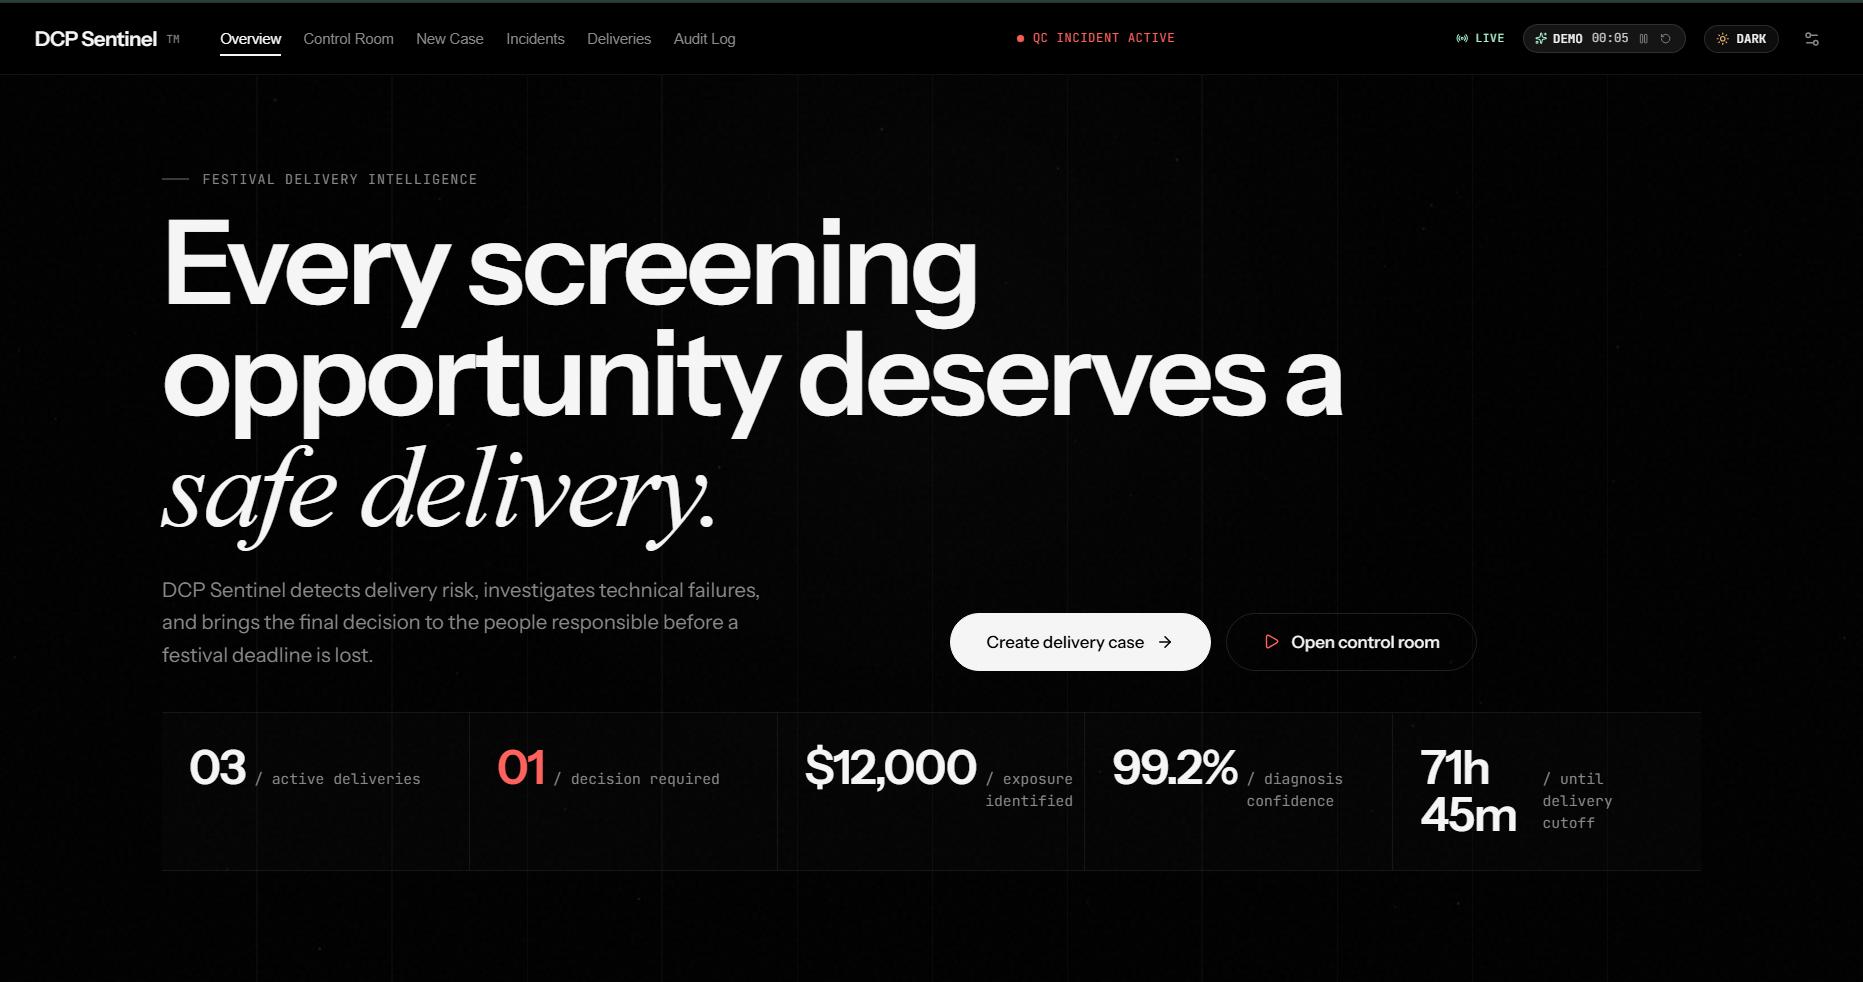
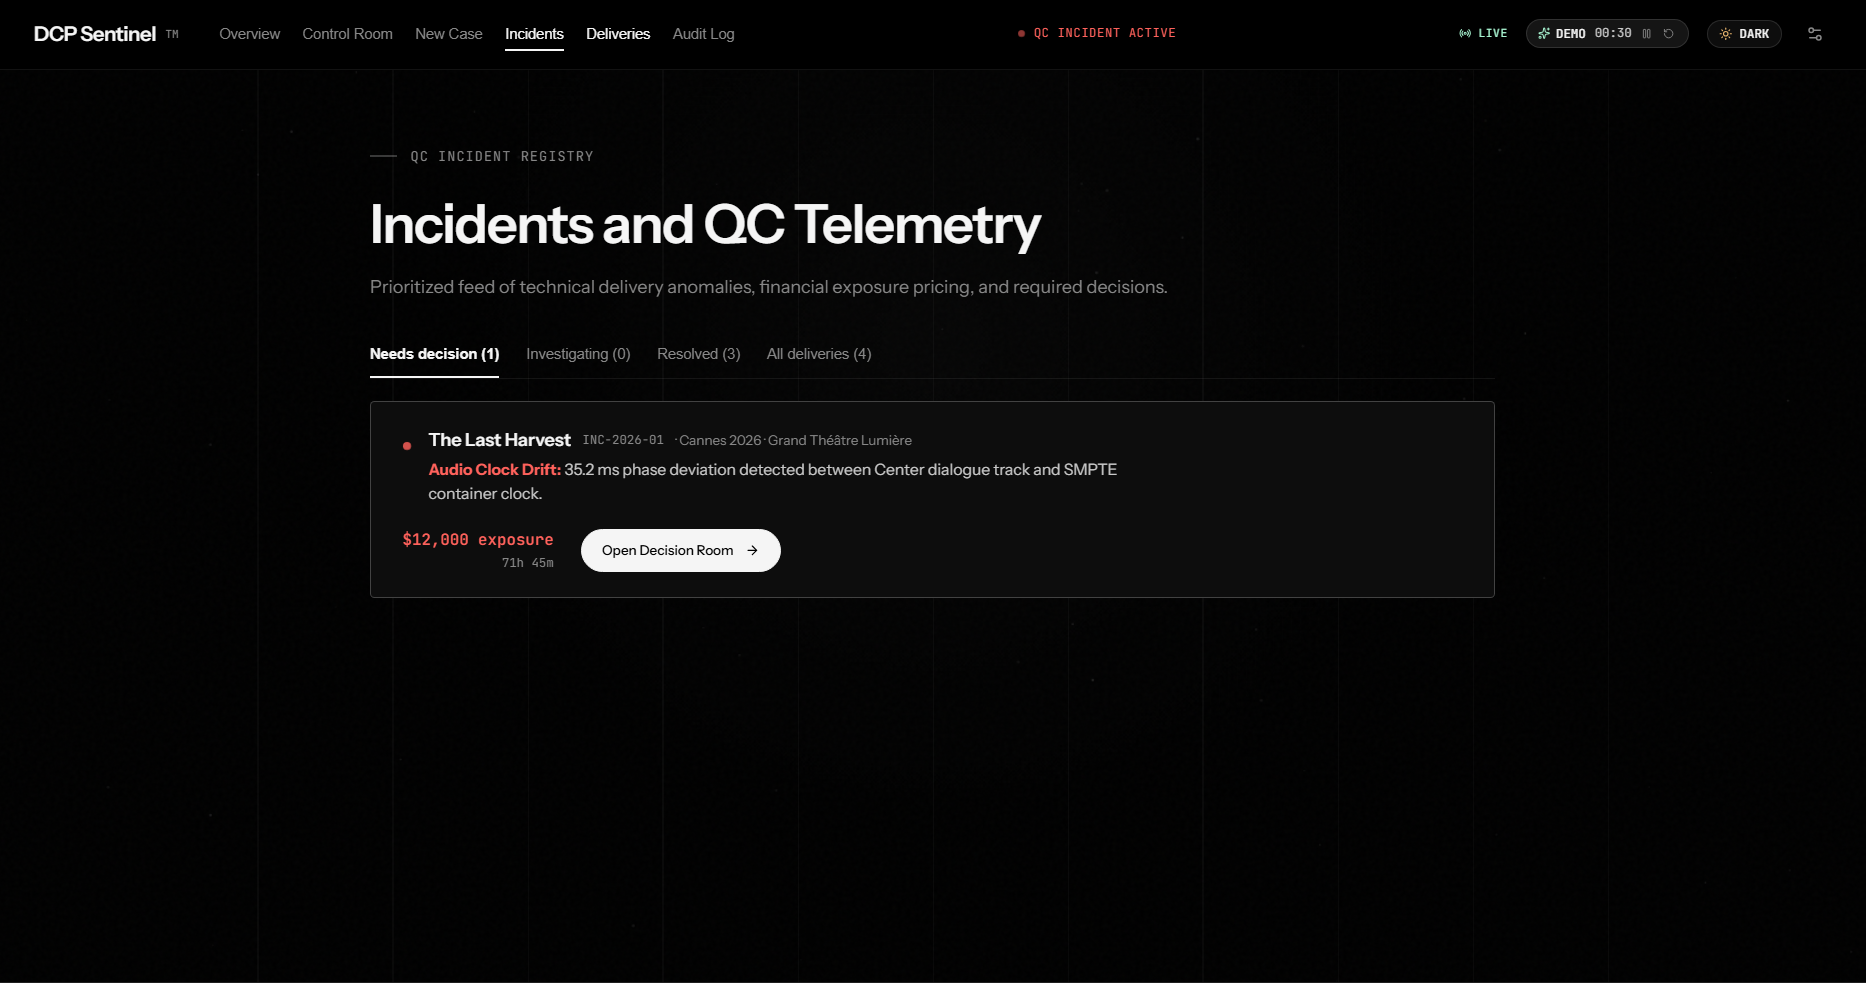
Every year, films are rejected from A-list festivals — Berlinale, Cannes, Venice — not because they aren't good enough, but because a post-production team exported the DCP (Digital Cinema Package) with the wrong audio preset. A 5.1 mix ships when the festival requires 7.1. Subtitles drift 200 ms. The resolution is 1920×1080 instead of the required 2048×858 DCI Flat.
These are $16,000 mistakes — the sunk submission fee, plus a blown distribution deal worth $50,000 in expected value — caused by a single dropdown menu in the export tool.
We built Last Look to make sure no film's festival run dies to a configuration typo.
What it does Last Look is an agentic festival-delivery technical compliance command center. When a film's DCP fails QC before a festival deadline, Last Look:
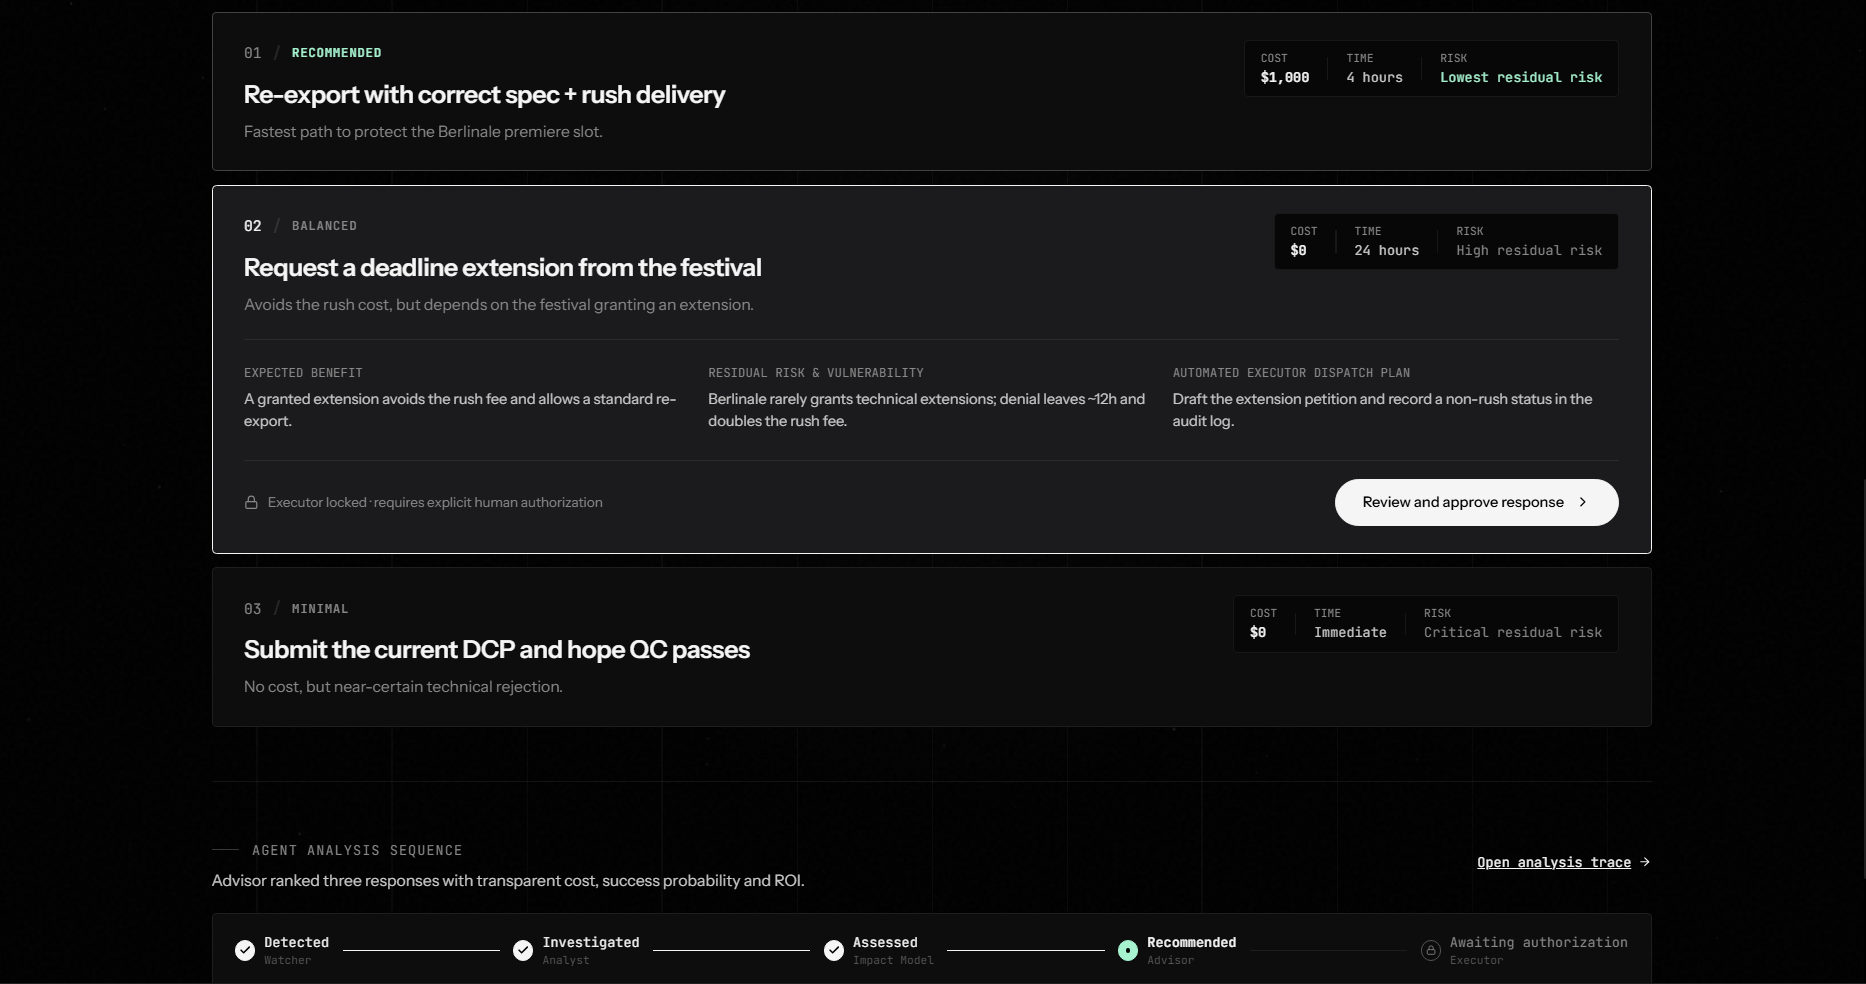
Detects spec mismatches from live Grafana Cloud Prometheus gauges (audio channels, subtitle drift, resolution) Investigates root cause from Grafana Cloud Loki logs (wrong export preset, historical pattern of the same error) Quantifies business impact with a deterministic expected-value model — "$16,000 at risk, 15:1 ROI on a $1,000 rush re-export" Proposes three interventions (re-export, request extension, submit as-is) ranked by ROI, success probability, and residual risk Waits for human approval — no write action happens without an explicit authorization Executes by writing a real, auditable Grafana annotation recording the decision The Four Agents Agent Role Tools Watcher Queries Prometheus for DCP gauge mismatches vs. festival spec Grafana MCP Analyst Root-causes from Loki logs; counts historical pattern occurrences Grafana MCP Advisor Translates diagnosis into ROI-ranked options using the impact model None (narrates deterministic math) Executor The only write path — human-gated, writes a real Grafana annotation Grafana Annotations API How we built it Backend (Python):
Google ADK (Agent Development Kit) with Gemini as the LLM — powers the Watcher → Analyst → Advisor sequential agent chain Grafana Cloud MCP Server (grafana/mcp-grafana) launched over Docker stdio — the agent queries real Prometheus metrics and Loki logs at runtime through 74 registered MCP tools Deterministic impact model (impact.py) — the money math is auditable, tested code; Gemini narrates the numbers but never invents them FastAPI serves /analyze, /investigate, /authorize, and /metrics endpoints OTLP simulator seeds real DCP QC incident data (metrics + logs) into Grafana Cloud using OpenTelemetry Frontend (React + Vite):
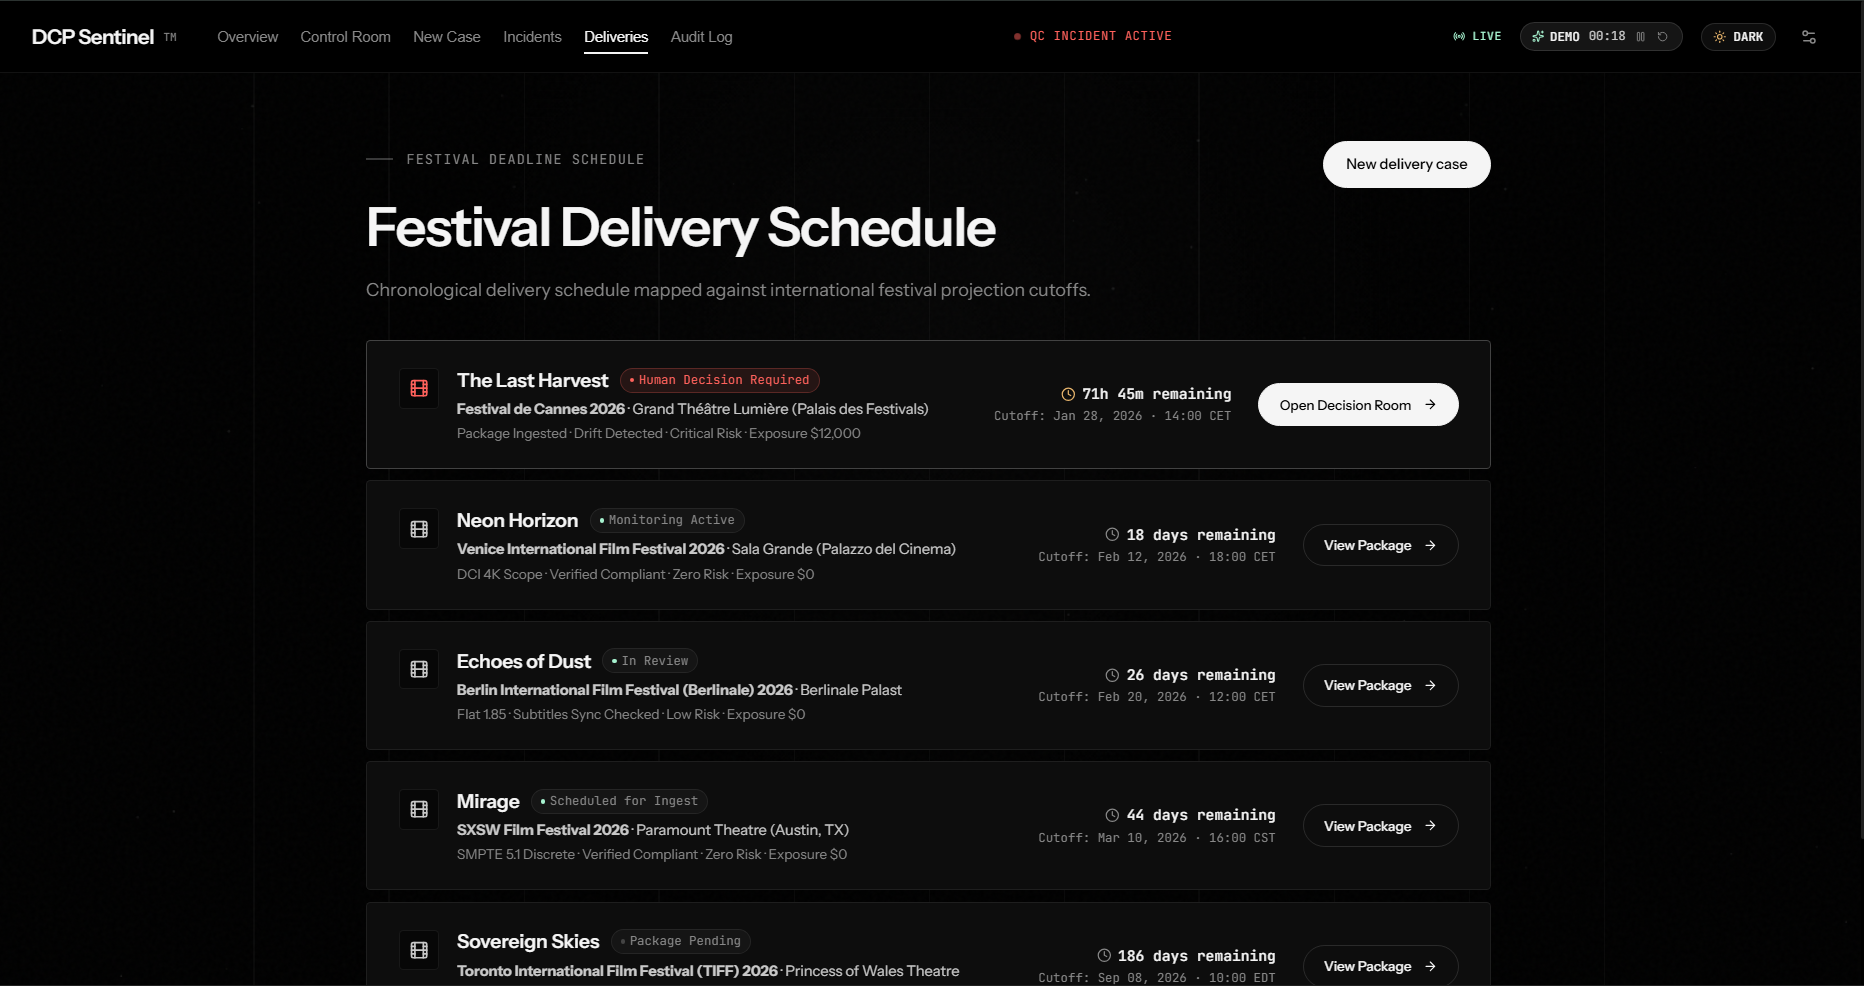
A cinematic Control Room UI with 50 purpose-built React components — incident timeline, evidence drawers, impact blocks, agent trace visualization, decision blocks with approval dialogs 9 full pages: Overview, Create Case, Upload Package, Package Review, Control Room, Incidents, Calendar, Audit Trail, Settings Light/dark theme, demo mode with countdown timer, real-time backend health polling Data Pipeline:
Real DCP package parsing (CPL XML, QC report JSON, festival delivery spec) OTLP push to Grafana Cloud (Prometheus gauges + Loki structured logs) Live metric reads from Grafana Cloud Prometheus datasource proxy Deployment: Render (backend Docker) + Vercel (frontend Vite static)
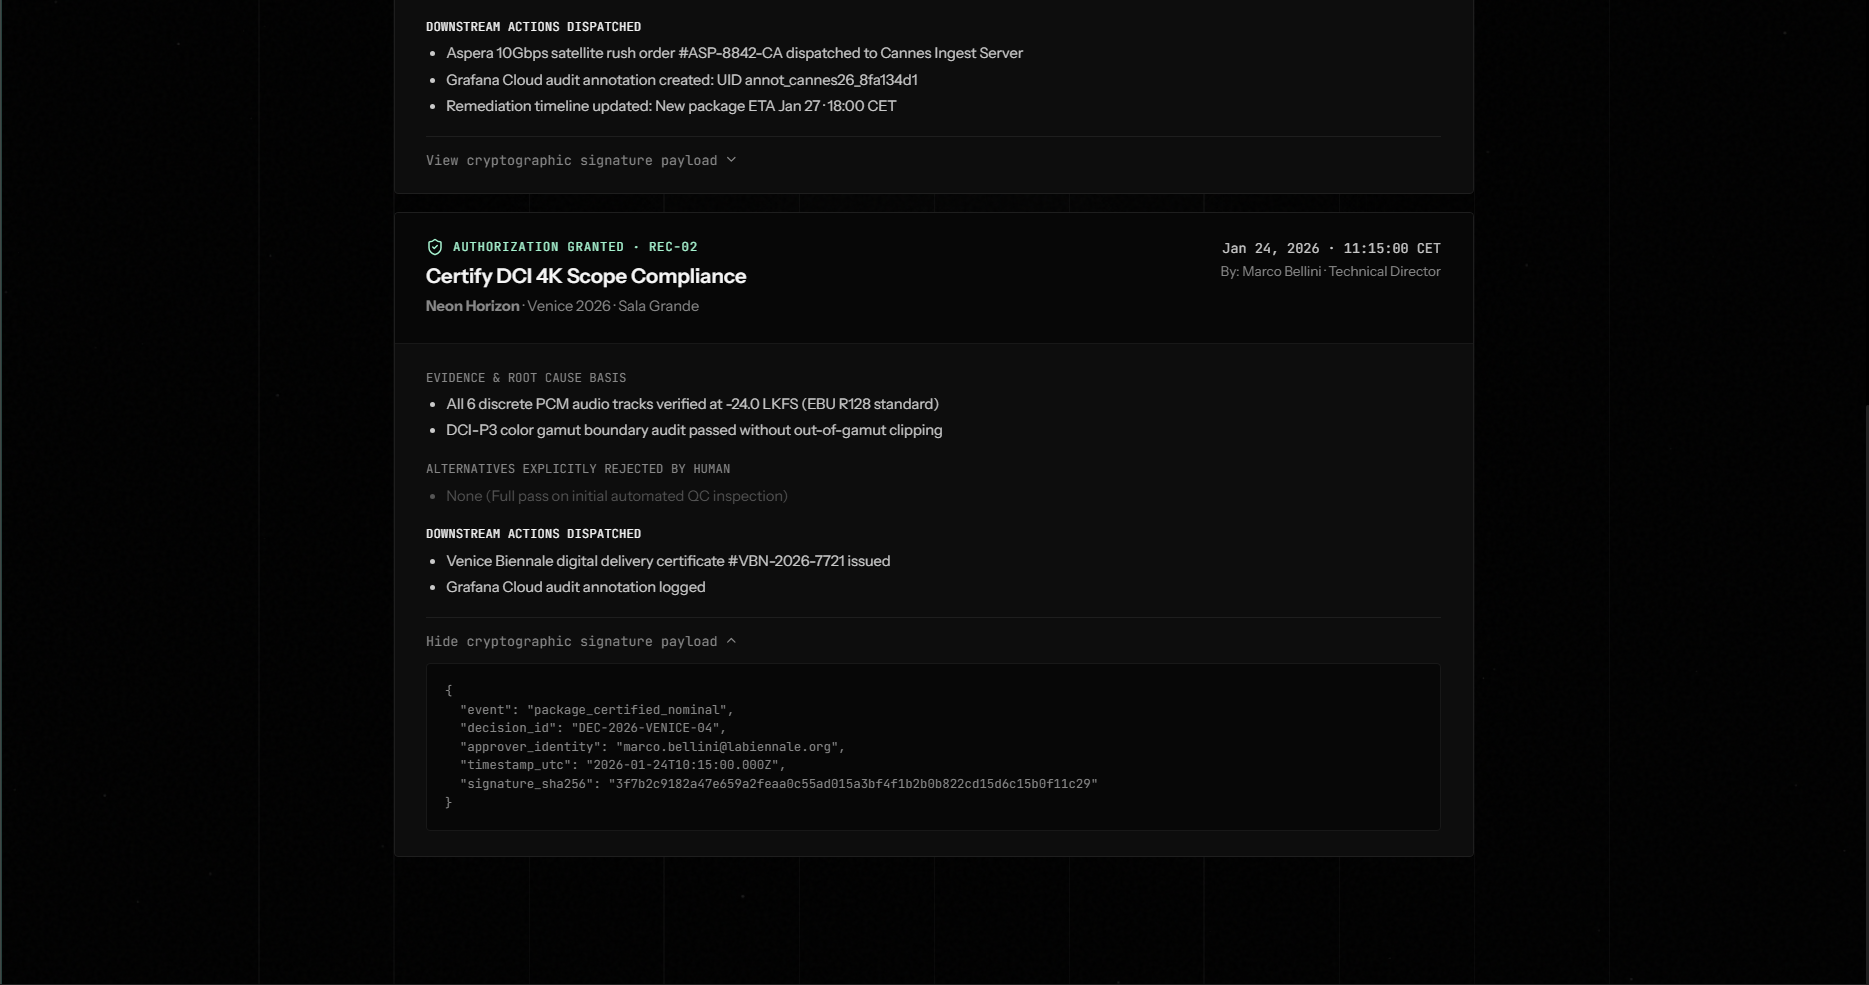
Challenges we ran into Gemini free-tier rate limits — the 3-agent sequential chain makes ~10 Gemini calls, which reliably hit the 20-requests/day/model cap. We solved this by creating a lean single-agent investigator path that does the same job in ~4 calls, caches the result, and serves it from the API. Grafana Cloud OTLP freshness — Grafana Cloud rejects metric samples older than a few hours, so we couldn't seed "6 months of history" directly. Instead, we push a few recent prior-mismatch log lines that the Analyst agent counts at runtime — genuine live data, not mocks. Docker-in-Docker MCP — the grafana/mcp-grafana server runs as a Docker container over stdio. Getting the Docker binary path, environment variables, and timeout configuration correct for Windows was non-trivial. Separating AI narrative from deterministic math — we deliberately kept the impact model (impact.py) as pure testable Python with assertions, while letting Gemini only narrate those numbers. This prevents hallucinated financial figures. Accomplishments that we're proud of Zero mocks in the data path: every number in the UI comes from a parsed DCP package → OTLP → Grafana Cloud → Prometheus/Loki → agent query → deterministic model. No hardcoded values. Human-in-the-loop by design: the investigation agents have zero write tools. The Executor only fires after explicit human authorization, and an empty/invalid request returns HTTP 400 (nothing happens). Real Grafana annotations: the /authorize endpoint writes a real annotation to Grafana Cloud — an auditable decision trail that lives in the monitoring stack. 15:1 ROI clarity: the expected-value model quantifies the swing between making and missing a deadline as ( EV_{on-time} - EV_{missed} = $20{,}000 - $5{,}000 = $15{,}000 ), against a \$1,000 intervention cost. What we learned MCP is powerful but brittle: the grafana/mcp-grafana server exposes 74 tools. Filtering to the 5 tools the agent actually needs (query_prometheus, query_loki_logs, etc.) was essential to keep token usage sane and responses focused. Caching agent output is a production pattern: live Gemini calls are slow and rate-limited. Caching the investigation result to last_investigation.json and serving it from the API made the deployed app fast and reliable without needing the heavy ADK/MCP stack at serving time. Domain specificity matters: a generic "alert → diagnose → fix" agent is vague. Grounding in the DCP/festival-delivery domain — with real CPL XMLs, QC reports, and festival specs — made every agent instruction concrete and every output actionable. What's next for Last Look Multi-festival support: parse multiple delivery specs (Cannes, Venice, Sundance) and compare a single DCP against all of them Automated re-export triggering: integrate with DaVinci Resolve / Colorfront export APIs to kick off the re-export directly from the approval Historical trend dashboard: aggregate past QC failures to identify systemic issues (e.g., a mastering house that always ships 5.1 when 7.1 is required) Slack/email notification pipeline: alert the post-production supervisor the moment a QC failure is detected, before anyone opens the dashboard

Log in or sign up for Devpost to join the conversation.